-
Paper Information
- Next Paper
- Previous Paper
- Paper Submission
-
Journal Information
- About This Journal
- Editorial Board
- Current Issue
- Archive
- Author Guidelines
- Contact Us
American Journal of Mathematics and Statistics
p-ISSN: 2162-948X e-ISSN: 2162-8475
2019; 9(1): 17-22
doi:10.5923/j.ajms.20190901.03

Parametric Survival Modeling of Maternal Obstetric Risk; a Censored Study
 Abstract
 Reference
 Full-Text PDF
 Full-text HTML
Obubu Maxwell1, Babalola A. Mayowa2, Ikediuwa U. Chinedu1, Amadi E. Peace3
1Department of Statistics, Nnamdi Azikiwe University, Awka, Nigeria
2Department of Statistics, University of Ilorin, Ilorin, Nigeria
3Department of Statistics, Abia State Polytechnic, Aba, Nigeria
Correspondence to: Obubu Maxwell, Department of Statistics, Nnamdi Azikiwe University, Awka, Nigeria.
| Email: |  |
Copyright © 2019 The Author(s). Published by Scientific & Academic Publishing.
This work is licensed under the Creative Commons Attribution International License (CC BY).
http://creativecommons.org/licenses/by/4.0/

The world mortality rate has declined 45% since 1990, but still 800 women die every day from pregnancy or childbirth related causes. According to the United Nations Population Fund (UNFPA) this is equivalent to about one woman every two minutes and for every woman who dies, 20 or 30 encounter complications with serious or long-lasting consequences. Young mothers face higher risks of complications and death during pregnancy than older mothers, especially adolescents aged 15 years or younger. Adolescents have higher risks for postpartum hemorrhage, thus, an increased risk of death during pregnancy or childbirth compared with older women. The study is therefore focused on addressing the issue of good statistical estimators, is born out of the weaknesses of the estimators in use, and the apparent lack of research into the application of other methods. Survival analysis technique was employed, once the survival function has been developed, various tests and the modeling of Maternal Mortality, as well as the determination of the appropriate distributions that best describes maternal mortality was done, using both the parametric and non-parametric methods. These include the identification of prognostic factors through regression analysis and the determination of an appropriate distribution for maternal survival. Results of its application to data from Oyo State, Nigeria showed that while about 90% of pregnant women made it alive to delivery, only 86% of them survived to the end of the postpartum period. There were significant differentials by location, and Maternal Age: The Weibull distribution described maternal survival well.
Keywords: Maternal Mortality, Hazard, Survival Analysis, Weibull Distribution, Maternal Survival, Maternal Cox Regression
Cite this paper: Obubu Maxwell, Babalola A. Mayowa, Ikediuwa U. Chinedu, Amadi E. Peace, Parametric Survival Modeling of Maternal Obstetric Risk; a Censored Study, American Journal of Mathematics and Statistics, Vol. 9 No. 1, 2019, pp. 17-22. doi: 10.5923/j.ajms.20190901.03.
Article Outline
1. Introduction
- Maternal death is defined as "The death of a woman while pregnant or within 42 days of termination of pregnancy, irrespective of the duration and the site of the pregnancy, from any cause related to or aggravated by the pregnancy or its management, but not from accidental or incidental causes [1]. The world mortality rate has declined 45% since 1990, but still 800 women die every day from pregnancy or childbirth related causes. According to the United Nations Population Fund (UNFPA) this is equivalent to "about one woman every two minutes and for every woman who dies, 20 or 30 encounter complications with serious or long-lasting consequences. Most of these deaths are injuries are entirely preventable" [2]. UNFPA estimated that 289000 women died of pregnancy or childbirth related causes in 2013 [3]. These causes rage from severe bleeding to obstructed labour, all of which have highly effective inventions. As women have gained access to family planning and skilled birth attendance with backup emergency obstetric care, the global maternal mortality ratio has fallen from 380 maternal death per 100000 live births in 1990 to 210 deaths per 100000 live births in 2013. This has resulted in many countries having their maternal death rates [4] while there has been a decline in world-wide mortality rates; much more has to be done. High rates still exist, particularly in impoverished communities with over 85% living in Africa [5]. The effect of a mother's death results in vulnerable families and their infants, if they survive, are more likely to die before reaching their second birthday [6]. Factors that increase maternal death can be direct or indirect. Generally, there is a distinction between a direct maternal death that is the result of a complication of the pregnancy, delivery, or management of the two, and an indirect maternal death [7] that is a pregnancy-related death in a patient with a preexisting or newly developed health problem unrelated to pregnancy. Fatalities during but unrelated to a pregnancy are termed accidental, incidental, or non-obstetrical maternal deaths. The most common cause of postpartum bleeding (15%), complications from unsafe abortion (15%), hypertensive disorders of pregnancy (10%), postpartum infections (8%), and obstructed labour (6%) [8]. Other causes of maternal death include blood clot (3%) and pre-existing conditions (28%) [9]. Indirect causes are malaria, anemia, [10] HIV/AIDS, and cardiovascular disease, all of which may complicate pregnancy or be aggravated by it. Socio-demographic factors such as age, access to resources and income level are significant indicators of maternal outcome. Young mothers face higher risks of complications and death during pregnancy than older mothers, [11] especially adolescents aged 15 years or younger. [12] Adolescents have higher risks for postpartum hemorrhage, puerperal endometritis, operative virginal delivery, episiotomy, low birth weight, preterm delivery, and small-for-gestational age infants, all of which can lead to maternal death [12]. Surgical support and family support influences maternal outcomes. Furthermore, social disadvantage and social isolation adversely affects maternal health which can lead to increase in maternal death [13]. Additionally, lack of access to skilled medical care during childbirth, the travel distance to the nearest clinic to receive proper care, number of prior births, barriers to accessing prenatal medical care and poor infrastructure all increases maternal deaths. Unsafe abortion is another major cause of maternal death. According to the World Health Organization, every eight minutes a woman dies from complications arising from unsafe abortions. Complications include hemorrhage, infection, sepsis and genital trauma [14]. Globally, preventable deaths from improperly performed procedure constitute 13% of maternal mortality, and 25% or more in some countries where maternal mortality from other causes is relatively low, making unsafe abortion the leading single cause of maternal mortality worldwide [15-20]. This study is therefore focused on addressing the issue of good statistical estimators, is born out of the weaknesses of the estimators in use, and the apparent lack of research into the application of other methods. As stated in [21], the challenge arising from having some censored data, at most one event occurring per subject and highly skewed observations, make the use of standard statistical techniques inappropriate: hence our proposal of the use of survival analysis technique provides more informative estimates with measurable precision and is a much better way of estimating obstetric risk with broader parametric and non-parametric prospects.
2. Materials and Method
- In applying Survival analysis techniques to Maternal Mortality, we make the assumption that the time of maternal deaths are a function of the random process and therefore the time of death is a random variable with a probability distribution and consequently, other related distributions.
2.1. Basic Concepts in Survival
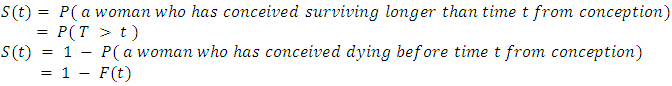
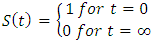
- Let T, denote the survival time of a woman from her time of conception. The distribution of T can be characterized by three equivalent functions [22].Survival Function,


2.1.1. Probability Density Function
- The probability density function of the survival time is defined as the limit of the probability that a woman dies in the short interval, t to
 , per unit width, ∆t, or simply the probability of dying in a small interval per unit time. It can be expressed as
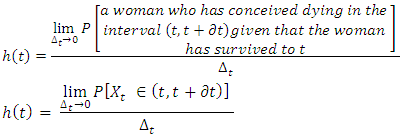 Where
Where  denotes a woman who has conceived, dying after she has survived to time t. These functions are related by;
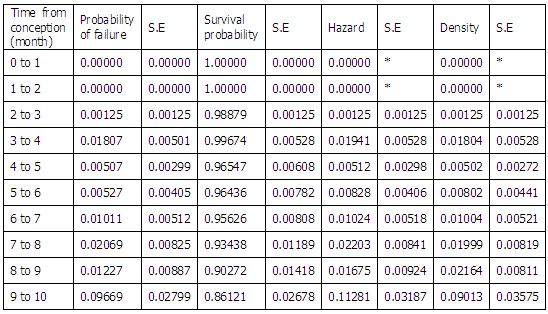
2.1.2. Estimating the Survival Functions
- Survival functions can be estimated using a number of options; the Kaplan-Meier and the Life Table Method. In this study, the Life table method, a non-parametric method to estimate the survival functions was used. This method, which uses time intervals, estimates the survival functions up to the upper limit of each interval, and estimates the hazard and density functions at the midpoint of each interval [23]. For the
 interval, let
  be the end time and
  be the conditional probability of dying. Then;
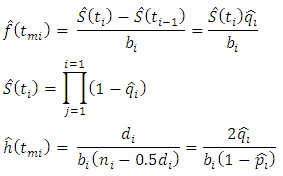 Where,
 is the mid-point of the
  interval.
  is the number of women dying in the
  interval after their conception.
  is the number of women exposed in the
  interval after conception.
  is the conditional probability of a woman dying in the
  interval after conception
  is the conditional probability of a woman dying in the
  interval after conception.
  is the width of the
  interval.The standard error of the survival function [18] is estimated by:
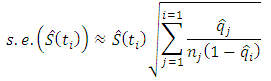 while that of the hazard function [19] is estimated by;
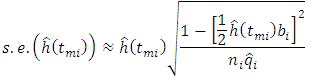 The probability density function [19] is estimated by;
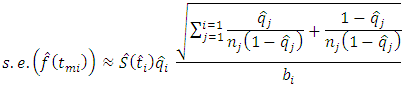
2.1.3. Modeling and Other Tests Based on Survival Techniques
- Once the survival function has been developed, various tests and the modeling of Maternal Mortality, as well as the determination of the appropriate distributions that best describes maternal mortality can be done, using both the parametric and non-parametric methods [24]. These include the identification of prognostic factors through regression analysis and the determination of an appropriate distribution for maternal survival.
2.1.4. The Log-Rank Test
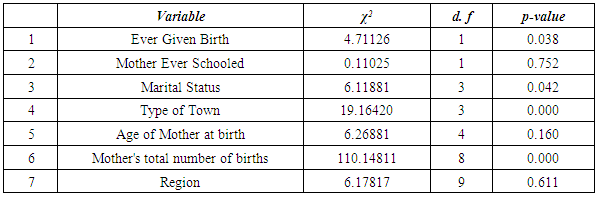
- The Log-rank test, [25] a non-parametric test of difference for survival functions, is the most widely used technique when data is censored. It measures the difference in the survival for the different groups at each of the given times. For a k factor group, this test the hypothesis that;
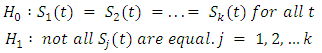
 This is tested as a chi-square test which compares the observed numbers of failures to the expected number of failures under the hypothesis. Thus, given that
  and
and  is the observed and expected number of deaths respectively for the
  group, the test statistic is given by;
 Where
Where
 is the number of women still exposed to the risk of dying at time up to to t for the
  group.
  is the total number of deaths for all groups at time t. Thus,
 has approximately a chi-square distribution with
  degrees of freedom. A large chi-square value will lead to a rejection of the null hypothesis in favor of the alternative that the k groups do not have the same survival distribution.
2.1.5. Proportional Hazard Regression
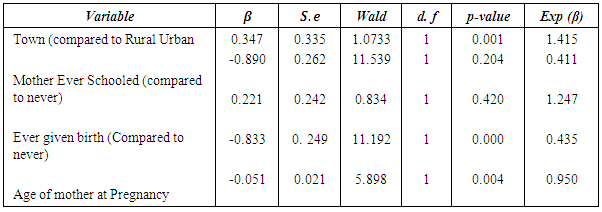
- The Cox proportional regression [26-28] was used to determine the effect of some socio economic and demographic factors on maternal survival based on the assumption of proportionality. In this model, the hazard for an individual is assumed to be related to the covariates through the equation;
 Taking the logarithm of both sides, the model can also be written as
 Where
Where  The ratio of the hazard for the two individuals i and j (say rural women and urban women) is then given by;
 Where
Where  measures the relative risk for the
  woman over the
  , with respect to the change in the
  covariate,
2.1.6. Determination of an Appropriate Distribution
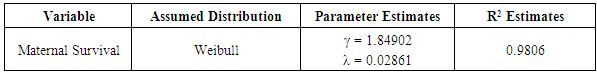
- Graphical and analytical method exists for the determination of an appropriate distribution for survival data. In this study, the hazard plotting technique [29], a graphical plotting technique designed to handle censored data was used. The shape of the hazard plot gives a good indication of the distribution that could best fit it: For instance, a constant hazard would suggest an exponential distribution; while a first increasing and then decreasing hazard would suggest a log normal or log-logistic model, a monotonically distribution could suggest a log-logistic model; The Weibull distribution could have an increasing, decreasing or constant hazard. The monotonically increasing shape of the hazard plot for maternal mortality, suggests that the assumption that maternal survival had a Weibull distribution. The parameters of the assumed Weibull distribution were then estimated using the hazard plotting technique. The adequacy of the fit was also assessed using R-squared value of the linear plot of
 against
  is the cumulative hazard at time t.
3. Results and Discussion
|
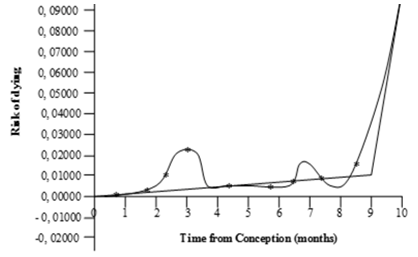 | Figure 1. Hazard plot for Maternal Survival against time |
|
|
|
4. Conclusions and Recommendations
- This study has clearly shows that Survival Techniques can be applied to the study of Maternal Survival. Mortality is adequately described by a Weibull model. The Weibull distribution which described maternal survival, had shape and scale parameters
 , indicating an increasing risk of mortality with time and thus a hazard that increases at an increasing rate: The prognosis factors that influences the hazard, and hence survival, are the determinants of the Weibull distribution that described maternal survival for this data was determined to be
  and
and  respectively.