Damola M. Akinlana1, Serifat A. Folorunso2, Oluwagbenga T. Babatunde3
1Department of Mathematics and Statistics, University of South Florida, USA
2Department of Statistics, University of Ibadan, Nigeria
3Department of Statistics, University of Nigeria, Nigeria
Correspondence to: Oluwagbenga T. Babatunde, Department of Statistics, University of Nigeria, Nigeria.
| Email: |  |
Copyright © 2019 The Author(s). Published by Scientific & Academic Publishing.
This work is licensed under the Creative Commons Attribution International License (CC BY).
http://creativecommons.org/licenses/by/4.0/

Abstract
In this study, we investigated the conditional volatility between stocks and REITs in BRICS countries by estimating the conditional correlation and setting up the appropriate hedging strategy between the two market players-REITs and stocks prices using the CCC-MGARCH and DCC-MGARCH models. Four GARCH models were considered which are GARCH, EGARCH, GJR and IGARCH. We considered the data sample from 19 March 2012 to 08 November 2017, covering a total of 1473 data points from the BRICS countries. The LM test for constant correlation was conducted to choose between CCC and DCC for each of the MGARCH model. The conditional variance of stock index and REITs index and the conditional covariance between stock and REITs indices are obtained from each of the MGARCH model and used to compute the hedge ratio as well as weight of stock and weight of REITs for a unit price of stock-REITs portfolio. The CCC model variants results obtained showed that, returns spillovers actually existed between stocks and REITs markets in the BRICS economies, while the stock-REITs portfolio estimates for all the countries revealed that more investments are expected for stock asset allocation in stock-REITs portfolio in the BRICS economies.
Keywords:
REITs, BRICS, Stocks, Conditional Volatility, MGARCH
Cite this paper: Damola M. Akinlana, Serifat A. Folorunso, Oluwagbenga T. Babatunde, Conditional Volatility and Correlation between Stocks and REITs in BRICS Countries: Advice to Real Estate and Portfolio Managers, American Journal of Mathematics and Statistics, Vol. 9 No. 1, 2019, pp. 1-10. doi: 10.5923/j.ajms.20190901.01.
1. Introduction
Persistence in volatility is a common empirical finding in financial economics and studies on volatility persistence and returns spillovers in assets prices have been overwhelming in literature. For instance, Yaya et al [1] recently applied the fractional persistence approach and the Constant Conditional Correlation (CCC) modelling framework to investigate volatility persistence and returns spillovers between oil and gold markets using daily historical data from 1986 to 2015 partitioned into periods before the global crisis and after the crisis. They found the volatility in the gold market to be less than that at the oil market before and after the crisis periods, while the returns spillover effect was bidirectional before the crisis period and unidirectional from gold to oil market after the crisis. Although researchers and financial analyst have studied movements in aggregate stock market, oil and gold volatility, studies on volatility persistence and spillovers effects between stocks and real estate investment trusts is still limited and under debate. How much proportional investment should be made on these two differing markets and to what extent is the correlations between them, are some of the questions that have been a borne of concerns to investors and portfolio managers. Moreover, due to the increasing cost of debt/equity capital that negatively affects Real Estate Investment Trusts (REITs), firm values and capital flows, REITs have experienced dramatically high return volatility in recent years. Li [2] examined the determinants of REITs volatilities using U.S equity REITs data from 1995 to 2009. His findings suggested that, systematic risk positively affects REIT return volatility, with a higher impact in up markets than in down markets. That is, a positive correlation exists between trading volume and REIT return volatility. Consequently, given the importance of real estate in the overall economy and multi-assets portfolio, and a limited number of studies focusing on the nature and causes of changes in variance of REITs returns over time, the primary objective of this research is to study what determines REITs return volatility. Specifically, this study seeks to model conditional volatility between stocks and REITs in BRICS (Brazil, Russia, India, China and South Africa) countries by estimating the conditional correlation and setting up the appropriate hedging strategy between the two market players. The relationship between the real estate investment trust markets and stocks markets is of great importance to financial analyst and policy makers mainly due to the fact that both are major investment areas within the market of any economy. Moreover, studies have shown that REITs are correlated to the stock market to the extent that REITs trade on major exchanges in the public markets. That is, both are subject to the same condition of volatility persistence. For instance, both compete with, and share the biggest proportion in the liquidity pool of investment funds of the economy of any nation. However, their difference lies in their varying performance level and susceptibility to volatility persistence.While traditional stock prices are highly driven by corporate profits, and whether or not earnings satisfy estimates, REITs values are largely influenced by the amount of income collected from property rents. The fact that stocks and REITs prices are driven by separate factors diminishes the correlation between the two groups. However, for volatility persistence-a condition that occurs when stock prices displays unexpected fluctuations in stock market, the correlations between the stock market and REITs are obvious. A major reason for this is because, REITs are considered equity investments and therefore, not immune from the risk of varying prices that plaque traditional stock as well.Furthermore, a major dilemma for investors and portfolio managers is the asset allocation problem in these two markets. For instance, what is the level of correlation between these two markets and consequently, how much diversification can they offer investors and portfolio managers are some of the questions that have been debated in literatures. To this point, most studies have focused on advanced markets and the dynamic linkages between real estates and stock markets for developing markets. This paper contributes to the literature by examining the relationship between real estate markets and stock markets of the BRICS economies. The BRICS economies, being considered as the new building blocks of the global economy, have experienced a relatively high rate of economic growth. The BRICS economies rose from 11 percent of global GDP in 1990 to 25 percent in 2011 and are poised to reach 40 percent by 2050. It is an obvious fact that, growth and diversity coexist in the BRICS community as a whole. While all countries enjoyed higher growth for a large part of the last decade, each country is also known for distinctiveness. Russia is a commodity-driven economy, China is a powerhouse of exports, India is a domestic demand-driven economy, Brazil has much developed economic structure and South Africa represents the fast-growing region of Africa. Financial analysts have noted that, the five countries in the BRICS community, which represents a powerful force in the global economy, play an important role in G20 shaping global economic policy and financial stability. However, following the global economic and financial crisis that began in 2008 as a result of economic slowdown and financial markets setback in the US and Europe, exports from BRICS to developed markets and investments into their respective economies declined adversely, impacting the growth prospects collectively and individually. Consequently, the financial markets of the BRICS community, with the exception of China, have experienced varied levels of volatility. The stock market value of BRICS is at a three-year low. Top global companies from the BRICS countries suffered erosion in market values, leading to sizeable slippage in their respective global rankings. To these effects, the policy makers in the BRICS governments have continued to come up with proactive policies that reinvigorate their domestic economic climate and also establish stronger linkages with other emerging markets. The BRICS community is characterized by a strong middle class with potential for higher savings. Increasing reliance on market-related instruments such as stocks, REITs and other structured products, which suffered badly after the financial crisis, has dampened the spirit of investors. It is therefore important to reignite investors’ confidence in these financial markets. Consequently, a major point of action is the need to model co-movement in markets volatilities between REITs and stocks in the BRICS countries. Moreover, there is the need to study the market surge between the two asset prices in terms of volatility using variants of bivariate Generalised Autoregressive Conditional Heteroscedasticity (GARCH) model1. This is a class of Multivariate GARCH (MGARCH) model with constant (CCC) and dynamic conditional correlation (DCC) and covariance matrices proposed in Bollerslev [3] and Engle [4], respectively, as variants of MGARCH model with full parameterized BEKK model of Baba et al. [5]. Based on the principle of Black [6]-the leverage effect, that is, unequal impacts of positive and negative returns on conditional variance series, thus, asymmetric versions of the CCC and DCC were introduced, respectively in Hoti, Chan and McAleer [7] and Cappiello et al. [8]. The aim of this paper is to investigate the conditional volatility between stocks and REITs in BRICS countries by estimating the conditional correlation and setting up a strategy for the management of REIT in the presence of Stock’s risk using estimates of optimum portfolio weight and hedge ratio. The rest of the paper is as follows: Section 2 reviews relevant literatures on the market co-movement and volatility between REITs and stocks. Section 3 presents the D/CCC- GARCH framework with asymmetry. This further presents the methodology for the portfolio management strategy for management of REITs and stocks. Section 4 presents the data analysis and results. Section 5 renders the conclusion and policy implications to real estate and portfolio managers.
2. Review of Literature
In the literature, there exists mixed empirical evidence among professional asset managers as to whether or not REITs possessed a systematic link to either the aggregate stock market or the real estate market. Several authors have argued that commercial real estate offers diversification benefits to institutional investors because of its low correlation with commonly used stock price indices (see Chandrashekaran [9] and He et al. [10]). Clayton and MacKinnon [11], in their results, revealed that REITs are similar to both stock and real estate markets, with variation in their relationship over time. Specifically, their study indicated that, up to 1992, REITs have been linked closer to the equity. However, in latter period, the relationship to the real estate market has become more predominant.During the global financial crisis – which has its roots in the U.S housing and mortgage market, the resulted loss of confidence in the financial sector had a huge negative impact on share prices all over the world, triggering an extremely rapid and deep contraction in global economy. Tobias et al. [13] examined the relationship between REITs and utility stocks by analyzing data which accounted for the existence of a massive structural break in February 2007 from the United States. Their results indicated that investing in U.S. REITs during the financial crisis was more risky relative to investments in utility stocks.Additionally, few studies have investigated time-varying correlations among scrutinized real estate investment trades. These studies generally verify and proposed that; correlations among equity markets vary considerably through time and stock market correlations increase in the periods of high volatility. Busaranon and Chintrakarn [14] employed various models on monthly data of 24 REITs in other to examine the relationship between REITs and Stock Exchange of Thailand (SET) index. Their results revealed each REITs portfolio having a positive relationship with the SET index. However, for the Australian data, the Exponential-Generalized Autoregressive Conditional Heteroscedasticity (EGARCH) was employed in Lee [15] to examine the volatility in Australian REIT future. His results suggested that, news originating form stocks and the REITs markets significantly influenced REITs future, with the negative news having much impact. REITs have become an increasingly important property investment vehicle in US and several developed countries in recent years. Lin and Lee [16] applied a Panel Smooth Transition Regression model (PSTR) to investigate the nonlinear dynamic relationship between financial variables and REITs of Japan and U.S with 3-month interest rate change as threshold variable. Their result revealed that, the relationship between REITs returns and stock returns is significantly negative in the low interest rate regime. However, in the high interest rate regime, the relationships between REITs return and real estate return and stock return are significantly positive. The intrinsic value of equity REITs is tightly linked to the value of its underlying commercial real estate portfolio, simply because the value of a REIT’s business franchise generally plays a minimum role in stock valuation. The question of whether REIT asset expansion tends to predict future stock returns was discussed in Ling et al. [17]. They examined the impact of asset growth rates on the future stock performance of 309 publicly traded REITs, and observed that fast growing REITs tend to underperform slow growing REITs. Moreover, unlike common stocks, evidence was also found that the growth effect is weaker in REITs markets due to the constrained environment in which REITs operate. Adams et al. [18] estimated the risk among 74 U.S REITs using the state dependent sensitivity value-at-risk approach. This methodology allows for the quantification of the spillover size as a function of a company’s financial condition. That is, considering periods of tranquil, normal, and volatile REITs prices. Their results provide new insights concerning the relevance of geographical diversification for REITs and have important implications for the investment and risk management decisions of real estate investors, mortgage lenders, home suppliers, and policy makers. To our knowledge, available literatures for the BRICS economies tend to examine the impact of news and shocks from the U.S to the individual country stock prices. For instance, Nawal and Raman [19] applied the GARCH model to examine the impact of news coming from US on the returns of global index, as well as the returns generated by the indices of the BRICS countries. Their result shows that BRICS stock markets except, Brazil and Chinese stock markets have been significantly affected by the news in US stock market. More so, there exists a significant difference in the stock return volatility in all the countries stock markets. With the varied levels of volatilities experienced by the BRICS economies in recent years, investors, policy makers and risk managers of these countries are certainly interested in optimal allocation for risk management decisions. In this regard, this paper aims to model conditional volatility and correlation between stocks and REITs in BRICS economies.
3. Methodology
We applied two types of MGARCH models in this paper. These are the; CCC-MGARCH and DCC-MGARCH. Restrictions are usually introduced in estimating the parameters of MGARCH models in other to reduce the number of parameters. In respect to this, the conditional correlation matrix of the CCC model proposed by Bollerslev [3] is assumed to be constant with respect to time. It is therefore necessary to test the adequacy of an MGARCH by testing for constant correlations. These models are specified based on test proposed for testing the null hypothesis of constant conditional correlation (CCC) against the dynamic conditional correlation (DCC), as given in Tse [20]. The LM test statistic proposed in Tse [20] will be used for this purpose. Starting with the bivariate specification of CCC-MGARCH model given as (1-3) below: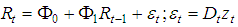 | (1) |
 | (2) |
 | (3) |
From (1), 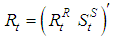 with
with  and
and  as the logged differenced of REIT and stock indices, respectively, that is log-returns of each series at time t;
  is a squared matrix of coefficients
  ;
;  is a matrix of constant terms of the form,
  ; the residual series, expected to be serially correlated, and plagued with heteroscedasticity is given in a matrix
  , where
  and
and  are given, accordingly as the residuals from mean equations for REIT and stock return series, respectively. Also, the multivariate Gaussian process is assumed in (1), and
  is a vector of independently and identically distributed errors. Equation (1) is linked with (2) by the multivariate conditional distribution
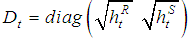
  where the diagonal matrix of
  gives the conditional variances
  and
and  for return series,
  and
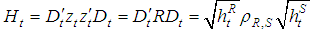
and  , respectively. Equation (3) is the bivariate variance equation with the overall conditional variance series,
  .
.  is the constant conditional correlation coefficient between
  and
and  . The individual
  and
and  are the conditional variance series from the univariate GARCH(1,1) model or any univariate EGARCH(1,1), IGARCH(1,1) or GJR(1,1) model. In the case of GARCH(1,1) model, the univariate model is,
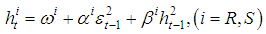 | (4) |
where the constant  , and
, and  and
and  are the ARCH and GARCH parameters, respectively, and these are defined such that
  and
and  . The IGARCH (1,1) model is a GARCH (1,1) with a unit root i.e
  . The EGARCH (1,1) and GJR(1,1) models are given, respectively as,
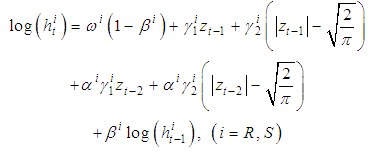 | (5) |
and, | (6) |
where from model (5), parameters  and
and  determine the magnitude and sign of asymmetry, respectively. Similarly, from model (6), asymmetry is measured via
  parameter where the indicator function
  becomes 1 for negative return, and for positive returns, this becomes 0. Looking at elements of the matrix
  in the mean equation (1),
  and
and  are the autoregressive parameters of order 1 for REIT and stock returns, respectively. For DCC-MGARCH specification in (3), we re-specify,
 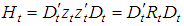 | (7) |
with,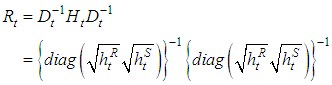 | (8) |
and  where
where  and
and  are the parameters measuring the effect of previous shocks and previous conditional correlations on the current conditional correlation, and there parameters are non-negative.
  is the unconditional variance, computed as,
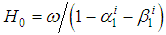 | (9) |
By imposing the restriction  ,
,  becomes a constant and the entire model becomes CCC-MGARCH.
3.1. REIT Asset Management in the Presence of Stock Portfolio’s Risk
Kroner and Ng [21] and Arouri et al. [22] proposed a strategy to manage investments on two assets in the presence of risk from an asset. Thus, they suggest minimizing risk without reducing expected returns by using the estimates of the conditional variances and covariances from the MGARCH model. That is, a hedge portfolio of stock and REIT assets is analysed as stock-REIT portfolio weight as,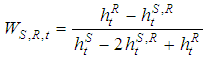 | (10) |
where 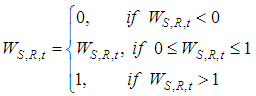 such that
  is the weight of stock in a unit price of stock-REIT portfolio at time t,
  is the conditional covariance between stock and REIT indices,
  is the conditional variance of REIT index and
  is the conditional variance of stock index. The optimal weight of REIT in the stock-REIT market portfolio is evaluated as
  .A strategy for risk minimization based on hedge ratios is presented in Kroner and Sultan [23]. This is adapted as,
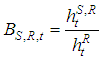 where low value for
  implies that a unit value of stock can be hedged by taking a short position of
  units in REIT.
4. Data and Empirical Results
The datasets used in this paper are time series of REITs and stock price indices for Brazil, Russia, India, China and South Africa. The REITs data for the five countries are proxied by FTSE EPRA/NAREIT indices tickers obtained through Bloomberg terminals. The indices are named ENEIBRU (Brazil), ENEIRUU (Russia), ENEIINU (India), ENEICNU (China) and ENEIZAU (South Africa), for corresponding stock price indices: Ibovespa Brasil Sao Paulo Stock Exchange (IBOV), Russian Trading System Cash Index (RTSI), Bombay Stock Exchange index (SENSEX), Shanghai Stock Exchange Composite Index (SSEC) and Johannesburg Stock Exchange (JSE), respectively. We considered the data sample from 19 March 2012 to 08 November 2017 covering a total of 1473 data points. The descriptive statistics for the daily log-returns of the countries REITs data and stock prices as well as necessary pre-tests for heteroscedasticity in the returns are reported in Table 1. The summary results suggest that highest positive return is observed in China REITs data (0.0523%) while the remaining four countries have negative REITs returns. Thus, it implies that, only the China REITs experienced a general increase in REITs data among the BRICS countries considered in this paper. For the stock prices, highest positive return is observed in South Africa (0.0382%) followed by China (0.0237%) and then Russia (0.0211%). This implies that the stock prices of these countries experienced a general increase during the sample period. Brazil experienced the smallest average returns for both REITs and stocks prices. This implies that Brazil experience the smallest volatility persistence in the sample period considered when compares to the other BRICS countries.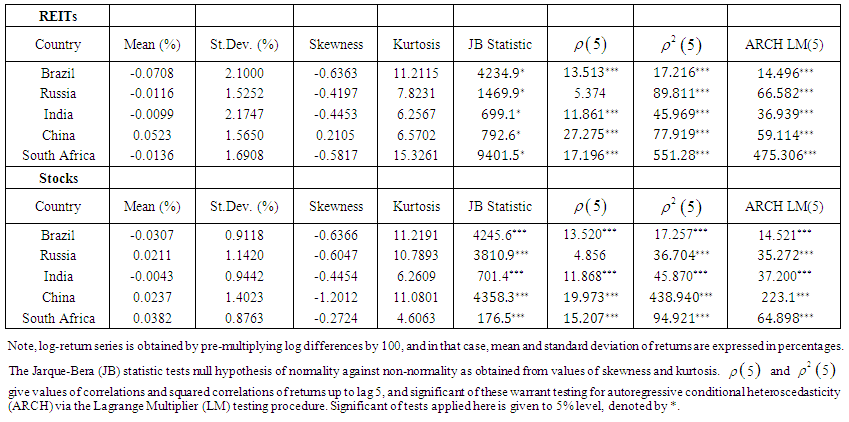 | Table 1. Summary Statistics |
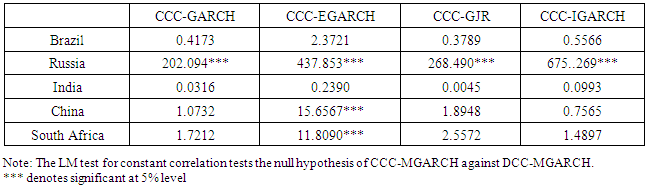
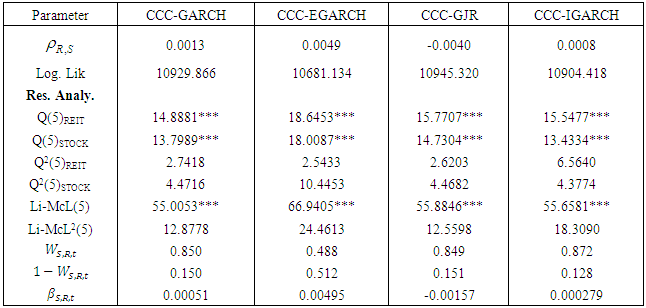
Highest risk in REITs returns, as approximated by a standard deviation of 2.17% is observed in India REITs returns, and next to this value is 2.10% for Brazil REITs returns. Stock price returns also present very high risk approximated by 1.40% standard deviation in China, followed by 1.14% standard deviation in Russia. Both positive and negative skewness values were observed. With the exception of China, negative values were observed for the BRICS countries REITs returns. More so, negative values were also observed for all the five countries in the skewness estimation of their stock prices. Thus, with the exception of China, there is a higher probability for investors to experience daily negative returns in REITs and stocks trading in BRICS countries. Furthermore, kurtosis values for REITs and stock price data of all the five countries were extremely high above the range for normal distribution. We carried tests of correlation of current return on past log-returns and squared returns, up to lag 5 and observed significant dependencies in most of the cases. Finally, heteroscedasticity test by means of ARCH Lagrange Multiplier (LM) test was able to reject the null of no heteroscedasticity in all the REITs and stocks log-returns. The result presented in Table 2 is used to decide between CCC-MGARCH and DCC-MGARCH for each of the BRICS countries based on the assumption of constant correlation. The CCC-MGARCH will be applied where the tests are not significant and DCC-MGARCH will be applied where the tests are significant. Based on the CCC test, we fitted the appropriate CCC/DCC MGARCH models to the REITs/stock of each BRICS country and the results are presented in Table 3-7. The estimates of the conditional correlation between REITs and stock prices for the MGARCH models considered for Russia, China and South Africa were significant whereas that of Brazil and India were not significant. The optimal weight of stock in $1 of stock-REITs portfolio and the optimal weight of REITs in $1 of stock-REITs portfolio for each of the BRICS country are also presented in Table 3-7. In Brazil, Russia and China the weight of the stock for all the fitted models is higher compare to the weight of the REITs. This implies that for every $1 investment in the stock/REITs, higher percentage should go to stock with respect to the weight. The weight of stock in India and South Africa for CCC-EGARCH and DCC-EGARCH respectively is lower compare to the weight of the REITs whereas the weight of stock for the other models is higher.Table 2. LM test for constant correlation
 |
| |
|
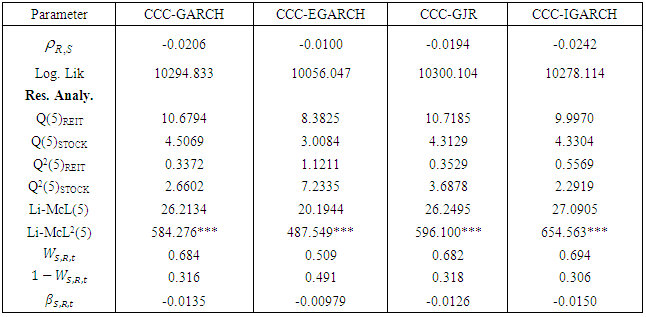
Table 3. MGARCH Results for Brazil
 |
| |
|
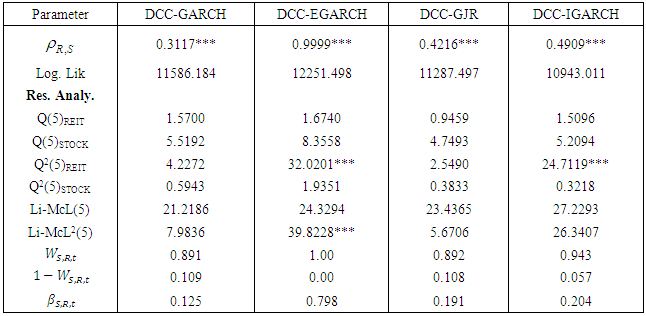
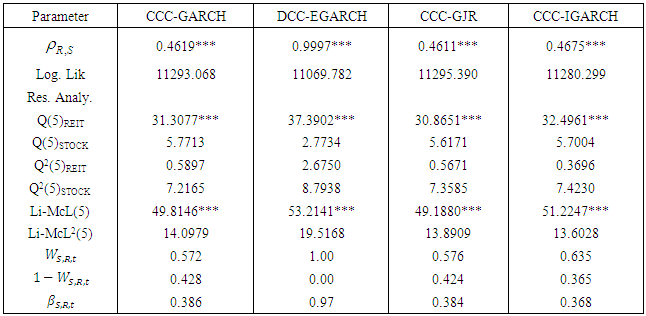
Table 4. MGARCH Results for Russia
 |
| |
|
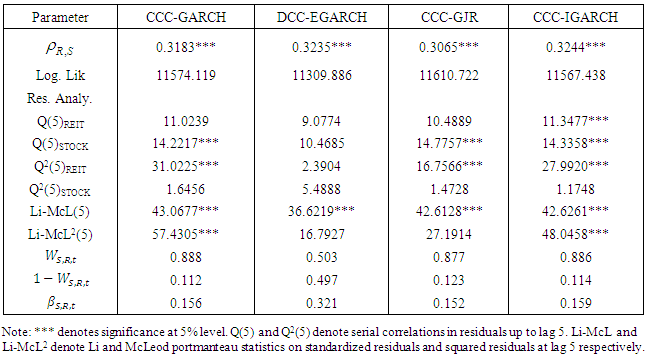
Table 5. MGARCH Results for India
 |
| |
|
Table 6. MGARCH Results for China
 |
| |
|
Table 7. MGARCH Results for South Africa
 |
| |
|
In order to determine the appropriate MGARCH type model for modelling each of the REITs and stocks series of the BRICS countries, we performed nonlinear GARCH tests on the series. Using the AIC and SBIC selection criteria, the results presented in table 8 below shows that the returns of REITs and stocks series for Brazil, Russia, India, China and South Africa displayed CCC-GJR, DCC-EGARCH, CCC-GJR, DCC-GJR and CCC-GJR multivariate GARCH specifications respectively. The log likelihood reported in table 3-7 also supported the selection of the above models with each of the above model having the highest log likelihood value in its respective country.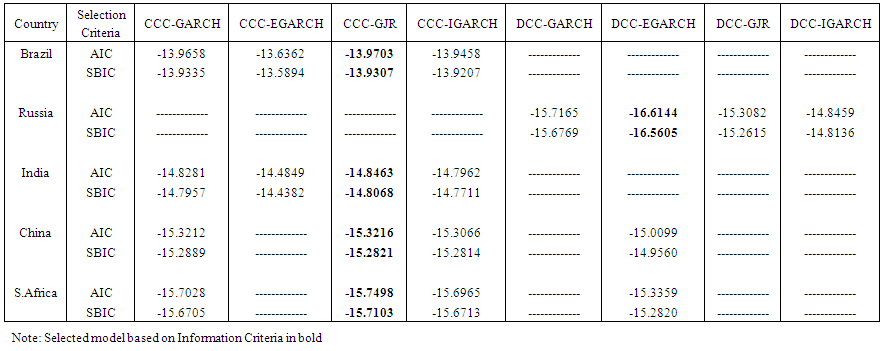 | Table 8. MGARCH model selection |
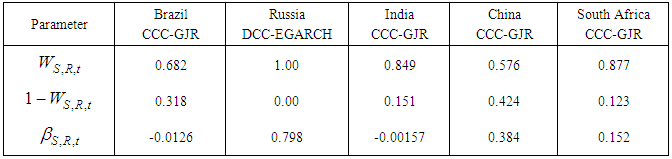
Now that model selections have been conducted, we present in Table 3 above, the results of the CCC and DCC MGARCH models. With the exception of India, the estimates of constant conditional correlation coefficients between the returns of REITs and stocks prices are significant in BRICS countries. More so, the parameters measuring the effect of previous shocks and previous conditional correlations on the current conditional correlations of REITs prices were significant at 5% level for the Chinese and South African data. This implies that, the current returns of REITs prices explained the immediate past returns of REITs prices in both countries. In the case of stock price, the effects of previous shocks and conditional correlations on current conditional correlations of stock prices were observed for Russia, China and the South Africa. Thus, the current returns of stock price also explain the immediate past returns of stock price in these countries.The residuals returns from mean equations for REITs price was significance for Russia, implying that the current returns in Russian REITs prices can be determined by looking at the immediate past history of the returns. Alternatively, that of stock price was significant for both China and South Africa. This also implies that the current returns in stock prices for both countries can be determined by looking at the immediate past history of their stock returns. Management of REITs and stock assets risk is carried out by portfolio design and hedging strategies. As proposed in Kroner and Ng [21] and further applied in Arouri et al. [22], we used these strategies to investigate the potential gains from asset diversification between REITs and stock markets. In essence, we analyzed a hedge portfolio of REITs and stocks assets of BRICS countries for the sample period. That is, we are interested in minimizing the risk of stock–REITs portfolio in BRICS economies without reducing the expected returns. These estimates are needful in building an optimal portfolio allocation for risk management decisions and portfolio allocation as decision tools for policy makers, portfolio investors and risk managers in these economies. Table 9 below captures the estimates of optimal portfolio weights and hedge ratios computed from the conditional variances and covariances of the selected multivariate GARCH models for the five countries. Table 9. Estimates of Optimal Portfolio Weights and Hedge Ratio
 |
| |
|
The results show that the average highest portfolio weight of stock for the stock-REITs portfolio is 1.0 for Russia. Next to this are South Africa, India, Brazil and China with 0.877, 0.849, 0.682 and 0.576, respectively. These indicate that, for a portfolio of $1, about 100 cents, 87.7 cents, 84.9 cents, 68.2 cents and 57.6 cents should be invested in stock markets by the Russian, South African, Indian, Brazilian and Chinese decision makers or portfolio managers, while, correspondingly, 0.0 cents, 12.3 cents, 15.1 cents, 31.8 cents and 42.4 cents should be invested in REITs markets in the five BRICS economies. In general, we observed that more investments are expected for stock asset allocation in stock–REITs portfolio for the BRICS countries. To minimize the risk incurred in $1 long of the first asset, the investor is expected to short $β of the second asset. The results obtained are generally low, suggesting the effectiveness of herding strategy. Specifically, it was found that negative values of about 1.26cents and 0.16cents of REITs were needed on the average to shorten one US dollar long in stock price for the Brazilian and Indian data respectively. The negatives values observed for these two countries also indicate an inverse relationship between stock and REITs returns in Brazil and India. Furthermore, we found that, about 79.8cents, 38.4cents and 15.2cents of REITs were needed to shorten one US dollar long in stock market for the Russian, China and South African data respectively. Thus, highest hedge ratio is found in Russia stock-REITs portfolio while lowest hedge ratio is found for Brazil stock-REITs portfolio. The result obtained here is not surprising since the volatility experienced by Russia financial market is the least when compared to the other BRICS countries. 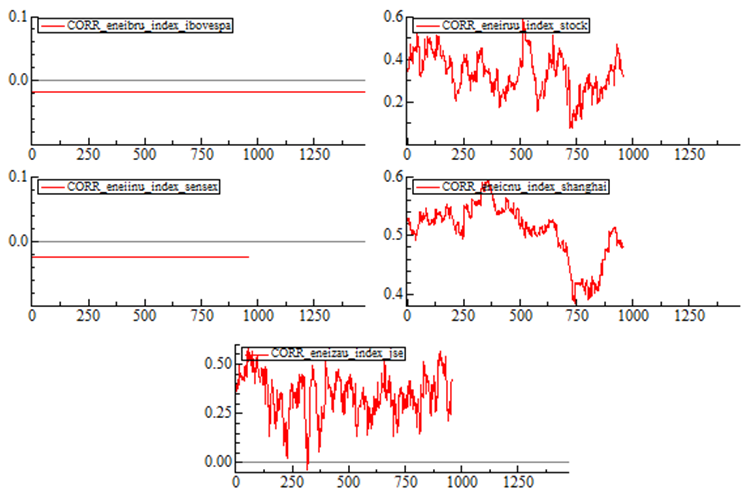 | Figure 1. Plot of Conditional Correlations |
5. Conclusions and Policy Implications
We have considered the CCC-MGARCH and DCC-MGARCH models with the conditional volatility between stocks and REITs in BRICS countries which led to setting up the appropriate hedging strategy between the two market players. This was accomplished using data sample from 19 March 2012 to 08 November 2017 covering a total of 1473 data points from the BRICS countries. During the period, there exists highest positive return in China REITs while the remaining four countries have negative REITs returns. Which indicate that, only the China REITs experienced a general increase in REITs among the BRICS countries considered in this study while on the other hand highest positive return was observed in South Africa followed by China and then Russia when considering stock prices, implying that, these countries experienced a general increase in stocks prices for the period considered. In all, Brazil experienced the smallest average returns for both REITs and stocks prices meaning that it experience the smallest volatility persistence during the period considered when compared to the other BRICS economies. This result fairly support Nawal and Raman [19], where it was observed that BRICS stock markets except, Brazil and Chinese stock markets have been significantly affected by the news in US stock market. More so, we observed both positive and negative skewness values for the REITs and stocks series. With the exception of China, we can conclude that, there is a higher probability for investors to experience daily negative returns in REITs and stocks trading in BRICS countries. Bivariate volatility modelling via the CCC model variants showed significance in all the BRICS countries, with the exception of India. Previous shocks and conditional correlations on the current correlations were significant for the Chinese and South African REITs prices and also found significant for the Russian, Chinese and South African stocks prices. More so, the residual mean returns for REITs were found significant for Russia, while that of stocks prices was found was significant for China and South Africa. These results imply that, returns spillovers actually existed between stocks and REITs markets in the BRICS economies. In managing investments in REITs and stocks prices in the presence of stock portfolio’s risk, the stock-REITs portfolio estimates for all the countries revealed that more investments are expected for stock asset allocation in stock-REITs portfolio in the BRICS economies since the optimal weight of stock for the selected models in the BRICS countries is higher compare to the optimal weight of REITS as shown in Table 9. In addition, the highest and lowest hedge-ratio was found to be Russia stock-REITs portfolio and Brazil stock-REITs portfolio respectively. Analyzing the volatility persistence, returns and volatility spillovers between REITs and stocks portfolios can provide useful information for portfolio managers, investors and government agencies, who are concerned with movements in the two market players. The results obtained in this paper can be used to build an optimal portfolio and forecast future REITs/stocks return volatility. That is, REITs market should be used as a hedge against stocks prices, and the volatility at the stock market can be used to determine the behavior of the REITs market.
ACKNOWLEDGEMENTS
We would like to thank OlaOluwa Simon Yaya for rending useful suggestions during the preliminary stage of the paper. The anonymous reviewers are appreciated for their valuable comments and suggestions.
Note
1. The univariate version of this model is proposed in Bollerslev [12].
References
| [1] | Yaya, O.S., Tumala, M.M. and Udomboso, C.G. (2016). Volatility Persistence and Returns Spillovers Between Oil and Gold Prices: Analysis Before and After the Global Financial Crisis. Resources Policy, 49: 273-281. |
| [2] | Li, L. (2012). The Determinants of REIT Volatility. |
| [3] | Bollerslev, T. 1990. Modelling the coherence in short-run nominal exchange rates: a multivariate generalized ARCH approach. Rev. Econ. Stat. 72, 498–505. |
| [4] | Engle, R.F. (2002). Dynamic conditional correlation: a simple class of multivariate generalized autoregressive conditional heteroskedasticity models. Journal of Business and Economic Statistics, 20, 339–350. |
| [5] | Baba, Y. Engle, R.F. Kraft, D. and Kroner, K.F. (1989). Multivariate Simultaneous Generalized ARCH. University of California, San Diego. |
| [6] | Black, F. (1976). Studies of stock market volatility changes. Proceedings of the American Statistical Association, Business and Economic Statistics Section, 177–181. |
| [7] | Hoti, S. Chan, F. and McAleer, M. (2002). Structure and Asymptotic Theory for Multivariate Asymmetric Volatility: Empirical Evidence for Country Risk Ratings. Paper Presented to the Australasian Meeting of the Econometric Society, Brisbane, Australia. |
| [8] | Cappiello, L. Engle, R.F. and Sheppard, K. (2006). Asymmetric Dynamics in the Correlations of Global Equity and Bond Returns," Journal of Financial Econometrics, 4(4), 537-572. |
| [9] | Chandrashekaran, V. (1999). Time Series Properties and Diversification Benefits of REITs Returns. Journal of Real Estate Society, American Real Estate Society, 17(1), 91–112. |
| [10] | He, L.T., Webb, J.R. and Myer, F.C. (2003). Interest Rate Sensitivities of REITs Returns. International Real Estate Review, 6, 1-21. |
| [11] | Clayton, J. and Mackinnon (2001). The Time-Varying Nature of the Link Between REIT, Real Estate and Financial Asset Returns. Journal of Real Estate Portfolio Management, 7, 43–54. |
| [12] | Bollerslev, T. (1986). Generalized autoregressive conditional heteroscedasticity. Journal of Econometrics 31, 307–327. |
| [13] | Tobia, B., Meik, F. and Eduardo, V.B (2009). REITs and the Financial Crisis: Evidence from the U.S. International Journal of Business and Management. |
| [14] | Busaranon, T. and Chintrakarn, P. (2012). The Relationship Between Real Estate Investments Trusts Property Types and Stock Exchange of Thailand Index. Research of Journal of Business Management. |
| [15] | Lee, C. (2010). An Examination of Volatility Dynamics in Australian REIT Futures. The 16th Pacific Rim Real Estate Society Conference. |
| [16] | Lin, H. and Lee, W. (2015). Threshold Effects in the Relationships of REITS and Other Financial Securities in Developed Countries. Asian Economic and Financial Review, 5(3) 426-438. |
| [17] | Ling, D.C. Joseph, T.L. and Ruoran, X.U. (2016). Asset Growth and Stock Performance: Evidence from REITs. Real Estate Research Institute Conference. |
| [18] | Adams, Z. Fuss, R. and Schindler, F. (2013). The Source of Risk Spillovers among U.S REITs: Financial Characteristics and Regional Proximity. Working Papers in Finance, Swiss Institute of Banking and Finance, No. 173. |
| [19] | Nawal, K. and Raman, P.S. (2014). Stock Return Volatility Effect: Study of BRICS. Transnational Corporations Review, 6(4). |
| [20] | Tse, Y. (2000). A Test for Constant Correlations in Multivariate GARCH model. Journal of Econometrics, 98, 107-127. |
| [21] | Kroner, K.F. and Ng, V.K. (1998). Modelling asymmetric movements of asset prices. Review of Financial Studies, 11, 844–871. |
| [22] | Arouri, M. Jouini, J. and Nguyen, D. (2011). Volatility spillovers between oil prices and stock sector returns: implications for portfolio management. Journal of International Money and Finance 30, 1387–1405. |
| [23] | Kroner, K.F. and Sultan, J. (1993). Time-varying distributions and dynamic hedging with foreign currency futures. J. Financial and Quantitative Analysis, 28, 535–551. |

 Abstract
 Reference
 Full-Text PDF
 Full-text HTML