-
Paper Information
- Next Paper
- Previous Paper
- Paper Submission
-
Journal Information
- About This Journal
- Editorial Board
- Current Issue
- Archive
- Author Guidelines
- Contact Us
American Journal of Mathematics and Statistics
p-ISSN: 2162-948X e-ISSN: 2162-8475
2018; 8(6): 184-189
doi:10.5923/j.ajms.20180806.04

Reprospective Analysis of Some Factors Responsible for Infant Mortality in Nigeria: Evidence from Nigeria Demographic and Health Survy (NDHS)
 Abstract
 Reference
 Full-Text PDF
 Full-text HTML
Babalola M. Afeez1, Obubu Maxwell2, George Amaeze Osuji2, Ikediuwa U. Chinedu2
1Department of Statistics, University of Ilorin, Ilorin, Nigeria
2Department of Statistics, Nnamdi Azikiwe University, Awka, Nigeria
Correspondence to: Babalola M. Afeez, Department of Statistics, University of Ilorin, Ilorin, Nigeria.
| Email: |  |
Copyright © 2018 The Author(s). Published by Scientific & Academic Publishing.
This work is licensed under the Creative Commons Attribution International License (CC BY).
http://creativecommons.org/licenses/by/4.0/

This study is a retrospective analysis of the reproductive history data collected from the Nigeria Demographic and Health Surveys (NDHS) for 2013 to study some factors that are likely to be responsible for infant mortality. The essential aim of this study is to estimate the survival rates of infant’s mortality in Nigeria with the objectives of estimating and interpreting survivor/hazard function from survival data, describing and estimating the survival experience of different groups, selecting the best hazard model from the data. The Kaplan- Meier curve was plotted to describe the rate of survival of some of the factors responsible for infant mortality. The log- rank test which is a non-parametric test was used to test the hypothesis to compare the survival distributions of the samples. The log rank test was obtained for the region, type of resident, sex of the child, religion, gender, highest educational level of mother, wealth index, Age at death, age at birth. The Cox-Proportional Hazard Model was fitted to assess the importance of various covariates in the survival times of infant through the hazard ratio. The hazard ratio which was used to interpret the cox proportional model is compare on its closeness to 1. Also testing the significant of the covariate to the model using the p-value if less than 0.05 level of significant.
Keywords: Infant Mortality, Hazard, Survival Analysis, Survival curve, Kaplan-meier estimate, Log Rank, Cox Regression Proportional model
Cite this paper: Babalola M. Afeez, Obubu Maxwell, George Amaeze Osuji, Ikediuwa U. Chinedu, Reprospective Analysis of Some Factors Responsible for Infant Mortality in Nigeria: Evidence from Nigeria Demographic and Health Survy (NDHS), American Journal of Mathematics and Statistics, Vol. 8 No. 6, 2018, pp. 184-189. doi: 10.5923/j.ajms.20180806.04.
Article Outline
1. Introduction
- Infant mortality is seen as a reasonable approximation to assume that the lower it is the wealthier a country is. Infant mortality takes away the society potential and physical, social and human capital. The infant mortality rate has been criticized as a measure of population health because it is narrowly based and likely to focus the attention of the rest [5, 6].Infant mortality is the death of a child less than one year of age it is measure as infant mortality rate (IMR) which is the number of death of children under one year of age per 100 live births in the same year. Infant mortality includes prenatal mortality (death that occur in the first week after birth), Neo-Natal mortality (death that occur after 28 days of birth) and post-natal mortality (death that occur after 28 days of birth) [1, 3]. Globally, ten million infant and children die each year before their fifth birthday. 99% of these deaths occur in developing nations. Infant mortality rate is one of three indicator use to monitor achievements toward the fourth goal of the Eight Millennium Development Goal (MGD), goal target is to “Reduce by two-thirds between 1990 and 2015 the under-five mortality rate”. Progress has be made toward achieving Millennium Development Goal (MGD) since 1990 the global under-5-mortality was insufficient to reach the MGD target of the two-thirds reduction in 1990 mortality levels by the year 2015 [5, 18].The child risk of dying is highest in the neonatal period, safe child birth and efficient neonatal cares are essential to prevent these deaths. 45% of child death under the age of 5 takes place during neonatal period. 2.7 million Babies die every year in their firth month of life and similar numbers are still born, within the first 24 hours of life and 75% occur in the first week. The 48 hours immediately following the birth is the most crucial period for new born survival. This is where the mother and child receive follow up care to prevent and treat illness [12].According to World Bank infant mortality rate was last measured at 71.50 in 2014 of new born babies in Nigeria represent a quarter of the total number of death of children under-5. Similarly a woman chance of dying from pregnancy and child birth in Nigeria is 1 in 13. Although many of these deaths are preventable, the coverage and quality of health care services in Nigeria continue to fail women and children, presently less than 20% of health facilities offer emergency obstetric care and only 35 percent of deliveries are attended to by skilled birth attendants [3, 5, 6, 16].
1.1. Causes of Mortality
- The Major causes of infant mortality may include:I. Complication during pregnancy, sudden infant death syndrome, maternal.II. MalformationIII. Accident and unintentional injuries.Social boundaries and natural avert access to essential restorative assets and in this way add to an expanding infant death rate; 99 percent of infant death occurs in developing countries and 86 percent of the deaths are due to infections, premature death, and complication during delivery, and prenatal asphyxia and birth injuries.However, the causes of infant mortality may include: sudden infant death, syndrome low birth weight, infection disease and malnutrition, including neglected tropical diseases.
1.2. Key Facts
- I. 5.9 million youngsters younger than 5 passed on in 2015.II. More than half of these early child death are because of conditions that could be counteracted or treated with access to simple, reasonable meditations. III. Leading reasons for death of under-5-kids are parental birth asphyxia, birth complication, diarrhea and malaria, and malnutrition.IV. Children in sub-Saharan Africa are in excess of multiple times more prone to death before their fifth birthday than children in the developed region.
1.3. Aim and Objectives
- The essential aim of this study is to estimate the survival rates of infant’s mortality in Nigeria and the specific objectives are to:1. estimate and interpret survivor/hazard function from survival data2. Estimate and describe and the survival experience of different groups3. select the best hazard model from the data
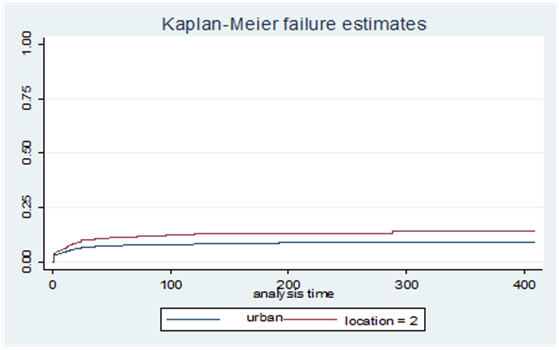
1.4. Source of Data Collection
- The data collected for this project is a secondary data, extracted from the quarterly data of the Nigeria Demographic Health Survey (NDHS) 2013. The data extracted are based on region, type of resident, sex, religion, gender, educational level of mother, wealth index, Age at death, age at birth the data are re-categorized for simplicity of the study.
2. Materials and Method
2.1. Non-parametric Methods
- In survival analysis, Non-parametric methods of estimating survival functions are applied when survival times do not follow any theoretical distribution such that no assumptions are made about the distribution on the survival times. They are also known as Distribution Free methods, which are quite easy to understand and apply. Although they are less efficient than parametric methods, they are suggested to analyze survival data before attempting to fit a theoretical distribution and if the main objective is to find a model for the data, estimates obtained by non-parametric methods and graphs can be helpful in choosing a distribution. In epidemiology, non-parametric (or semi-parametric) methods are used more frequently than parametric methods. There are many non-parametric methods for describing time to event data, some of the widely used ones are:I. Kaplan Meier Method; also known as Product Limit Estimate.II. Log Rank Test Statistic
2.1.1. Kaplan-Meier Method
- The Kaplan Meier method provides very useful estimates of survival probabilities and graphical presentation of survival distribution; it is the most widely used method in survival data analysis and also known as Product Limit estimate. Breslow and Crowley (1974) and Meier (1975b) have shown that under certain conditions, the estimate is consistent and asymptomatically normal. This method assumes that the censoring times are independent of the survival times that is, the reason an observation is censored is unrelated to the cause of death. This assumption is true if the patient is still alive at the end of the study period.The Kaplan-Meier estimator of survival at time t is shown in Equation 8. Here tj, j = 1, 2,...,n is the total set of failure times recorded (with t+ the maximum failure time), dj is the number of failures at time tj, and rj is the number of individuals at risk at time tj.
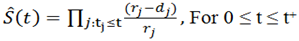 It is simply the empirical probability of surviving past certain times in the sample (taking into account censoring). When there is inappropriate censoring, the Kaplan Meier method is not appropriate. The general formula for a KM survival probability at failure time t(j ) is shown below;
 This formula gives the probability of surviving past the previous failure time t(j−1), multiplied by the conditional probability of surviving past time t( j ), given survival to at least time t( j ). The above KM formula can also be expressed as a product limit if the survival probability Sˆ(t( j−1)) is substituted, the product of all fractions that estimate the conditional probabilities for failure timeless t( j−1) and earlier. This is expressed as;
2.1.2. Log Rank Test
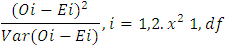
- The Log rank test also known as Mantel- Haenszel test, is a large sample chi-square test that uses as its test criterion a statistic that provides an overall comparism of the KM curves being compared. It is applicable to data where there is progressive censoring and gives equal weight to early and late failures. This statistic, like many other statistics uses the observed and expected cell counts over categories of outcomes where the categories for the log rank statistic are defined by each of the ordered failure times for the entire set of data being analysed. It is also a test used for comparing survival distributions for two or more groups and assumes that hazard functions for the two groups are parallel. When two groups are being compared, a statistic with 1 degree of freedom (known as the Mantel-Haenszel or log-rank test statistic) is formed using the sum of the observed minus expected counts over all failure times for one of the two groups. It can also be computed by dividing the square of the summed observed minus expected score for one of the groups by the variance of the summed observed minus expected score. The test statistic can be expressed as;
 The log rank test which is a family of the non-generalized Wilcoxon test is not very effective when the two distributions differ but their hazard functions or survivorship functions cross, neither of them is powerful to detect any differences and it will be sensible for other tests to be considered. It can also be extended to comparing failure times of two or more survival groups.
2.2. Survival Models
- Survival models are used to quantify the effect of one or more explanatory variables on failure time. They also model the underlying hazard/survival function and assume that the dependent variable (time-to-event) takes on some known distribution, such as Weibull, exponential, or lognormal also, estimates parameters of these distributions (e.g., baseline hazard function). Many of these models such as the Cox proportional hazards model, exponential and weibull regression model, etc. For the purpose of this project research the Cox proportional hazards model is considered.
2.3. Cox-Proportional Hazards Model
- The Cox-proportional hazards model possess the property that different individuals have hazard functions that are proportional i.e. [h(t|x1)/h(t|x2)], the ratio of the hazard functions for two individuals with prognostic factors or covariates
 , and
, and  is a constant (does not vary with time t). This means that the ratio of the risk of dying of two individuals is the same no matter how long they survive. This model also involves specification of a linear-like model for the log hazard. A parametric model based on the exponential distribution may be parameterized as follows:
 Or, equivalently:
 In this case the constant α represent the log- baseline since Log hi(t)= α, when all the x’s are zero. The cox proportional hazards, model is a semi-parametric model where the baseline hazard α(t) is allowed to vary with the time :
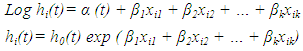 If all of the X's are zero the second part of the above equation equals 1 so hi(t) = h0 (t). For this reason the term h0 (t) is called the baseline hazard function. With the Cox proportional hazards model, the outcome is described in terms of the hazard ratio. We talk about the hazard of the event of interest at one level of an explanatory variable being a number of times more (or less) than the hazard of the specified reference level of the explanatory variable. The ratio of the hazard function for two individuals with different sets of covariates does not depend on time. The model has the following assumptions which are;i. Time is measured on a continuous scale.ii. Censoring occurs randomly.An important property of the Cox model is that the baseline hazard, h0(t), is an unspecified function. It is this property that makes the Cox model a semi parametric model and a popular one. A key reason for the popularity of the Cox model is that, even though the baseline hazard is not specified, reasonably good estimates of regression coefficients, hazard ratios of interest, and adjusted survival curves can be obtained for a wide variety of data situations. Also, the Cox PH model is a “robust “model (i.e., it will closely approximate correct parametric model), so that the results from using the Cox model will closely approximate the results for the correct parametric model. In addition to the general “robustness” of the Cox model, the specific form of the model is attractive for several reasons. As described previously, the specific form of the Cox model gives the hazard function as a product of a baseline hazard involving t and an exponential expression involving the X’s without t. The exponential part of this product is appealing because it ensures that the fitted model will always give estimated hazards that are non-negative.
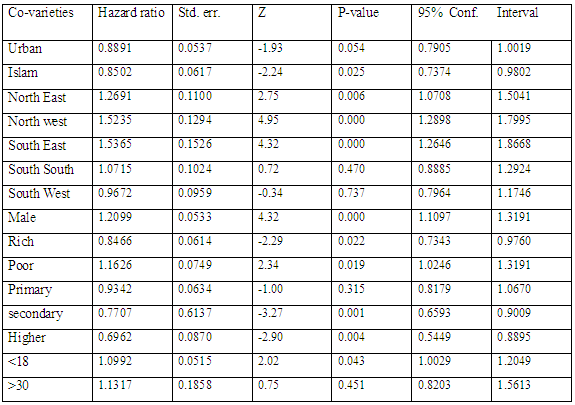
3. Data Presentation
|
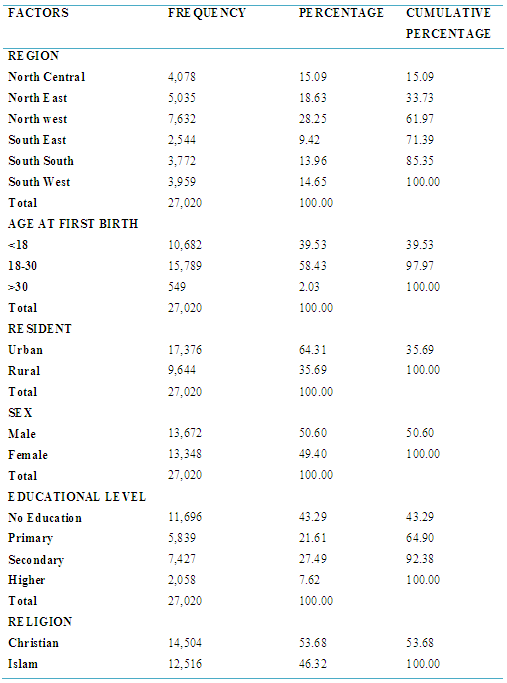
3.1. Kaplan-Meier Estimate and Log Rank Test
 | Figure 1. Survival curve of some factors responsible for infant mortality |
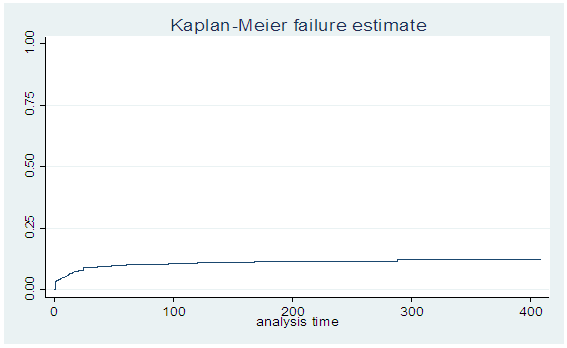
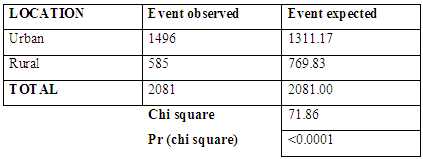
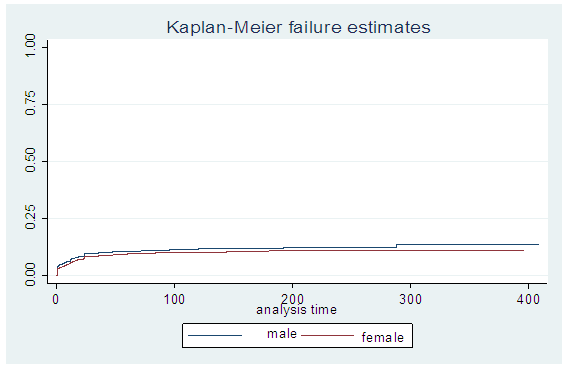
 | Figure 2. Survival curve based on location of mother |
|
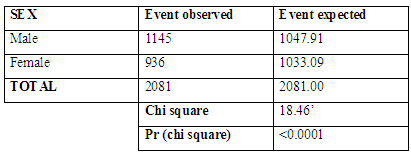
 | Figure 3. Survival curve based on the sex of the child |
|
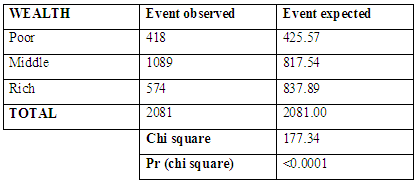
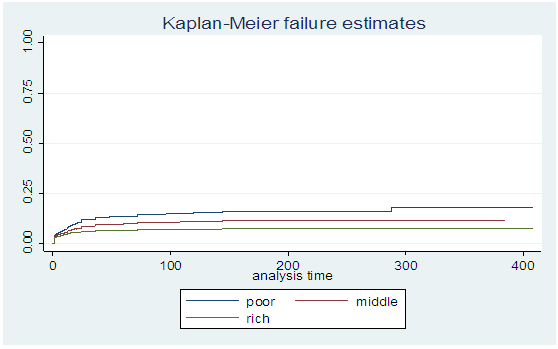 | Figure 4. Survival curve based on financial status of the mother |
|
|
4. Conclusions
- This study shows some factors responsible for infant mortality in Nigeria the factors found associated with infant mortality are similar to those studied for other developing countries. In spite of these known factors, sufficient progress has not been recorded in infant survival in Nigeria, Future studies need to provide insights on why progress in infant survival has been very slow.Research on inventive ways to deal with all inclusive inclusion of infant survival mediation is additionally alluring.