-
Paper Information
- Next Paper
- Paper Submission
-
Journal Information
- About This Journal
- Editorial Board
- Current Issue
- Archive
- Author Guidelines
- Contact Us
American Journal of Mathematics and Statistics
p-ISSN: 2162-948X e-ISSN: 2162-8475
2018; 8(6): 171-178
doi:10.5923/j.ajms.20180806.02

Factors Determining the Power of a Statistical Test for the Difference between Means and Proportions
 Abstract
 Reference
 Full-Text PDF
 Full-text HTML
Habib Ahmed Elsayir
Dept. of Mathematics, Al Qunfudha University College, Umm Al-Qura University, Al-Qunfudha, Saudi Arabia
Correspondence to: Habib Ahmed Elsayir, Dept. of Mathematics, Al Qunfudha University College, Umm Al-Qura University, Al-Qunfudha, Saudi Arabia.
| Email: |  |
Copyright © 2018 The Author(s). Published by Scientific & Academic Publishing.
This work is licensed under the Creative Commons Attribution International License (CC BY).
http://creativecommons.org/licenses/by/4.0/

One of the most essential issues in research problems design is statistical power of a test is. The problem motivating this topic is to identify the factors and relationships among the components of power analysis for a study. In this paper, we presented testing procedures of hypothesis for means and proportions in different sample situations. Hypothesis testing requires several stages, including specifying the null and alternative or research hypothesis, selecting and computing an appropriate test statistic, setting up a decision rule to reach a conclusion. Some related concepts such as sample size and confidence intervals were demonstrated, and illustrations on theoretical data would be carried. Results and conclusions on the basis of the discussions reflected the relationship among power analysis components and factors that influence the statistical power of a test would be shown.
Keywords: Effect size, Power of a test, Sample size, Significance test
Cite this paper: Habib Ahmed Elsayir, Factors Determining the Power of a Statistical Test for the Difference between Means and Proportions, American Journal of Mathematics and Statistics, Vol. 8 No. 6, 2018, pp. 171-178. doi: 10.5923/j.ajms.20180806.02.
Article Outline
1. Introduction
- Power is defined as "the probability that a statistical significance test will reject the null hypothesis for a specified value of an alternative hypothesis" (Robin High, 2000). It is the ability of a test to detect an effect, given that the effect actually exists". Type II error is the compliment of power. Some questions can arise when conducting power analysis, These such as: What is needed to take into account when considering statistical power analysis? How powerful is underlined study test? What sample size needed to carry out the study? When giving the answer to these questions, we must take into account a number of factors, including the study objective, target population size, the risk of selecting a sample, and the tolerance of sampling error. Adequate power can't be achieved to detect the effect you're looking for without a sufficient number. Choosing too many observations, may be using valuable resources inefficiently. A study with too little or too much power does not spend time and resources economically; and may be seen as unfavorable scientific behavior. The power analysis and sample size determination objectives is to provide researcher with the statistical methods to respond to these issues. Depends on statistical inference, the subject of power of a test, has been covered in many statistical studies. Earlier, Alan G. Sawyer (1982) has reviewed the factors that determine statistical power and illustrated how the use of the appropriate statistical test can improve power and even sometimes change the statistical conclusion. Most of studies has covered the issue from different points of view. However most of these studies has focused in sample size which has a relation with effect size, which mostly called "d", (Muller & Lavange, 1992). Power analysis for the behavioral sciences was introduce by Cohen (1988). Zodpey (2004) on an online article has described the common used terms in sample size estimation and power analysis. Models and tests concerning power could be found in Murphy (1998), Rudolf (1998), and Jeeshem and Kucc (2004). Plotting and the shape of the test statistic distributions for sample size and statistical power were demonstrated by Blake (2001). Some calculations of power and sample size for some distributions is partly introduced by Bret Hanlon and Bret Larget (2011). A set of software programs in power analysis were found to enable evaluation of the factors affecting power and sample size(see for instance power analysis, Electronic Text Book, Statsoft, 1984-2003).
2. Components of Statistical Power of a Test
- The components which are to be considered when conducting a statistical power analysis beside the model (the test) include: standardized effect size, Sample size (n) (significance level α) and the Power of the test (1–ß). Let us consider a normal distribution with unknown parameter µ but known variance
 from which is a sample of size n is drawn. The sample size n is given by the formula:
 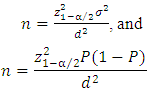 Where:P: is the estimated proportion of the population, d is absolute precision and
  is the desired level of significance.Then we put
  and
and  as below:
 Let
Let  The decision possibilities on the test of hypothesis is as in the following table:
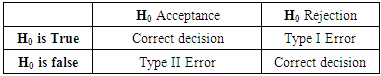 Power= 1-β =P (rejecting
  when the means are equal, that is
  )
)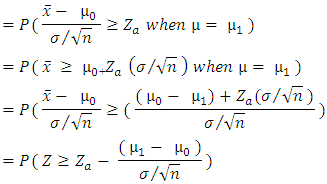 So, the power of a test can be increased by increasing the value of
  , or by increasing the sample size n and it can also be increased by decreasing the
  . The power of a test can also be increased by decreasing
  , that is increasing a.The power explanation has relation with hypothesis testing process. For instance, if a researcher is conducting a testing of hypothesis of significance of a difference of proportions, then the null hypothesis may look as follows:
 However, in the complex sample set-up, we can define the variance of
  as
as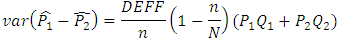 Where DEFF is the design effect that collects the inflation of variance due to complex sampling design. If
  (larger value), then:
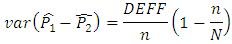 The formula of the effect size is:
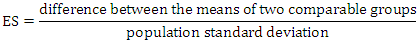 Following Lisa Sullivan (2017), we have:In continuous variable observation, one Sample:
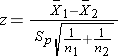
 Ÿ Continuous variable observation, two independent samples:
 and
and  Ÿ Continuous variable observation, two matched samples:
 and
and Ÿ For dichotomous variable, one sample:
 Ÿ For dichotomous variable, two independent samples:
  , RD=0, RR=1, OR=1
  Any research design may consist of certain or specific models (tests) with different forms for computation of test statistics on which their statistical powers are established. Formulas vary according to the type of models (tests) to compute test statistics. For instance, the T-test depends on the T distribution to determine its statistical power, while ANOVA depends on the F distribution. A standardized effect size, a test statistic (e.g., T and F scores) is computed by combining the effect size and variation. An effect size in actual units of the response is the “degree to which the phenomenon exists” (Cohen 1988). Alternatively, an effect size is the deviation of hypothesized value in the alternative hypothesis from the baseline in the null hypothesis. The test size (α), or the significance level is the probability of rejecting the true
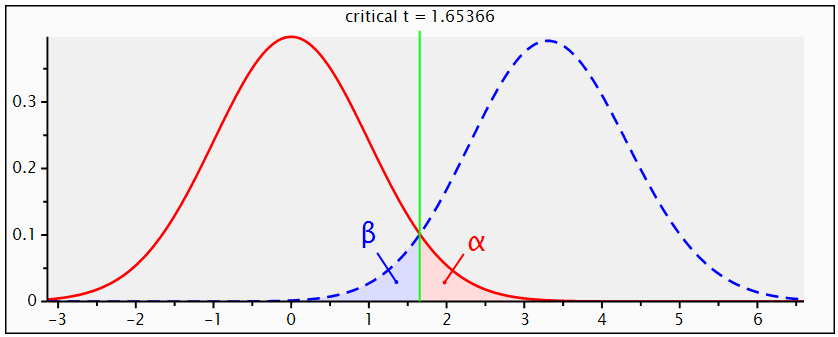
  hypothesis. The power of the test (1–ß) is the probability of correctly rejecting a false null hypothesis, where ß is the type II error. It measures the test's ability to reject the null hypothesis when it is actually false - that is, to make a correct decision. The maximum power a test can have is 1, the minimum is 0. Ideally we want a test to have high power, close to 1 (Valerie & John (1997). The Sample size and variance are the main factors that affect power, since power depends on sample size. Other things being equal, larger sample size yields higher power and power also depends on variance since smaller variance yields higher power.
3. Power and Experimental Design
- Power may sometimes be increased by conducting a different design of experiment that has lower error variance. For example, clustering, stratification approach sampling can usually tends to reduce error variance and hence can increase power level. However, the power computation will depend on the type of the adopted experimental design. For more on designs that may increase power, see: Lipsey, MW (1990). and McClelland, Gary H. (2000).The statistical power of a contemplated research design should be determined before the beginning of data collection. If a design has unacceptably low power to detect the effect of interest, the design ought to be changed to improve the power. If limited resources preclude a satisfactory level of power and if statistical significance at a low Type I error rate is desired, the research is probably not worth the time, cost, and effort and should be abandoned. A researcher who decides to conduct a study with low statistical power should be aware of the result of the rejection of the null hypothesis.Cohen (1988) and his colleagues research studies illustrate how the use of the appropriate statistical test can improve power and sometimes even alter the statistical conclusion.After becoming aware of the magnitude of effect size, (often very low), a researcher can often increase power by "developing insights which lead to research procedures and tools which make effects measurably large enough to be detected by experiments of reasonable size. Stronger and better controlled techniques of explanatory variables also can improve power via increased effect size. Another statistical procedure to increase power is to combine several studies in a type of "meta-analysis", see Elsayir (2015). It could be shown that the analysis of several replications results in a rejection of the null hypothesis when the replications are combined into a replication effects.
4. Statistical Approach
- There are several approaches for performing power analysis which depend primarily on the study design and the main outcome measure of the study (Zodpey, 2004). For example, one can specify the desired width of confidence interval and determine the sample size that achieves that goal, or a Bayesian approach can be used where we optimize some utility function. One of the most popular approaches for studying the power of a test of hypothesis involves specifying (Russel, 2001): 1. A parameter for hypothesis test. 2. Significance level of the test. 3. Effect size that reflects an alternative of scientific interest. 4. The values or estimates of other parameters needed to compute the power function of the test.5. A target value of the power of the test.
5. Performing Power
- It should be said that the power of any statistical test depends mainly on: the actual population mean μ, the sample size n, the significance level (α) and the population variance
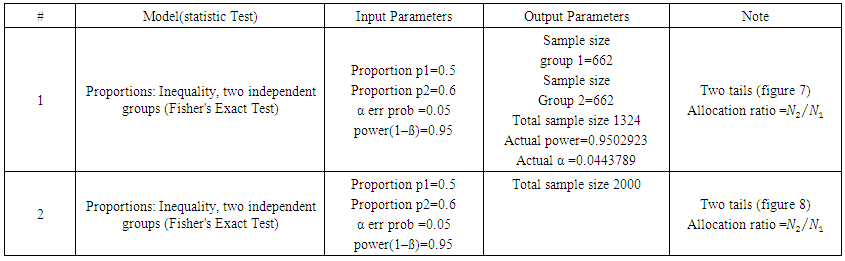
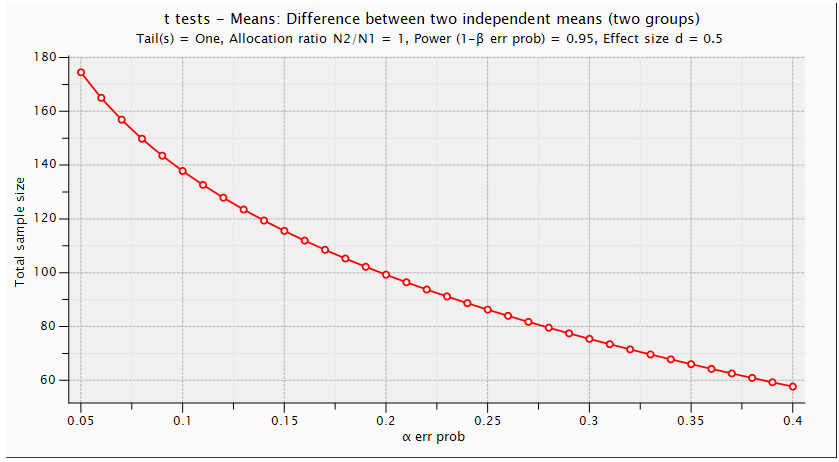
 . Using G. Power software, values are set for the sample size, the population standard deviation and the significance level. when performing a statistical power analysis, the following important components should be considered: Significance level (α) or the probability of a type I error, Power to detect an effect, which is expressed as (1-β), where β is the type II error, and effect size the researcher wants to detect, variation and the sample size. These components of power analysis are not independent. Hence, any four of them automatically determines the fifth one. We used t test for difference between dependent means (matched pairs) to compute required sample size (n=54), given α=0.05, power =0.95, and effect size (ES) =0.05. The input and output parameters are as summarized in table 1 (model 1). The plot of values is in figure (1), while the x-y plot for a range of values is presented in figure (2). The figure demonstrates that a larger sample size yields higher power. Similar input parameters has been made for greater sample size procedure (model 3) in the above mentioned table, but for independent means (two groups). The one tailed t test for independent means (two groups) is presented in figure 4. The same procedure has been conducted as seen in (figure (5)) and figure (6) for two tailed test. In figure (7), power and total sample size has been plotted for unequal proportions (two independent groups using two tailed Fisher's exact test. Figure (8) shows plot (on y axis) α err prob. as a function of power (1–ß err prob.) and total sample size at 2000 and proportional p1 at 0.5. Figure (8) illustrates that a larger (α) level gives higher power.Hence, when the α level, the effect size or the sample size increases, the power level increases. generally, the larger the sample size n, the smaller the sampling error and higher power. If we are to make accurate decision about a parameter, we need to have an n large enough so that error will tend to be" reasonably small ". If n is too small, there is not much point in gathering the data, because the results will tend to be imprecise to be of much use. Once n is large enough to produce a reasonable level of accuracy, making it larger simply wastes time and money.
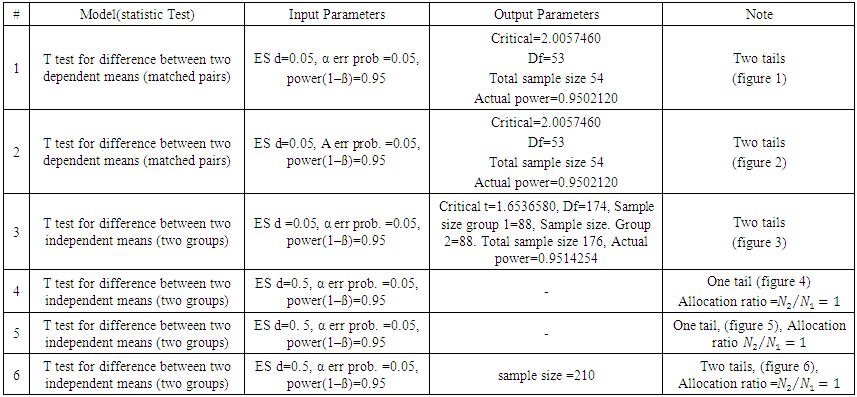 | Table (1). Power Input and Output Parameters Summary for Means |
 | Table (2). Power Input and Output Parameters Summary for proportions |
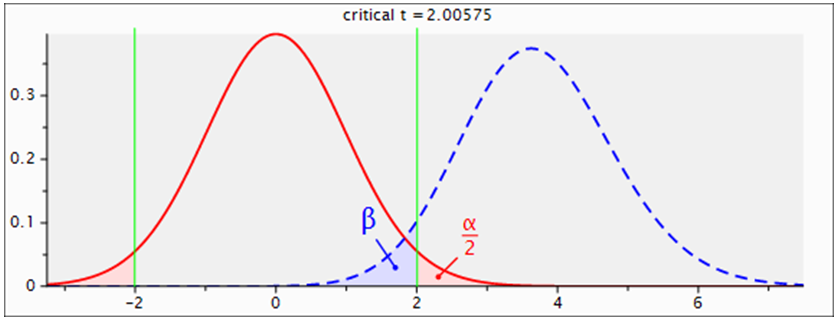 | Figure (1). Power Graph for Test of Difference between means for Matched Pairs (Two Tailed Test) |
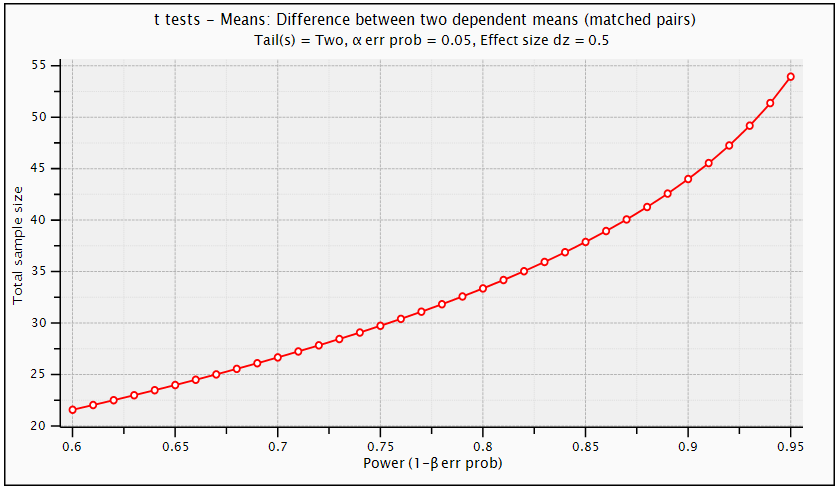 | Figure (2). T tests-Means: Difference between Two Dependent Means (Matched Pairs) (Two Tailed Test) |
 | Figure (3). Power Graph for Test of Difference between means for Matched Pairs (One Tailed Test) |
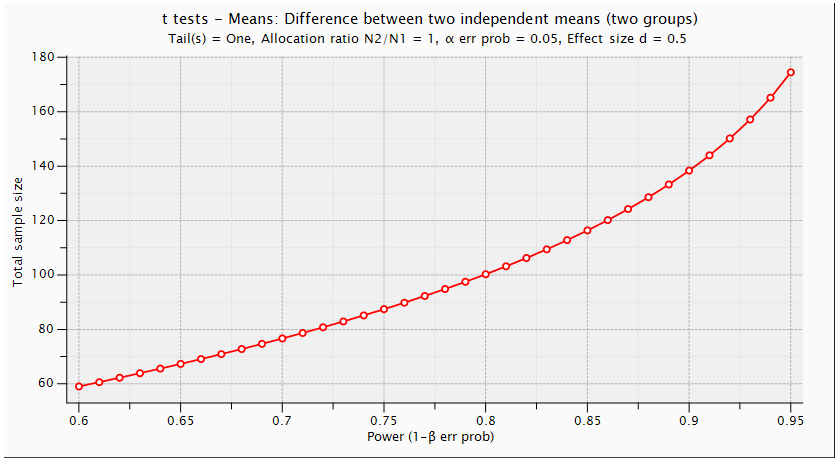 | Figure (4). T tests-Means: Difference between Two Independent Means (Two Groups) (One Tailed Test) |
 | Figure (5). T tests-Means: Difference between Two Independent Means (Two Groups) (One Tailed Test) |
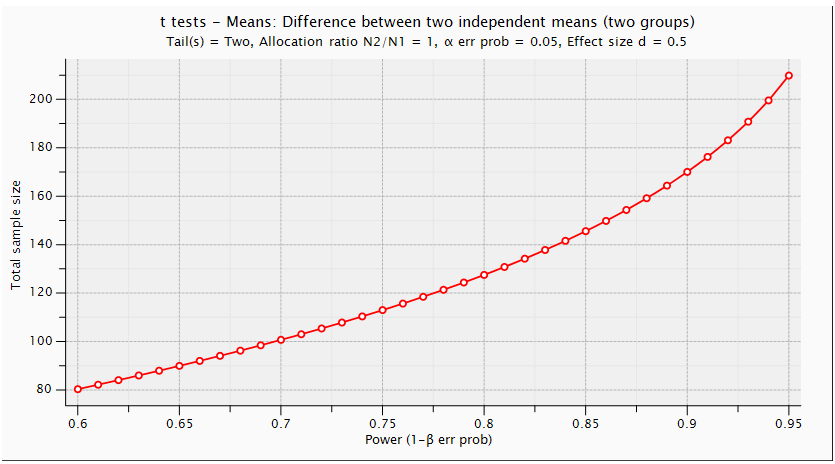 | Figure (6). Power and Total Sample Size: Difference between Two Independent Means (Two Groups) (Two Tailed T Test) |
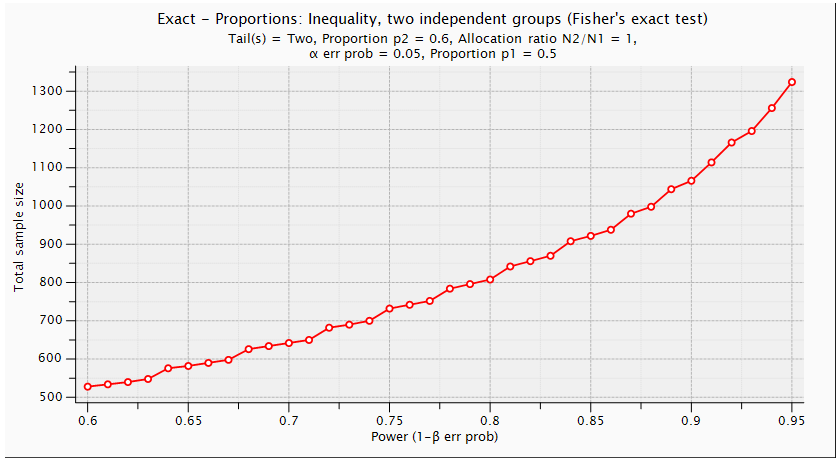 | Figure (7). Power and Total Sample Size: Unequal Proportions, Two Independent Groups (Two Tailed Fisher's Exact Test) |
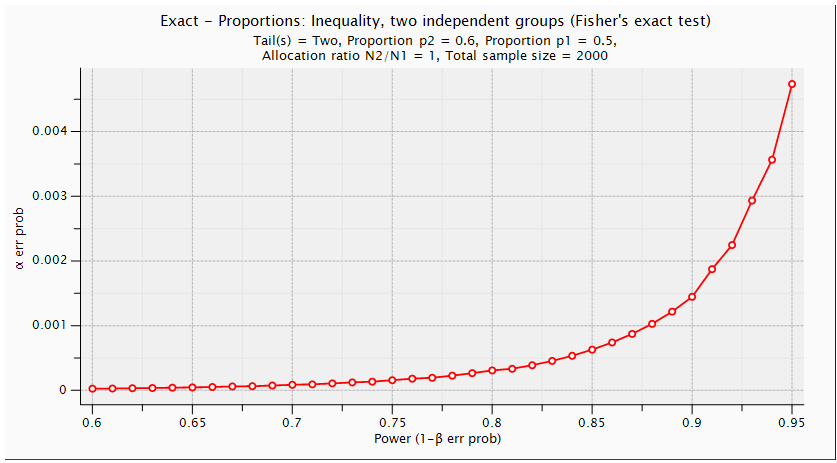 | Figure (8). Power and α Prob: Unequal Two Independent Groups (Two Tailed Fisher's Exact Test) |
6. Discussion
- This article reviews the analyses of factors that affect power and examines the sensitivity of power and sample size to other components, enabling researchers to efficiently use the research resources. Power analysis is a procedure to balance between Type I and Type II error. It is the probability of detecting a true difference. If Without an adequate power, a significant result might not be reached. In addition, if too many observations are used (or if a test is too powerful with a large sample size), even a very small effect will be mistakenly detected as a significant one. However, if too few subjects are used, the hypothesis test will result in low statistical power and, thus there is little chance to detect a significant effect. A study with low power will have inconclusive results, even if the investigated phenomenon is real. Stated differently, the effect may well be there, but without adequate power, you won't find it. It can be stated that the most important component affecting the statistical power is the sample size. In fact, there is a little space to change a test size (significance level). It is also difficult to control effect sizes in many cases. It is costly and time-consuming to get more observations, of course. But the frequently asked question in practice is how many observations need to be collected. It was suggested to follow an informal rule that alpha is set to 0.05 and beta to 0.2. In other words, power is expected to be 0.8. This rule implies that a Type I error is four times as costly as a Type II error. There are challengers to this "0.05 and 0.2 rule." For example, for a simple study a Type I error rate of 0.05 is acceptable. However, pushing alpha to a more conservative level should be considered when many variables are included. One can argue that for a new experiment a 0.05 level of alpha is acceptable. But to replicate a study, the alpha should be as low as 0.01 However, low power does not necessarily make a study a poor one if you found a significant difference. Even if the null is rejected, the power may still be low. But this can be interpreted as a strength rather than as a weakness.
7. Conclusions
- We have presented the definitions of power concept and significance level. We also have explained how to determine sample sizes for desired sizes of parameters for both means and proportions, as well as examining and interpreting the power curve and its changes as n changes. The issue of factors affecting power and the related issues is discussed here. Sample size justification is intimately tied with power analysis. Therefore, to understand sample size justification, understanding of power analysis is needed. These techniques are related to confidence interval estimation which is useful in implementing the above objectives and in evaluating the size of experimental effects in practice. There is some benefits of sample size increase which include a greater likelihood of correctly rejecting a false null hypothesis and more accurate estimation of effect size. Several factors affect the power of a statistical test. Some of the factors are under the control of the experimenter, whereas others are not.