Gulshan Ara Majid, Ahmad Saeed Akhter
College of Statistical and Actuarial Sciences, University of the Punjab, Lahore, Pakistan
Correspondence to: Gulshan Ara Majid, College of Statistical and Actuarial Sciences, University of the Punjab, Lahore, Pakistan.
| Email: |  |
Copyright © 2018 The Author(s). Published by Scientific & Academic Publishing.
This work is licensed under the Creative Commons Attribution International License (CC BY).
http://creativecommons.org/licenses/by/4.0/

Abstract
In this paper, we have introduced generalization of the Stretched Exponential distribution termed as the Transmuted Stretched Exponential distribution. This suggested distribution can model data in form of decreasing and increasing hazard rates. Besides, we have derived some mathematical properties of the distribution covering probability density function, distribution function, survival, failure rate and reversed hazard functions, moments, moment generating function, incomplete moments, cumulant generating function, quantile function, mean deviation and Renyi entropy of introduced distribution. The Maximum Likelihood method has been used for estimation of parameters. We have delivered real data sets to demonstrate the worth and significance of presented distribution. It has been observed that the introduced distribution of three parameters fits better than competitive distributions for data sets.
Keywords:
Transmuted distribution, Stretched Exponential distribution, Generalized, Transformation, Method of Maximum Likelihood Estimation, Goodness of Fit
Cite this paper: Gulshan Ara Majid, Ahmad Saeed Akhter, Transmuted Stretched Exponential Distribution with Applications, American Journal of Mathematics and Statistics, Vol. 8 No. 6, 2018, pp. 161-170. doi: 10.5923/j.ajms.20180806.01.
1. Introduction
The concept of the Transmuted distribution was firstly suggested by Shaw & Buckley [15]. Now Transmuted distributions are generally studied in Statistics, and several researchers have constructed different forms of Transmuted distributions which depend on some well-known distributions.Transmuted distributions can be gained by adding λ, a real number, where  to the cumulative distribution function (cdf), i.e., arbitrary baseline cdf
 | (1) |
is called a transmuted distribution, (See Shaw and Buckley [15]). By differentiating both sides of (1) with respect to  , we obtain Transmuted distribution.
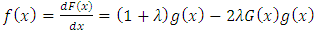 | (2) |
for  here,
here,  is the corresponding pdf to G(x). Hence f(x) is the corresponding pdf to F(x).Many researchers have proposed new forms of Transmuted distribution. For instance, the Transmuted Extreme value distribution with applications by Alkasasbeh & Raqab [2]; the Transmuted Lindley distribution by Merovci [11]; the Transmuted generalized Rayleigh distribution by Merovci [10]; the Transmuted Transmuted Rayleigh distribution by Merovci [12]; the Transmuted Fréchet distribution by Mahmoud & Mandouh [9]; the Transmuted Generalized Inverse Weibull distribution by Merovci, Elbatal & Ahmed [13]; Aryal and Tsokos [3] derived generalization of Weibull distribution entitled as the transmuted Weibull distribution. Khan and King [7] presented the transmuted modified Weibull distribution. Ashour and Eltehiwy [4] introduced Transmuted Lomax distribution. Elbatal et al. [5] suggested transmuted generalized linear exponential distribution. Transmuted Gompertz distribution is offered by Abdul-Moniem and Seham [1], etc.A random variable X is said to be Stretched Exponential distribution (SED) with two parameters
  if the forms of pdf and cdf of SED are given by respectively:
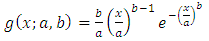 | (3) |
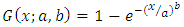 | (4) |
for  the shape parameter b and the scale parameter a.That is cdf of Generalized Stretched Exponential distribution i.e. baseline distribution . For more detail can be found in Laherrere, J. and Sornette, D. [8]. The above forms of (3) and (4) are obtained by transformation technique.The rest of the paper is organized as followed. In Section 2, we introduce Transmuted Generalized Stretched Exponential distribution (TSED) with pdf, cdf, survival and hazard functions. Its special cases also discuss in this section. The properties for TSED are derived in Section 3. In Section 4, we argued the parameters estimators by maximum likelihood method. We use a real data sets to display that the TSED can be a better model than other Transmuted model in Section 5. Conclusion is drawn in Section 6.
2. The TSE Distribution
With help of above cited idea of Transmuted distribution, Stretched Exponential distribution is converted into Transmuted Stretched Exponential (TSE) distribution. The forms of pdf and cdf of TSED are given by respectively: | (5) |
Correspondingly, pdf is obtained by: | (6) |
for  .The above forms of cdf (5) and pdf (6) of TSED are obtained by substituting
  and
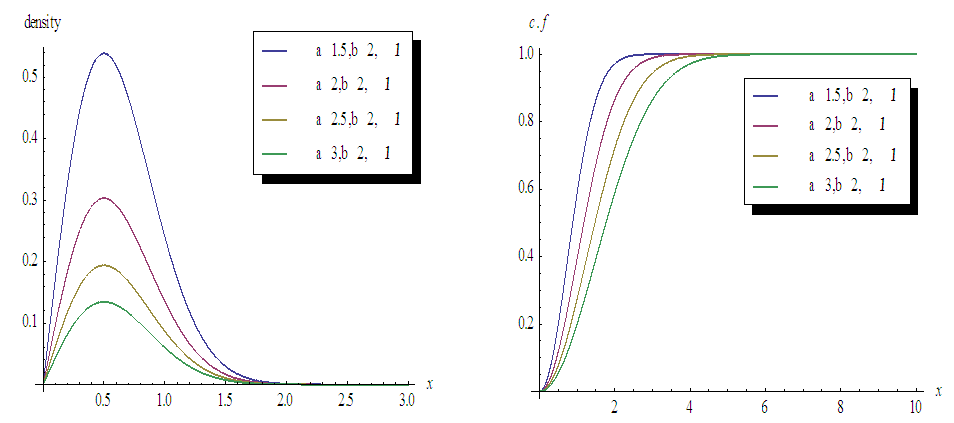
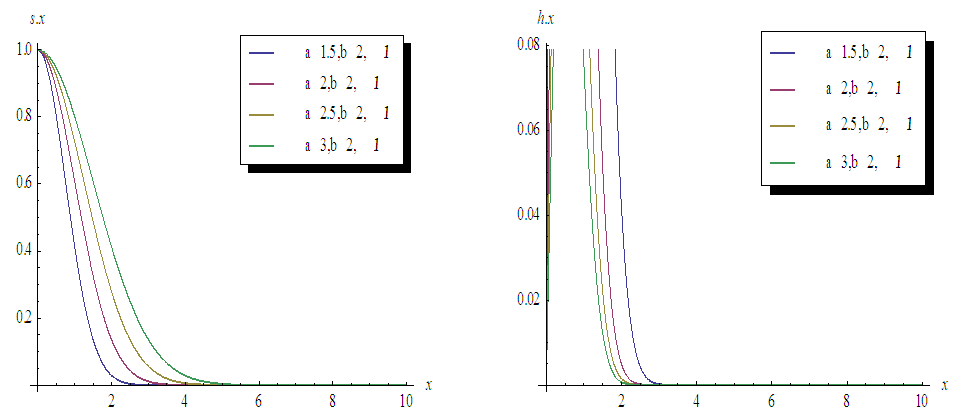
and  from (3) and (4) in (1) and (2).Figures 1, 2, 3 and 4 illustrate the behaviour of pdf and cdf for different values of parameters.The survival function
  , the hazard rate function (HRF)
  and reverse hazard rate function, (RHRF)
  for TSED are representing in the following forms:
 | (7) |
By substituting the expression of  in equation (7), we obtain survival function is of the form
 | (8) |
 .Similarly hazard function is obtained substituting expressions of pdf and survival function in the following equation
 or
or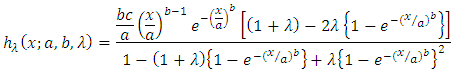 | (9) |
 .Also reverse hazard function of Transmuted Stretched Exponential distribution is attained by substituting expressions of cdf and pdf from (5) and (6) in the following equation
 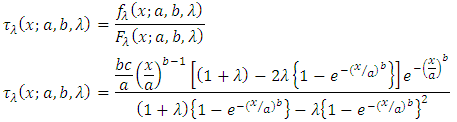 | (10) |
 .Here baseline distribution is Generalized Stretched Exponential distribution,
  and
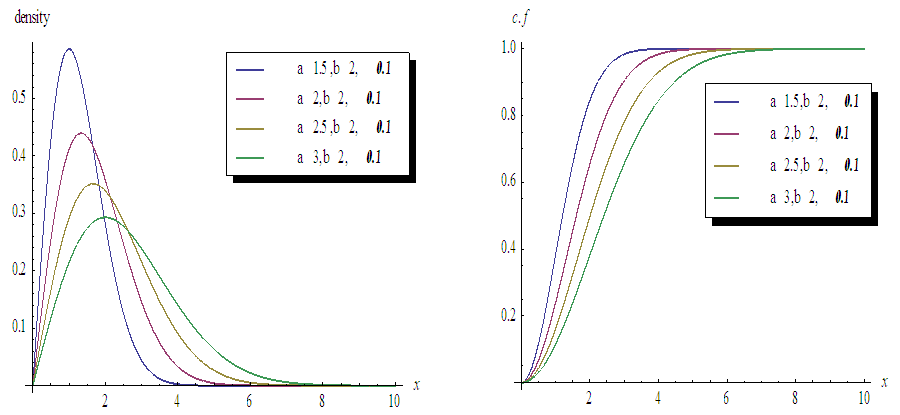
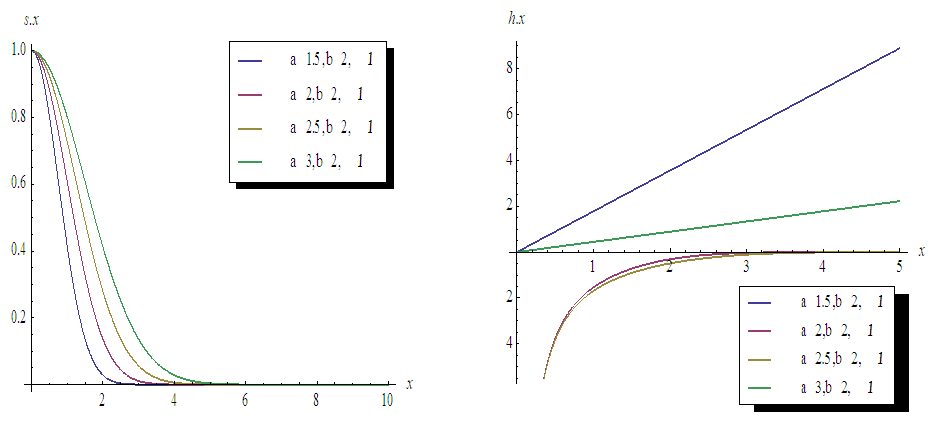
and  are cdf and pdf of new created Transmuted Stretched Exponential (TSE) distribution. Figures 5, 6, 7 and 8 demonstrate the constant, decreasing and increasing behaviour of hazard function for different values of parameters.
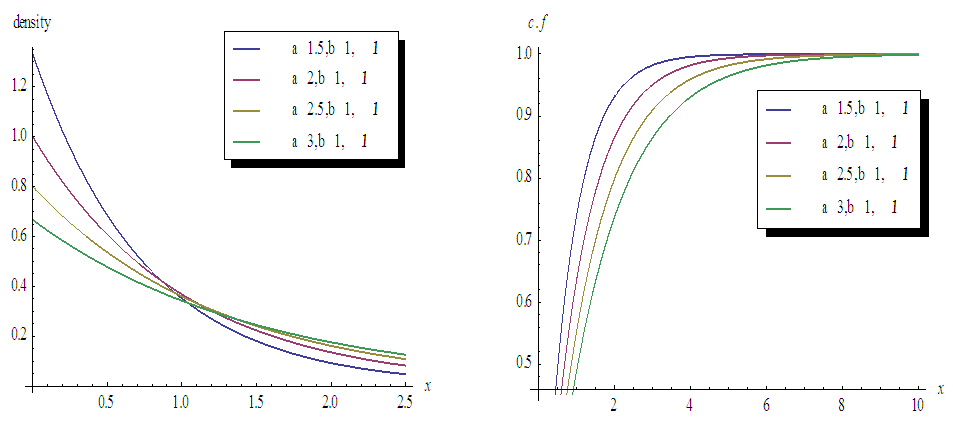 | Figure 1. Plots of TSE density function and distribution function for fixed values of  with a = different values such as with a = different values such as  |
 | Figure 2. Plots of TSE density function and distribution function for fixed values of 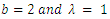 with a = different values such as with a = different values such as  |
 | Figure 3. Plots of TSE density function and distribution function for fixed values of 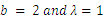 with a = different values such as with a = different values such as  |
 | Figure 4. Plots of TSE density function and distribution function for fixed values of  with a = different values such as with a = different values such as  |
 | Figure 5. Plots of Survival and Hazard functions for fixed values of  with a = different values such as with a = different values such as  |
 | Figure 6. Plots of Survival and Hazard functions for fixed values of  with a = different values such as with a = different values such as  |
 | Figure 7. Plots of Survival and Hazard functions for fixed values of 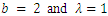 with a = different values such as with a = different values such as  |
 | Figure 8. Plots of Survival and Hazard functions for fixed values of  with a = different values such as with a = different values such as  |
2.1. Special Cases
We can find some existing models through appropriate range of parameters. This particular choice of parameters can fit the observed data too. Consequently, certain Specific cases of TSE distribution are discussed below by replacing different values of  By replacing
  in Equation (6), we get two parameter Transmuted Stretched Exponential distribution (TSED).
 | (11) |
for  .By replacing
  in Equation (6), we get two parameter Transmuted Exponential distribution (TED).
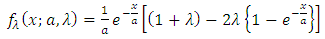 | (12) |
for  .By replacing
  in Equation (6), we get one parameter Transmuted Standard Exponential distribution (TED).
 | (13) |
for 
3. Properties
In this section, some Mathematical properties of the TSE distribution containing moments, moment generating function, cumulant generating function and information entropy.
3.1. Moments, Moment Generating Function
For the moments of the TSE distribution, the rth non-central moment of Transmuted Stretched Exponential variable X with pdf (6) is obtained as:By definition,  By substituting right hand side expression of
  in above expression, we obtain
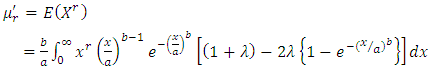 | (14) |
Now suppose that | (15) |
This implies 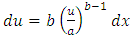 | (16) |
Limits remain same, i.e. for  .Equation (14) can be written as:
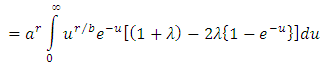 Above expression on right hand side can be written in simple form as:
 After simplification and using Gamma function,
 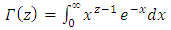 , we obtain rth moment of TSE distribution.
 | (17) |
For Mean and Variance of X, by putting  in Equation (17), the expressions of
  and
and  are given by
 | (18) |
 | (19) |
Now Variance of X is obtained by | (20) |
By putting expressions of  and
and  in (20), we obtain
 or
or | (21) |
The moment generating function (m.g.f) and cumulant generating function (c.g.f) are expressed in the form | (22) |
and 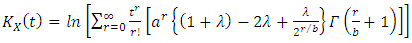 | (23) |
3.2. Incomplete Moments
By definition, Incomplete moments are: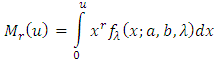 From equation (6), by substituting
  in above expression, we get
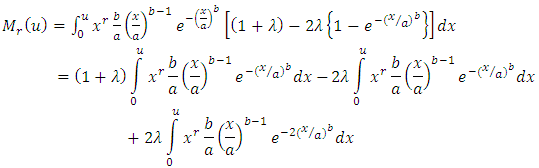 By using substitution method for the limits,
  we obtain
 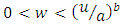 . Also by using incomplete gamma function,
  in all three expressions of right hand side of above equation, we get Incomplete moments of TSE distribution in the form of:
 or
or | (24) |
3.3. Quantile function
By definition, the 100th quantile is given by: This implies that
  By supposing,
 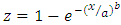 , after substituting this supposition in above equation, we get
  By substituting value of
  in above equation and after simplification, we get
 | (25) |
By substituting  we will get 2nd Quartiles of TSED as:
 | (26) |
3.4. Mean Deviation
By definition, we know that Mean deviation about mean and median are given by: and
and  , these expressions of measures can also be expressed as:
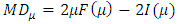 | (27) |
 | (28) |
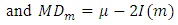
here From equation (27) and (28),
  and
and  can be written in the form of:
 after solving the above equation, expression will be obtained in the form of:
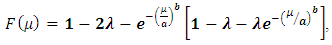 Similarly,
 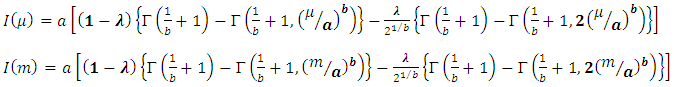 Where
Where  are gamma and incomplete gamma functions. Now substituting expressions of
  we get two results of
  as:
as: 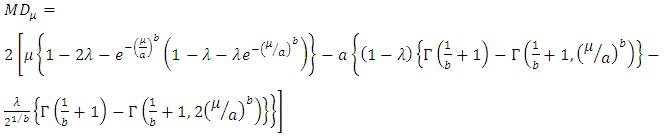 | (29) |
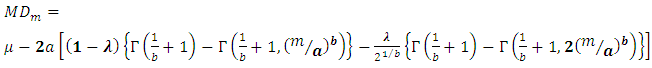 | (30) |
3.5. Information Entropy
The concept of entropy is significant in various fields of Science, specifically Physics, Theory of communication and Probability.
3.5.1. Renyi’ Entropy
The Renyi entropy for the Transmuted Stretched Exponential distribution has been obtained as:Let X be the TSE r.v, then the Renyi’ entropy can be obtained by using the following relation. 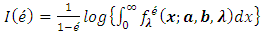 | (31) |
Here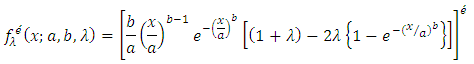 by substituting the value of
  in equation (31), In process of integration of
  we adopt substitution method from Equations (15) and (16), then after simplification and using Gamma function,
 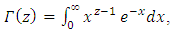 we obtain required Renyi’ entropy as given below:
 | (32) |
Note: Another type of entropy i.e. Shannon entropy for TSE distribution can be obtained by using:  | (33) |
4. Maximum Likelihood Estimation
Now method of maximum likelihood estimation has been discussed for the purpose of parameters’ estimation of TSE distribution.Let  be a random sample of size n from the TSE distribution given by equation (3). Then
  | (34) |
Here,  .By substituting right hand expression of
  in (34), applying
  on both sides, then we obtain the following result
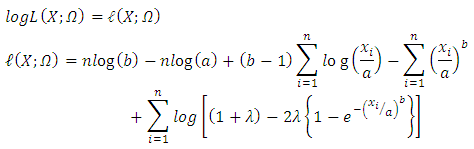 | (35) |
By partially differentiation to equation (35) with respect to  , we obtain the following equations in the form of:
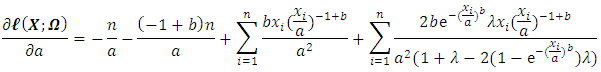 | (36) |
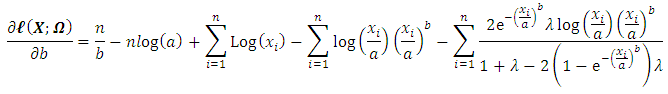 | (37) |
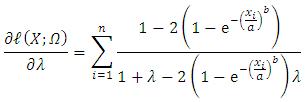 | (38) |
The MLEs of  can be obtain by solving the Equations (36), (37), and (38) using
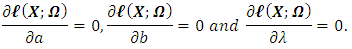 Moreover for solution of the above nonlinear equations to obtain MLEs of
  by R-package named “AdequacyModel”. The advantage of this package is that we can also obtain measures of goodness of fit as well. The measures of goodness of fit include:
 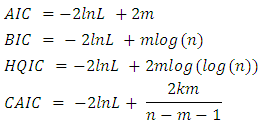 Where AIC (Akaike Information Criterion), BIC (Bayesian Information Criterion), HQIC (Hannan Quinn Information Criteria), CAIC (Consistent Akaike Information Criterion), K-S Statistics (Kolmogorov-Smirnov Statistics),
  denotes the log-likelihood function estimated at the maximum likelihood estimates, m is the number of parameters, and n is the sample size.
5. Applications
The data have been obtained from Nicholas and Padgett (2006); [14]. The data represent tensile strength of 100 observations of carbon fibers and they are: 3.7, 3.11, 4.42, 3.28, 3.75, 2.96, 3.39, 3.31, 3.15, 2.81, 1.41, 2.76, 3.19, 1.59, 2.17, 3.51, 1.84, 1.61, 5.56, 1.12, 2.48, 1.25, 2.48, 2.03, 1.61, 2.05, 3.60, 3.31, 2.35, 2.77, 2.68, 4.91, 1.57, 2.00, 1.17, 2.17, 0.39, 2.79, 1.08, 2.88, 2.73, 2.87, 3.19, 1.87, 2.95, 2.67, 4.20, 2.85, 2.55, 2.17, 2.97, 3.68, 0.81, 1.22, 5.08, 1.69, 3.68, 4.70, 2.03, 2.82, 2.50, 1.47, 3.22, 3.15, 2.97, 2.93, 3.33, 2.56, 2.59, 2.83, 1.36, 1.84, 1.57, 1.89, 2.74, 3.27, 2.41, 3.09, 2.43, 2.53, 2.81, 3.11, 1.69, 4.90, 3.39, 3.22, 2.55, 3.56, 2.38, 1.92, 0.98, 1.59, 1.73, 1.71, 1.18, 4.38, 0.85, 1.80, 2.12, 3.65. Table 1. MLE Estimates of TGSED and TEP-ID
 |
| |
|
Table 1 depicts MLE estimates of TGSED and TEP-ID.Table 2. Measures of Goodness of fit Criteria about TSED and TEP-ID
 |
| |
|
From results of Table 2, it is concluded that the Transmuted Generalized Stretched Exponential distribution; TSED fits better than other model i.e. Transmuted Exponentiated Pareto-I distribution (TEP-ID); (Fatima and Roohi; 2015) for the data of breaking stress of carbon fibers. We have also compared the Transmuted Generalized Stretched Exponential distribution with some other distribution, TEP-ID, also resulted in Table 2 together with the Akaike Information Criteria (AIC), Consistent Akaike Information Criteria (CAIC), Bayesian Information Criteria (BIC) and Hannan Quinn Information Criteria (HQIC) measures. From the table it is observed that the TGSED proved best fit than the challenging model due to its minimum measures of AIC and BIC values. Same situation of TGSED is shown in Figure 9. 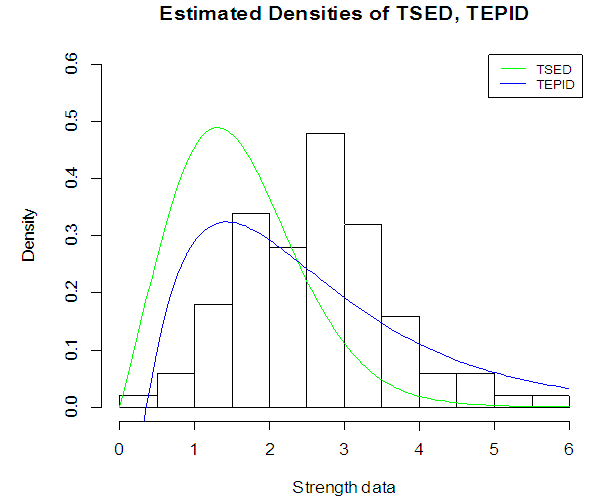 | Figure 9. Fitted Density curves with tensile strength of carbon fibers data |
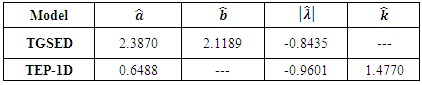
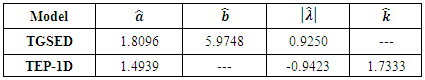
This data have been obtained from Smith & Naylor; 1987 [16]. This data set contains observations on the strengths of 1.5 cm glass fibers, measured at the National Physical Laboratory, England. The observations are: 0.55, 0.93, 1.25, 1.36, 1.49, 1.52, 1.58, 1.61, 1.64, 1.68, 1.73, 1.81, 2 ,0.74, 1.04, 1.27, 1.39, 1.49, 1.53, 1.59, 1.61, 1.66, 1.68, 1.76, 1.82, 2.01, 0.77, 1.11, 1.28, 1.42, 1.5, 1.54, 1.6, 1.62, 1.66, 1.69, 1.76, 1.84, 2.24, 0.81, 1.13, 1.29, 1.48, 1.5, 1.55, 1.61, 1.62, 1.66, 1.7, 1.77, 1.84, 0.84, 1.24, 1.3, 1.48, 1.51, 1.55, 1.61, 1.63, 1.67, 1.7, 1.78, 1.89. Table 3. MLE Estimates of TSED and TEP-ID
 |
| |
|
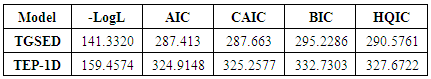
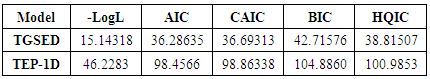
Table 3 represents MLE estimates of TGSED and TEP-ID.Table 4. Measures of Goodness of fit Criteria about TSED and TEP-ID
 |
| |
|
From results of Table 4, it is concluded that the Transmuted Generalized Stretched Exponential distribution; TSED fits better Transmuted Exponentiated Pareto-I distribution (TEP-ID); (Fatima and Roohi; 2015) for the data of strengths of 1.5 cm glass fibers. We have also compared the Transmuted Generalized Stretched Exponential distribution with TEP-ID, as showed in Table 4 with the Akaike Information Criteria (AIC), Consistent Akaike Information Criteria (CAIC), Bayesian Information Criteria (BIC) and Hannan Quinn Information Criteria (HQIC) measures. From the table it is observed that the TSED proved best fit than the competing model due to its minimum measures of AIC and BIC values. Same condition of TSED in exposed in Figure 10. 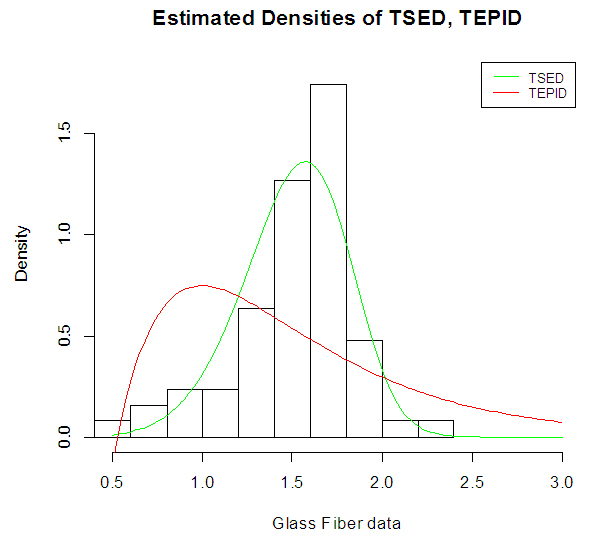 | Figure 10. Fitted Density curves with strengths of 1.5 cm glass fibers data |
6. Conclusions
In this study, the Transmuted Stretched Exponential distribution has been introduced. Its mathematical properties have been derived. The method of Maximum Likelihood has been used to estimate its parameters. The usefulness of distribution has also been shown by real life data sets. It has been observed from both of the results; numerically and graphically that Transmuted Stretched Exponential distribution of three parameters proves a better fit for data connected to all real life data as compared to its other competitive model.
References
| [1] | Abdul-Moniem, I. B., Seham, M., (2015). Transmuted Gompertz distribution. Computational and Applied Mathematics. 1(3) 88-96. |
| [2] | Alkasasbeh, M. R., Raqab, M. Z., (2009a). Estimation of the generalized logistic distribution parameters: Comparative study. Statistical Methodology 6, 262–279. |
| [3] | Aryal, G. R., Tsokos, Ch. P., (2011). Transmuted Weibull distribution: A generalization of the Weibull probability distribution. Europian Journal of Pure and Applied Mathematics. 4(2) 89-102. |
| [4] | Ashour, S. K., Eltehiwy, M. A., (2013). Transmuted Lomax distribution. American Journal of Applied Mathematics and Statistics. 1(6) 121-127. |
| [5] | Elbatal, I., Diab, L. S., Abdul-Alim, N. A., (2013). Transmuted generalized linear exponential distribution. International Journal of Computer Applications. 83(17) 29-37. |
| [6] | Fatima, A., Roohi, A., (2015). Transmuted Exponentiated Pareto-I Distribution. Pak. J. Statist. Vol. 32(1), 63-80. |
| [7] | Khan, M. S., King, R., (2013). Transmuted modified Weibull distribution: A generalization of the modified Weibull probability distribution. European Journal of Pure and Applied Mathematics. 6 66-88. |
| [8] | Laherrere, J., Sornette, D., (1998). Stretched exponential distributions in nature and economy: “fat tails” with characteristic scales. Eur. Phys. J. B 2, 525–539. |
| [9] | Mahmoud, M., Mandouh, R., (2013). The Transmuted Marshall-Olkin FrÃľchet Distribution: Properties and Applications. Journal of Applied Sciences Research 9, 5553–5561. |
| [10] | Merovci, F., (2013a). Transmuted generalized rayleigh distribution. Journal of Statistics Applications and Probability 2, 1–12. |
| [11] | Merovci, F., (2013b). Transmuted lindley distribution. International Journal of Open Problems in Computer Science & Mathematics 6, 63–72. |
| [12] | Merovci, F., (2013c). Transmuted Rayleigh distribution. Austrian Journal of Statistics 41, 21–31. |
| [13] | Merovci, F., Elbatal, I., Ahmed, A., (2014). The Transmuted Generalized Inverse Weibull Distribution. Austrian Journal of Statistics 43, 119–131. |
| [14] | Nichols, M.D., Padgett, W.J., (2006). A bootstrap control chart for Weibull percentiles. Quality and Reliability Engineering International. 22, pp. 141-151. |
| [15] | Shaw, W. T., Buckley, I. R., (2007). The Alchemy of Probability Distributions: Beyond Gram Charlier & Cornish Fisher Expansions, and Skew-Normal or Kurtotic-Normal Distributions. Technical report, Financial Mathematics Group, King’s College, London, U.K. |
| [16] | Smith, R.L., Naylor, J.C., (1987). A comparison of maximum likelihood and Bayesian estimators for the three-parameter Weibull distribution. Applied Statistics, 36, 358-369. |

 Abstract
 Reference
 Full-Text PDF
 Full-text HTML