Amer Ibrahim Al-Omari1, Agustín Santiago2, Jose M. Sautto2, Carlos N. Bouza3
1Department of Mathematics, Faculty of Science, Al al-Bayt University, Mafraq, Jordan
2Facultad de Matemáticas de la Universidad Autónoma de Guerrero, México
3Facultad de Matemática y Computación, Universidad de La Habana, Cuba
Correspondence to: Agustín Santiago, Facultad de Matemáticas de la Universidad Autónoma de Guerrero, México.
| Email: |  |
Copyright © 2018 The Author(s). Published by Scientific & Academic Publishing.
This work is licensed under the Creative Commons Attribution International License (CC BY).
http://creativecommons.org/licenses/by/4.0/

Abstract
In this study, a new acceptance sampling plan based on truncated life test is proposed for a lifetime following a New Weibull-Pareto distribution (NWPD). For various acceptance numbers, confidence levels and values of the ratio of the fixed experiment time to the particular mean lifetime as well as the minimum sample sizes required to assert the specified mean life are found. The operating characteristic function values of the suggested sampling plans and producer's risk are presented. The important tables are presented and the results are explained by a discussing the results of numerical examples.
Keywords:
Acceptance sampling, Operating characteristic function, New Weibull-Pareto distribution, Producer's risk, Consumer's risk, Truncated life test
Cite this paper: Amer Ibrahim Al-Omari, Agustín Santiago, Jose M. Sautto, Carlos N. Bouza, New Weibull-Pareto Distribution in Acceptance Sampling Plans Based on Truncated Life Tests, American Journal of Mathematics and Statistics, Vol. 8 No. 5, 2018, pp. 144-150. doi: 10.5923/j.ajms.20180805.07.
1. Introduction
The acceptance sampling plans are used to locate the acceptability of a product unit, where the consumer can accept or reject the lot, based on a random sample selected from it. The process started by obtaining the minimum sample size that is necessary to emphasize a certain average life when the life test is finished at a predetermined time. Such tests are called truncated life-time tests. Indeed, nowadays the acceptance-sampling plan is an important tool in the quality control techniques because it can help manufacturers to minimize the variability and develop the outgoing quality of the products. The concept of acceptance sampling plan based on truncated life tests is studied by many authors, as Aslam et al. (2010) and Sobel & Tischendrof (1959) for generalized exponential distribution.Rayleigh distribution by Tsai and Wu (2006), Al-Omari (2014) studied a three parameters kappa distribution, Al-Nasser and Al-Omari (2013) proposed an acceptance sampling plan in truncated life tests for the exponentiated Fréchet distribution. Kantam et al. (2001) considered truncated life tests for the log-logistic distribution, Sriramachandran and Palanivel for Exponentiated Inverse Rayleigh distribution, Al-Omari (2015) considered the time truncated acceptance sampling plans using the generalized inverted exponential distribution.In the present work, we do not intend to develop the Weibull-Pareto distribution, as others have done. We know that, the Weibull-Pareto distribution arises from the combination of the Pareto distribution, initiated by Vilfraddo Pareto (1896), and the family of distributions known as Weibull-G, which is a special case proposed by Alzaatreh et al. (2013b). Tair et al. (2015) makes a broad discussion of its properties and applications, and then our aim is to apply acceptance sampling plans to truncated life tests, assuming that the data fit a Weibull-Pareto distribution.The rest of this paper is organized as follows. Section 2 provides the probability density function (pdf) and cumulative distribution function of the New Weibull-Pareto distribution as well as some other statistical properties. Section 3 is summarized the suggested sampling plans based on the New Weibull-Pareto distribution and its properties like, the minimum sample size, the operating characteristic function and the producer's risk. Discussion of the tables and some examples are given in Section 4. Our conclusions are summarized in Section 5.
2. The New Weibull-Pareto Distribution
The probability density function of the NWP random variable is defined as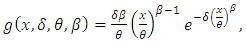 | (1) |
and its corresponding cumulative distribution function is given by | (2) |
The mean and the variance of the NWPD are 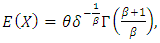 | (3) |
and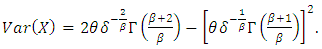 | (4) |
The corresponding hazard rate function  of the NWP random variable is defined by
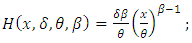 | (5) |
see Aljarrah at al., (2015) for more details about the New Weibull-Pareto distribution.
3. The Suggested Acceptance Sampling Plans
In this section, we explained the suggested acceptance sampling plans based on the New Weibull-Pareto distribution. Acceptance sampling plans based on New Weibull-Pareto distribution have not been studied previously.An acceptance sampling plan based on truncated life tests consists of the following quantities: (1) The number of units (n) on test.(2) An acceptance number (c), where if c or less failures happened within the test time (t), the lot is accepted.(3) The maximum test duration time, t.(4) The ratio  where
where  is the specified average life.
3.1. Minimum Sample Size
Assume that the lot size is sufficiently large to be considered infinite to obtain the probability of accepting a lot using the binomial distribution. Here, the problem is to determine the smallest sample size n essential to satisfy the inequality 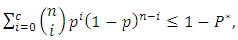 | (6) |
up to an acceptance number c for given values of  where
where  is the probability of a failure observed within the time t which depends only on the ratio
  If the number of observed failures within the time t is at most c, then from Inequality (6) we can confirm with probability
  that
that  , which implies
  The smallest sample sizes satisfying the Inequality (6) for
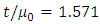
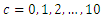
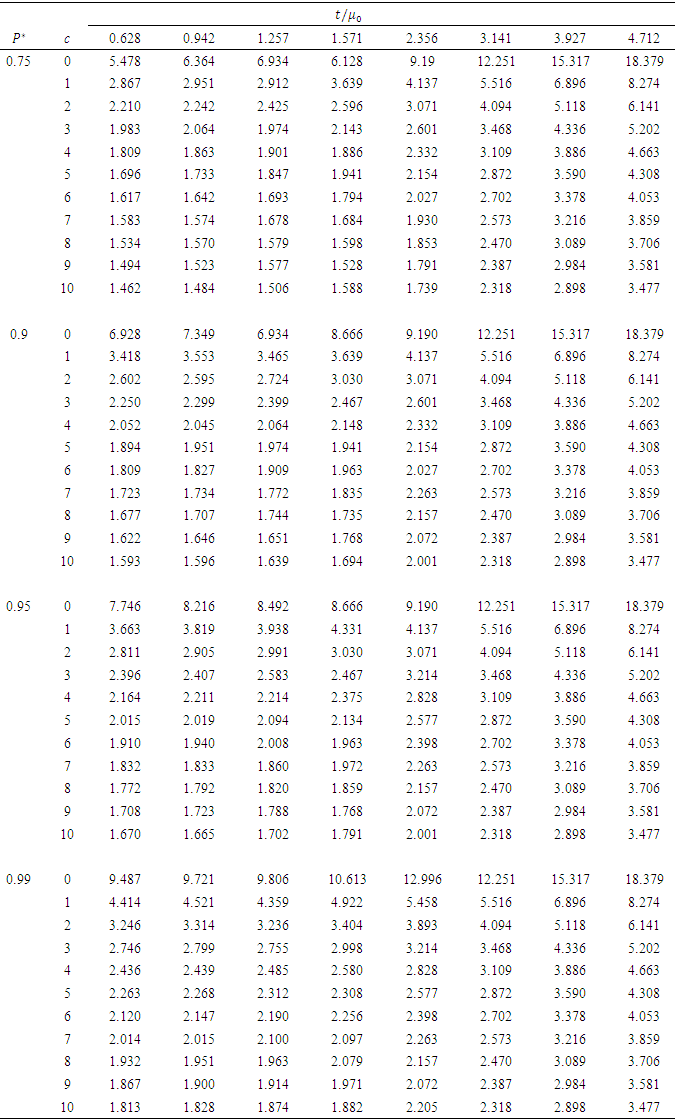
  = 0.628, 0.942, 1.257, 1.571, 2.356, 3.141, 3.927, 4.712,
  = 0.75, 0.9, 0.95, 0.99 and
  are presented in Table 1. The values of
  and
and  considered in this study are the same values which are considered in Gupta and Groll (1961), Baklizi and El Masri (2004), Kantam and Rosaiah (2001), and Al-Nasser and Al-Omari (2013).
3.2. Operating Characteristic of the Sampling Plan (n, c, t / μ0)
The operating characteristic function of the sampling plan  is the probability of acceptance the lot. The operating characteristic function can be considered as a source for choosing the minimum sample size, n, or the acceptance number, c. It is defined as
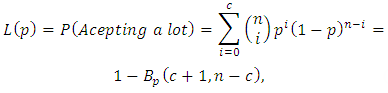 | (7) |
where  is considered as a function of
  (the lot quality parameter), and
 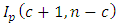 is the incomplete beta function defined as
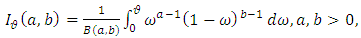 where
where  The operating characteristic function values as a function of
  for the sampling plan
  when the parameters of the NWPD are
  and
and  are reported in Table 2. Also, for fixed time t, the operating characteristic is a decreasing function in the probability
  , while
  itself is a monotonically decreasing function in
3.3. Producer's Risk
The probability of rejecting the lot when  in known as the producer's risk and it is defined as
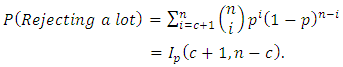 | (8) |
For a given value of the producer's risk, say  under a given sampling plan, one may be interested in knowing what smallest value of
  that will assert the producer's risk is at most
  The value of
  is the minimum positive number for which
 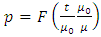 satisfies the inequality
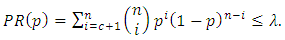 | (9) |
For a given acceptance sampling plan  based on the NWPD at a given confidence level
  the smallest values of
  satisfying Inequality (9) are given in Table 3.
4. Illustration of the Tables
The smallest sample sizes necessary to ensure that the mean life exceeds  with probability
  or greater, and acceptance number c for
  and
and  in the NWPD distribution are given in Table (1). To illustrate the procedure, when
  ,
, 
 and
and  the corresponding table value is
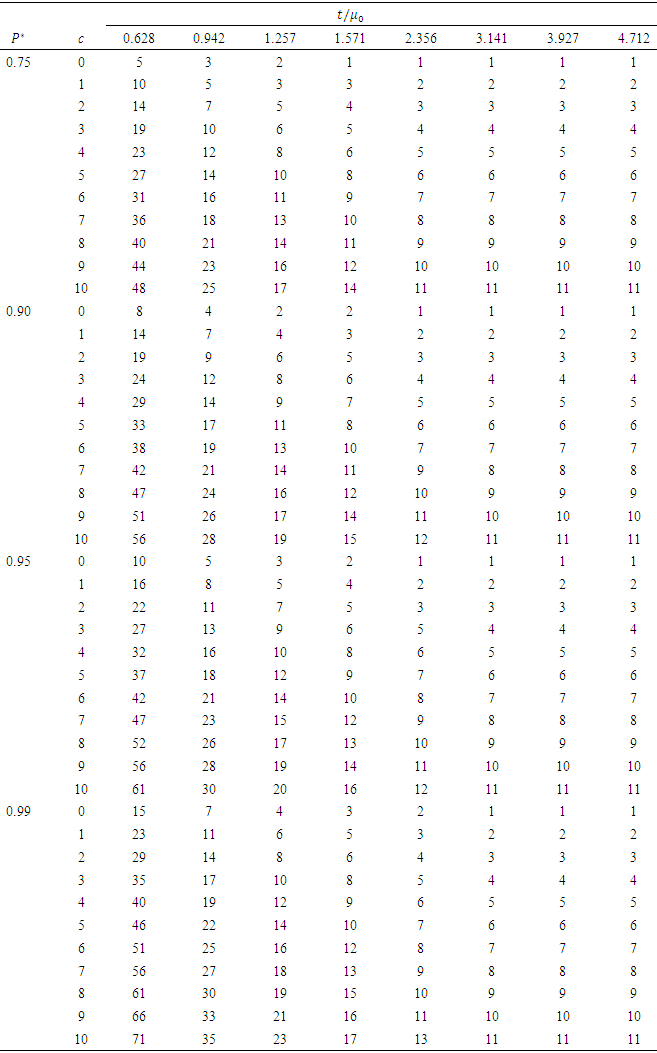
  units, which are should be put on test. This implies that out of 8 units, if 3 items fail before the time t, then a 0.99% upper confidence interval for the mean
  is
is  That is if out 8 items, three or less are fail before time t, then the lot can be accepted with probability 0.99. Based on the suggested acceptance sampling plan for the NWPD it turns out that the minimum samples sizes obtained in this paper are less than that their counterparts in Baklizi and El Masri (2004), and Al-Nasser and Al-Omari (2013). The operating characteristic function values for the proposed sampling plan for the time truncated acceptance sampling plan calculated from Table (1) for various values of
  and
and  with acceptance number
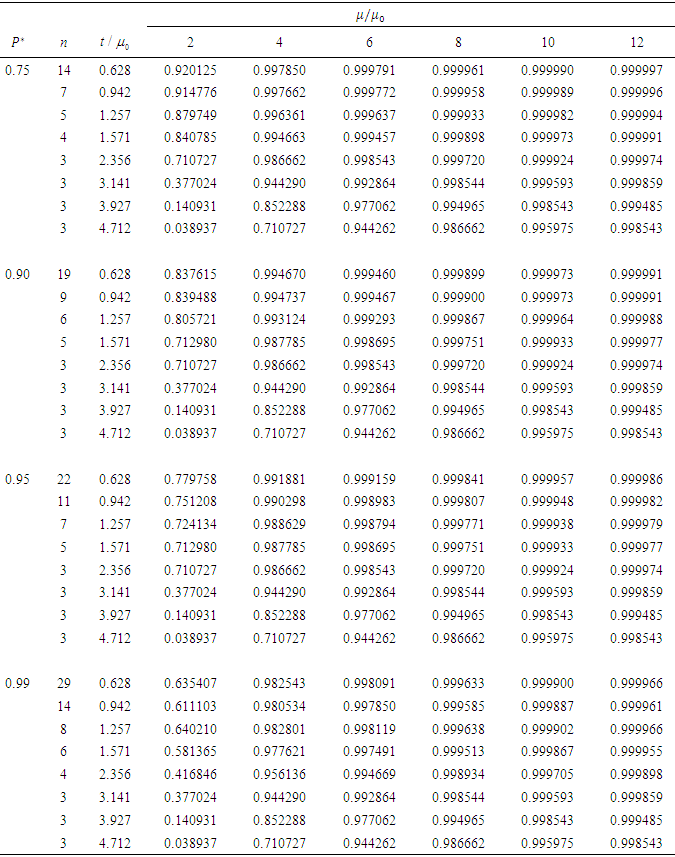
  From Table 2 the operating characteristic values for the sampling plan
  are as follows:
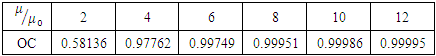
Table 1. Minimum sample sizes to be tested for a time t to assert the average life exceeds a given value
 with probability with probability
 and acceptance number c for NWPD with and acceptance number c for NWPD with
 and and

 |
| |
|
Table 2. Operating characteristic function values for the sampling plan
 with a given probability with a given probability
 under the NWPD with under the NWPD with
 and and

 |
| |
|
This implies that if the true mean life is twice the specified mean life  the producer’s risk is about 0. 418635, and the producer’s risk is about almost equal zero when the true mean is greater than or equal to 4
  times the specified mean.From Table 3 we can get the value of the minimum ratio of the true mean lifetime to the specified one for various choices of the acceptance
  such that the producer’s risk may not exceed 0.05. Thus, for
 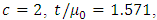 and
and  the table entry is
 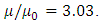 This shows that the product can have an average life of 3.03 times the specified average lifetime of 1000 hours in order that with
  the product is accepted with a probability of at least 0.95.
Table 3. Minimum ratio of
 for the acceptance of a lot with producer’s risk of 0.05 under the NWPD when for the acceptance of a lot with producer’s risk of 0.05 under the NWPD when
 and and
 |
| |
|
5. An Application
Now we will explain the suggested acceptance sampling plan using the lifetime (in months) to first failure of 20 small electric carts used for internal transportation and delivery in a large manufacturing facility. The data are 0.9, 1.5, 2.3, 3.2, 3.9, 5.0, 6.2, 7.5, 8.3, 10.4, 11.1, 12.6, 15.0, 16.3, 19.3, 22.6, 24.8, 31.5, 38.1, 53.0, and its descriptive statistics are given in Table 4. The same data are investigated by Zimmer et al. (1998) and Lio et al. (2010), and it is asymmetrical distributed.Table 4. Descriptive statistics of the lifetime in months to first failure of 20 small electric carts
 |
| |
|
We used the following criteria to fit the data for the NWPD, which are the Akaike information (AIC), Bayesian information (BIC), consistent Akaike information (CAIC), and Hannan-Quinn information (HQIC), Kolmogorov-Smirnov (K-S), and the Anderson-Darling (A-D) statistic. The values of these criteria are summarized in Table 5 and they indicate that the NWPD fitted these data.Table 5. The AIC, CAIC, BIC, HQIC, W, A, K-S, and -2MLL for the electric carts data
 |
| |
|
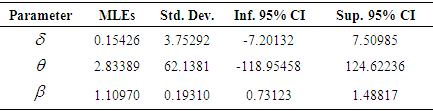
The maximum likelihood estimators (MLE) of the NWPD parameters with standard deviation (Std. Dev.) and the Inf. 95% CI and Sup. 95% CI are given in Table 6. Table 6. MLEs, Std. Dev. and the CI for the NWPD parameters based on the electric carts data
 |
| |
|
The MLEs of the parameters are 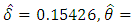
 and
and  and hence
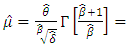
 Suppose that the lifetime of a product follows a NWWD. Also, assume that the specified mean life is
  months and the testing time
  months. This leads to the ratio
  Therefore, from Table (1) the sampling plan for
  is
is 
 Thus, we accept the lot if only the number of failures before
  months is less than or equal 10. Because the number of failures before
  months is 6, then we can accept the lot.
6. Conclusions
In this paper, we proposed the time truncated acceptance sampling plan for the New Weibull-Pareto distribution. The tables for the minimum sample size required to assure a certain average life of the experimental items were derived and are given. The operating characteristic function values and the associated producer’s risks are also provided. Practitioners can use the results obtained in this paper and also it can be used for other distributions which can be converted to New Weibull-Pareto distribution.
References
| [1] | ALJARRAH, M.A., FAMOYE, F., and LEE, C. (2015): A New Weibull-Pareto distribution. Communications in Statistics—Theory and Methods, 44, 4077–4095. |
| [2] | AL-NASSER, A.D. and AL-OMARI, A.I. (2013): Acceptance sampling plan based on truncated life tests for exponentiated Frechet distribution. Journal of Statistics and Management Systems, 16, 13-24. |
| [3] | AL-OMARI, A.I. (2014): Acceptance sampling plan based on truncated life tests for three parameter kappa distribution. Economic Quality Control, 29, 53-62. |
| [4] | AL-OMARI, A.I. (2015): Time truncated acceptance sampling plans for generalized inverted exponential distribution. Electronic Journal of Applied Statistical Analysis, 8, 1-12. |
| [5] | ASLAM, M. KUNDU, D., and M. (2007): Time truncated acceptance sampling plans for generalized exponential distribution. Journal of Applied Statistics, 37, 555-556. |
| [6] | BAKLIZI, A., and EL MASRI, A. (2004): Acceptance sampling based on truncated life tests in the Birnbaum Saunders model. Risk Analysis, 24, 1453-1457. |
| [7] | GUPTA, S. S. and GROLL, P. A. (1961): Gamma distribution in acceptance sampling based on life tests. Journal of American Statistical Association 56, 942–970. |
| [8] | KANTAM, R.R.L., ROSAIAH, K. and RAO, G.S. (2001): Acceptance sampling based on life tests, log-logistic model. Journal of Applied Statistics, 28, 121–128. |
| [9] | LIO, Y.L., TSAI, T.R. and WU, S.J. (2010): Acceptance sampling plans from truncated life tests based on the Burr type XII percentiles. Journal of the Chinese Institute of Industrial Engineers, 27, 270-280. |
| [10] | SHANKER, R., SHARMA, S., SHANKER, U. and SHANKER, R. (2013): New Weibull-Pareto distribution and its application to waiting times data. International Journal of Business Management, 3, 1-11. |
| [11] | SRIRAMACHANDRAN and PALANIVEL, (2014): acceptance sampling plan from truncated life tests based on exponentiated inverse Rayleigh distribution. American Journal of Mathematical and Management Sciences, 33, 20–35, 2014. |
| [12] | SOBEL, M. and TISCHENDROF, J.A. (1959): Acceptance sampling with new life test objectives. Proceedings of Fifth National Symposium Reliability and Quality Control, Philadelphia, Pennsylvania, 108–118. |
| [13] | TSAI, T., and WU, S. (2006): Acceptance sampling based on truncated life tests for generalized Rayleigh distribution. Journal of Applied Statistics, 33, 595-600. |
| [14] | ZIMMER, W.J., J.B. KEATS and F.K. WANG, (1998): The Burr XII distribution in reliability analysis. Journal of Quality Technology, 30, 386-394. |

 Abstract
 Reference
 Full-Text PDF
 Full-text HTML