S. S. Abdulkadir1, Yaska Mutah2
1Department of Statistics and Operations Research, Modibbo Adama University of Technology, Yola, Adamawa State, Nigeria
2Department of Mathematics and Statistics, Federal Polytechnic, Mubi, Adamawa State, Nigeria
Correspondence to: S. S. Abdulkadir, Department of Statistics and Operations Research, Modibbo Adama University of Technology, Yola, Adamawa State, Nigeria.
| Email: |  |
Copyright © 2018 The Author(s). Published by Scientific & Academic Publishing.
This work is licensed under the Creative Commons Attribution International License (CC BY).
http://creativecommons.org/licenses/by/4.0/

Abstract
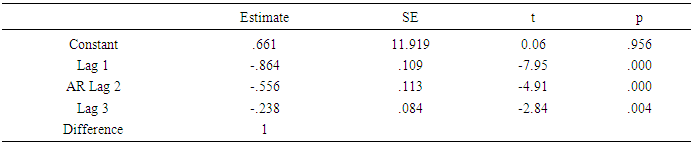
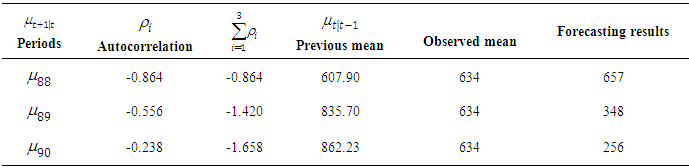
Malaria is a long lasting parasitic disease which transmit through the bites of an infected female Anopheles mosquito. The World Health Organization report shows that malaria is transmitted throughout Nigeria with 97% of the population at risk. It is a leading cause of mortality in children under five years of age and responsible for an estimated 225,000 deaths annually. To effectively tack the increasing global problem of malaria, Roll Back malaria was launched in 1998 as a new intervention to bring malaria cases to the barest minimum by year 2015 in Africa. However, the program still fall short of achieving universal access to preventive measure, diagnosis testing and treatment (WHO, 2012). Nigeria is one of the countries that are unable to provide evidence of impact due to incompleteness or inconsistency of reporting over time. In this study a modified version of Poisson Exponentially weighted Moving Average (PEWMA), the Poisson Autoregressive (PAR(p)) model, is used to model the trend and forecast of malaria cases in Mubi North Local Government Area of Adamawa State, Nigeria. The data on reported cases of malaria from the year 2008 to 2015 were obtained from National Health Management Information System through Primary Health Care Agency in Mubi. The analysis shows that a minimum of 1457 monthly cases of malaria were reported before and after the intervention. Stationarity of the data was obtained using natural logarithm transformation at the first difference and the adequate model for the Poisson Autoregressive model of order p is ARIMA (3, 1, 0). Result indicates a significant decline in monthly cases of malaria with AR 1, 2 and 3 estimates values as -0.864, -0.556 and -0.238 and a significant p-values as 0.00, 0.00 and 0.004 respectively. The forecasting results for the months of January, February and March 2016 malaria counts are 657, 348 and 256 respectively, this result shows that malaria cases is declining significantly and thus we recommend that the Government should sustain the intervention.
Keywords:
PAR, Poisson, Roll back, Malaria, Forecasting, Lag
Cite this paper: S. S. Abdulkadir, Yaska Mutah, Forecasting the Effects of Roll Back Malaria Intervention in Mubi North Local Government Area, Nigeria: An PAR (p) Model Approach, American Journal of Mathematics and Statistics, Vol. 8 No. 5, 2018, pp. 111-118. doi: 10.5923/j.ajms.20180805.02.
1. Introduction
Malaria has been a long lasting parasitic disease with symptoms of fever, headache, shivering, and pains in the joint, vomiting, anaemia and convulsions; it is transmitted through the bites of an infected, female Anopheles mosquito and occasionally through blood transfusion. Malaria is a major health problem in Nigeria where it accounts for more than cases of contraction and deaths than any other country in the world. It is the only vector borne disease to be placed on the World Health Organization’s Disability adjusted life years list. An estimated 3.2 billion people were at risk of being infected with malaria and about 80% of malaria deaths in 2013 were estimated to occur in 15 African countries. The DR Congo and Nigeria accounted for 39% of global malaria deaths and 34% of global malaria cases (WHO, 2014). The World Health Organization (WHO) 2011 report shows that malaria is transmitted throughout Nigeria with 97% of the population at risk. It is a leading cause of mortality in children under five years of age and responsible for an estimated 225,000 deaths annually. Malaria can be prevented by the use of Long-lasting Insecticidal nets, mosquito coils and repellants, spraying of insecticides in houses, cleaning of environments, prevention of water log and stagnant water and vaccine immunization for children below the age of 5 years (UNICEF, 2010). Over half of all the countries in the world are affected by malaria. There were 97 countries and territories with on-going malaria transmission and 6 countries in the prevention of reintroduction phase, making a total of 103 countries and territories (of a total of 196 internationally recognized countries) affected by malaria. Out of the estimated 584,000 deaths from malaria that occurred worldwide in 2013, about 528,000 of these deaths or 90% were in the African Region, 7% in the south-east Asia Region and 2% were in Eastern Mediterranean Region (WHO, 2014). Malaria is prevalent in tropical regions because of the high amount of rainfall, humidity, and temperature along with stagnant water in which mosquito larvae breed (Olowe et al, 2015).In October 1998, WHO, UNICEF, and UNDP, together with the World Bank launched Roll Back Malaria (RBM) as a new bold effort to mobilize global partnerships among governments, donor agencies, Non-Governmental Organization (NGOs) and communities to harness and effectively tackle the increasing global problems of malaria. This new initiative is a response to the request by African Head of States and Government at the 1997 Organization of African Unity (AOU) summit meeting in Harare. The RBM has now been accepted by many heads of states in Africa who have expressed strong commitment to intensify malaria prevention and control in their own countries with the assistance of the international community. The intervention is aimed at binging malaria cases to the barest minimum by the end of the year 2015 (WHO, 2014). However, the program still fall short of achieving universal access to preventive measure, diagnosis testing and treatment (WHO, 2012). Nigeria is one of the countries that are unable to provide evidence of impact due to incompleteness or inconsistency of reporting over time. The main objective is to determine the trend and to forecast the cases of malaria using Poisson Autoregressive model approach developed by Brandt and Williams (1999).
2. Data and Method
The data used for the study was obtained from the National Management Information System (NHMIS) through Primary Health Care Agency (PHCA) collection centre in Mubi North Local Government Area of Adamawa State, Nigeria. The study covered the monthly reported malaria cases from October 2008 to December 2015 which include pre and post intervention periods.
2.1. Study Area
Mubi town is located on Latitude 10.27° and Longitude 13.28° at an altitude of 1906ft. It lies on the west bank of the Yedseram River a stream that flows north into Lake Chad, and on the western flanks, at the foot of Mandara Mountains which separate Nigeria from the Republic of Cameroon. Mubi town is in Adamawa State, North-Eastern Nigeria. Yola, the Adamawa State capital is about 196 km from Mubi; it is the second largest commercial town in Adamawa State. The population of the town as at 1991 census was put at 128,900. The major occupation of the people is farming and the arae is blessed with higher institutions of learning which include Adamawa State University, The Federal Polytechnic, School of Health Technology and College of Legal Studies. It has one of the major Cattle International Market and Commercial banks in the state.
2.2. Method of Data Analysis
2.2.1. A Poisson Autoregressive Model for Count Data
Modelling counts of events can be found in social and physical sciences. For the regression analysis of count data, the ordinary regression model will not be applicable, since the response variable assume discrete values. In literature (see Cameron and Trivedi, 1998 and Lawal and Famoye, 2013), Poisson regression model is used instead and it is a natural starting point to extend to dependent count data. Time series of count are positive and tend to be over-dispersed, an attempt to model using static Poisson, where mean and variance are the same, or negative binomial models with constant mean will not perform well. The time series for continuous data results in negative values, hence is not suitable for time series count data. Many count data time series models can be characterized as either observation-driven models or parameter – driven model. In observation- driven models, the observed count at time t follows Poisson distribution with its mean equation includes lagged values of the observed variable, whereas in the parameter-driven model the equation of mean at time t contains some random variable which is independent of past observations, Cox (1981). Gunwald, et al; (1997) discuss modeling an event count series using a linear first order autoregressive (AR). The was generalized into AR(p) by Brandt and Williams (2000).Poisson autoregressive PAR (p) methodology is used in modeling and forecasting the time series count data.There are primarily three steps in using and identifying the event count time series model and specification namely:(i) Identification: Determine the presence of dynamics using autocorrelation function plots. This provides a preliminary assessment of the order and magnitude of the dynamics.(ii) Specification and Estimation: Estimate the model based on the dynamics found from identification.If the ACF shows a dampening dynamic process, we estimate a PAR (p) model.If no dynamics are present, estimate a negative binomial, Poisson, or generalized event count model.(iii) Diagnosis and Testing: Using standard testing procedures, evaluate the estimated models against alternative specifications. This includes testing any estimated dynamic model against the Poisson regression model as applied in both the PAR (ρ = 0) and the Poisson Exponentially Weighted Moving Average (PEWMA), when ω = 1.In their earlier work, Brandt et al; (2000) develop a time series model for persistent event count. Persistence time series process were found to be identified by sample autocorrelation functions that have significant memory. In such data the effects of shock persist over many periods. The initial model, Poisson exponentially weighted moving average (PEWMA) model could capture the dynamics by estimating a time dependent discounted average of the mean to the event series to account for persisted dynamic process in the data, but it is not suitable for cyclical and short memoried processes that are mean reverting. Hence the development of PAR(p). This can be used to model stationary, mean revering event count process.The PEWMA assumptions can be summarized by the following equations and densities:Measurement Equation: 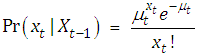 Transition Equation:
 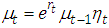 , where
 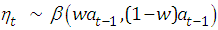 Conjugate prior:
 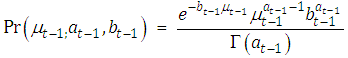 where:w: is the parameter that capture discounting in the conditional mean function for the event counts.
 : is the beta distribution random component of the state equation.Brandt et al; (2000) extended Kalman filter, the predictive distribution, and the log-likehood function that characterize the model.To construct PAR(p), the multiplicative transition equation in PEWMA is replaced by a linear autocorrelation process of order p. Then,Let
  =
=  be all prior information about the series of interest at time, where
  are the past counts and
  are the past covariates.Assume that the
  is the realization from (time homogeneous) Markov process with the conditional transition probability
  , and that
  .Let the conditional expectation
  at time t have a finite mean. Then
  is a p-th order linear autoregressive process if
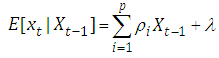 | (2.1) |
where  and
and  are any real number.
2.2.2. Determination of Stationary of Linear Autoregressive of Order p (AR(p))
The equation (2.1) generates a mean stationary time series model. Grunwald, Hyndman, Tedesco and Tweedie (1997), using iterative expectations, to show that this generates a mean stationary process for AR(p) process while Brandt and Williams generalize this result by finding iterated expectations for the AR(p) process in equation.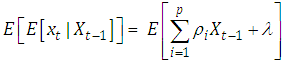 | (2.2) |
and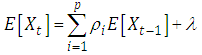 | (2.3) |
Equation (2.2) is a geometric series for  , then
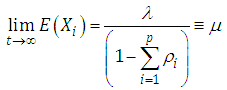 | (2.4) |
Since  (by definition) equation (2.1) can be written as
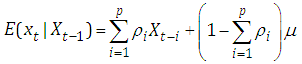 | (2.5) |
This is a stationary linear AR(p) process. Note that the derivation makes no use of the distribution of  . The only role the distribution of
  plays is in defining the admissible values of
  .The linear AR(p) model and the assumptions that the event counts are Poisson distribution to define a new transition equation for state-space model with an AR(p) process.This Poisson autoregressive or PAR(p) model can be defined as follows:(i) Suppose that the observed event counts,
  for t = 1,2,…,T are drawn from a Poisson distribution conditional on
  :
: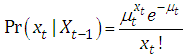 | (2.6) |
This defines the measurement equation for the observed data.(ii) Assume the  is the conditional mean of the linear AR process of
  as in (2.5). This define the state variable for the model. Since Poisson distribution is the measurement equation, this sate density is in the exponential family and can be characterized by it mean
  and the variance
  .(iii) Finally, assume that the density of the state variable has a gamma distributed conjugate prior, so
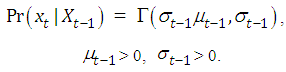 | (2.7) |
with 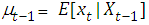 and
and 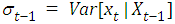 The prior is constructed using the observed data. This done by finding the conditional mean and variance of the data at time t based on the previous t-1 observations. The prior distribution is a gamma with mean
  and variance
  .These computations need filtering using equations (2.5), (2.6) and (2.7). See Brandt and Williams for discussion of the PAR(p).Since the measurement equation is Poisson, and sate equation is gamma, one can derive the forecast density for one –step ahead distribution. This provides an estimate of the posterior for time t:
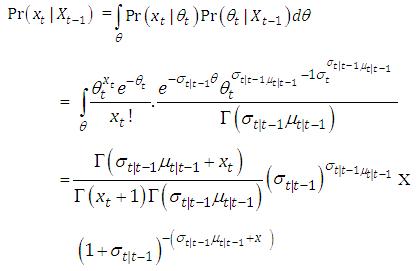 | (2.8) |
This is negative binomial distribution. Based on this distribution we can construct the log-likelihood for the PAR(p) as follows: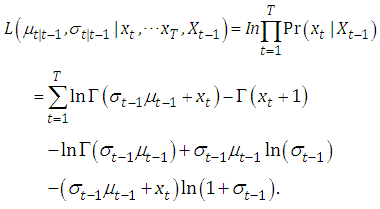 | (2.9) |
Covariates can be introduced by replacing  with
with  .Using the properties of the negative binomial distribution, we can derive the forecast function for the conditional mean and variance of a PAR(p) series based on the optimized values of
  and
and  . The one-step ahead conditional forecast function for PAR(p) model is
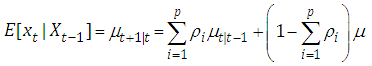 The forecast variance is
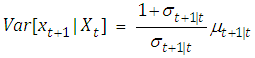
2.2.3. Model Identification and Specification
Grunwald el al, (1997) show that autocorrelation function for linear AR(1) models (for many conditional distributions) can be written in the same form as the standard Gaussian time series. This is because ACF does not depend on the assumption of normality. Brandt and Williams (2000) conjecture that the same applies to AR(p) model, so the sample ACF can be used to determine the model order. Box and Jenkins (1976) show that an ACF is enough for identification of an ARIMA model. The same holds for a PAR(p) because the auto regressive models for latent mean is linear (Brandt and Williams, 2000).Following these steps of obtaining PAR(p) we determined the appropriate model for the reported malaria cases using SPSS version 21.0 and STATA.We define as follows:  Previous observed malaria prevalence
 : One-step ahead conditional mean given the time
 : Autocorrelation value of the observed malaria cases
 : Previous conditional mean of the observed malaria cases
 : mean value of the observed malaria cases
3. Results and Interpretation
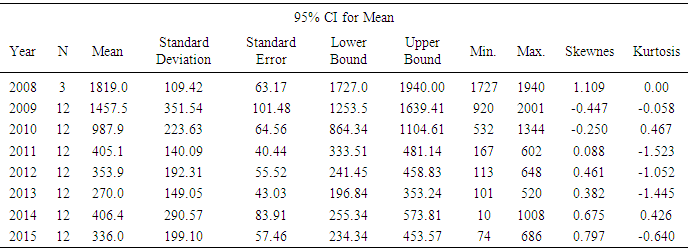
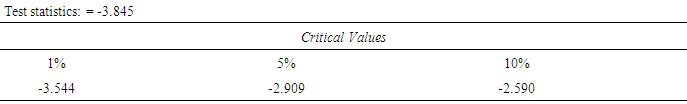
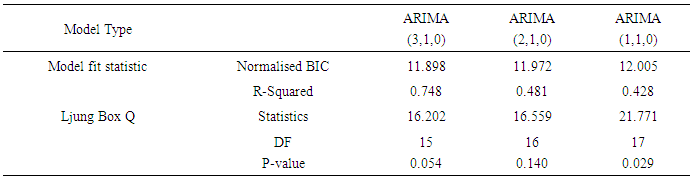
The Table 3.1 below shows the descriptive statistics of monthly reported malaria cases in Mubi metropolis before the intervention (2008 and 2009), during the intervention (2010), and after the intervention (2011 to 2015). The results indicate that highest average monthly cases of malaria, 1819 and 1457.50, were recorded in the 2008 and 2009, respectively. Thereafter, the cases began to decline.Fig.1 shows a plot of frequency distribution of reported malaria cases for 87 data points. The plot indicates non-stationary and presence of seasonality at every July of each year of observations. The implication of this is that the PAR(p) cannot be an appropriate model for the data because it requires an assumption of stationarity. Hence differencing of order 1 was done and the result indicated in Fig.2 in the appendix. The ACF and PACF in Figs 3a and 3b respectively indicate stationary of the reported malaria counts as the spikes are all within the control bound under 95% confidence interval. Furthermore, we set up a hypothesis of stationary against non-stationary using Unit Root test. The test statistic, Augmented Dickey – Filler (see Table 3.2) is less than the critical value showing that the null hypothesis is sustained. Having satisfied the assumption of stationary the PAR(p) was fitted to differenced data and the Ljung-Box indicates that Autoregressive Integrated Moving Average, ARIMA(3,1,0) is the appropriate model for that data, having a least NBIC of 11.898 and R- squared of 0.748 with a P-value of 0.054. The fitted model was used for prediction of malaria cases.Table 3.1. Descriptive Statistics of Monthly Reported Malaria Cases
 |
| |
|
Table 3.2. Unit Root Test after First Differencing
 |
| |
|
Table 3.3. Model Statistics for Selected ARIMA Models
 |
| |
|
Table 3.4. Autoregressive Model Parameter
 |
| |
|
Table 3.5. Forecasted Malaria Incidences in Mubi Metropolis
 |
| |
|
4. Summary and Conclusions
The main objective of the research was to forecast reported malaria cases in Mubi North Local Government Area and to use the Poisson autoregressive method of time series analysis to model the pattern and make forecast of the future based on the time series model. The result of fitting PAR indicates that malaria cases have seasonality and there was marginal decline as a result of the intervention. The descriptive statistics using SPSS version 21 indicated reduction in malaria cases with maximum malaria cases of 2001 before the intervention and a maximum of 1008 cases and 270 monthly average during the intervention. Forecasting result from January 2016 to March 2016 shows that malaria incidence is declining as compared to pre-intervention period. We conclude that the Poisson Autoregressive model is a good model for time series count data and the intervention is an effective measure of controlling malaria cases.
Appendix
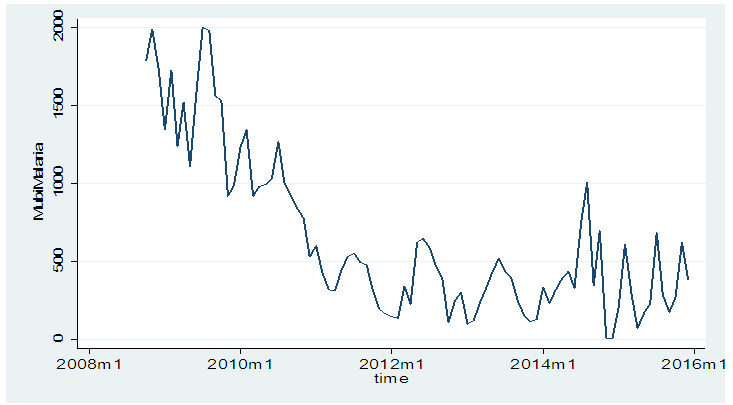 | Figure 1. A time series plot of monthly malaria cases by NHMIS of PHCA Mubi |
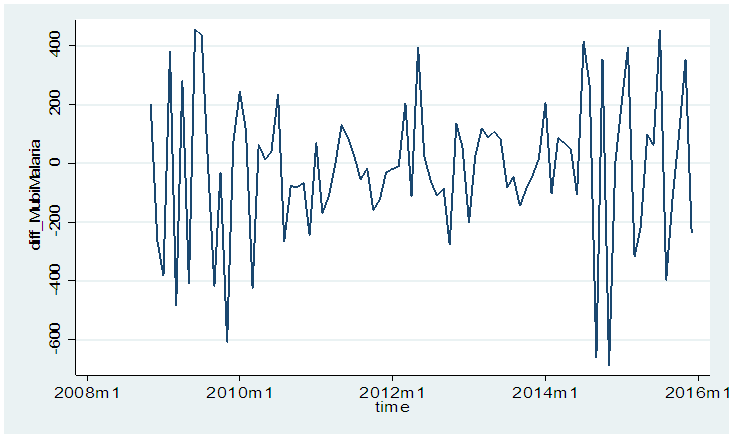 | Figure 2. Time series plot of first differencing of malaria data |
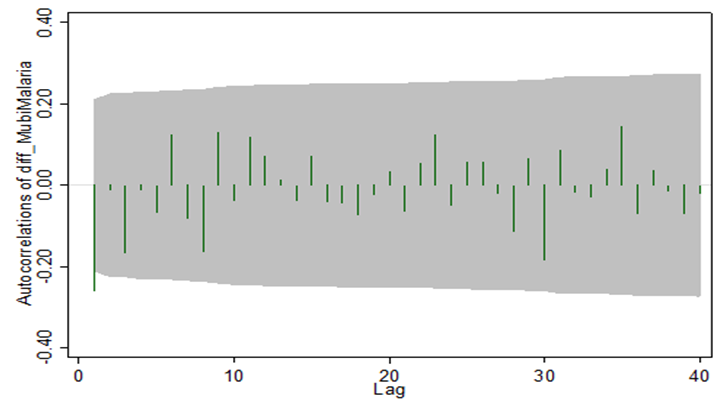 | Figure 3a. ACF Plots (Correllogram) at first differencing |
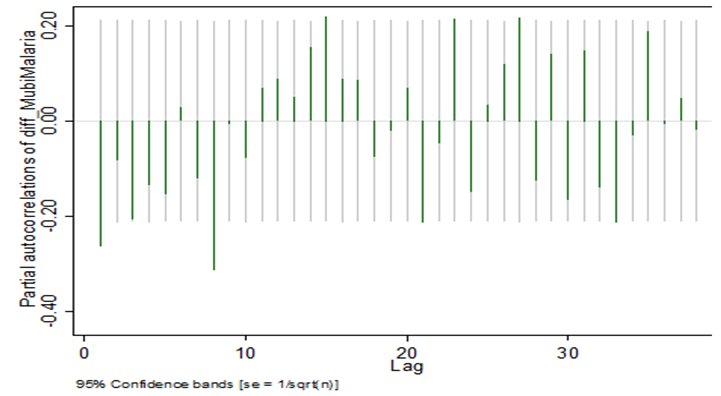 | Figure 3b. PACF Plots (Correllogram) at first differencing |
References
| [1] | Ashenafi, S.B; Tejitu, K.T, and Tilahun, F.A; (2016). Malaria Distribution in Kucha district of Gamo Gofa Zone, Ethopia: A Time series approach. Journal of Theoretical and Applied Statistics.5 (2), 70-79. |
| [2] | Box, E.P, and Jenkins, G.M. (1976). Time Series Analysis, Forecasting and Control. An Francisco: Holden Day. |
| [3] | Brandt, P.T, and Williams, J.T. (2000). A linear Poisson Autoregressive model: The Poisson AR(p) model. American Journal of Political Science. 9 (2). 166-169. |
| [4] | Brandt, P.T; Williams, J.T; Benjamin, O.F; and Brian, P. (2000). Dynamic Modelling for Persistent Event Count Time Series. American Journal of Political Science.44 (4):823-843. |
| [5] | Cameron, A; and Trivedi, P; (1998). Regression Analysis of Count Data. New York: Cambridge University Press. |
| [6] | Cox, D.R. (1981). Statistical analysis of Time Series: Some recent Development. Scandinavian Journal of Statistics (8). |
| [7] | Gunwald, G; Hamza, K; and Hyndman, R. (1997). Some Properties and Generalization of Non-negative Bayesian Time Series Models. Journal of the Royal statistical Society, Series 59(3): 615-626. |
| [8] | Lawal, B and Famoye, F. (2013). Applied Statistics: Regression and Analysis of Variance. University Press of America, Inc. |
| [9] | Olowe, O.A; Makanjuola, O.B; Awa, A, O. and Olowe, R.A. (2015). Malaria in Africa and historical Perspective: The Journey so far. Journal of biology and Medical Sciences, 3(2409-51190. |
| [10] | UNICEF, (2010). Malaria Prevention and Treatment: The Prescriber 18(1-14). |
| [11] | World Health Organization Report (2012) http://www.who.inter/mediacentre/news/releses/2013/malaria/20121217/en/. |
| [12] | World Health Organization (2013) Retrieved from http://www.who.int/mediacentre/news/releases/en/. |
| [13] | Health Health Organization (2014) retried from http://www.who.int/mediacentre/news/releases/en/2014/malria. |
| [14] | World Health Organization Report (2015) www.who.int/mediacentre/news/releases/2015/world-malria-day-2015/en/. |

 Abstract
 Reference
 Full-Text PDF
 Full-text HTML