Faweya O.1, Adeniran A. T.2, Balogun K. O.3
1Department of Statistics, Ekiti State University, Ado-Ekiti, Ekiti State, Nigeria
2Department of Mathematical Sciences, Augustine University Ilara-Epe, Lagos, Nigeria
3Department of Statistics, Federal School of Statistics, Ibadan, Oyo State, Nigeria
Correspondence to: Faweya O., Department of Statistics, Ekiti State University, Ado-Ekiti, Ekiti State, Nigeria.
| Email: |  |
Copyright © 2018 The Author(s). Published by Scientific & Academic Publishing.
This work is licensed under the Creative Commons Attribution International License (CC BY).
http://creativecommons.org/licenses/by/4.0/

Abstract
Criminal activities of various forms are perpetrated both among the youths and the old at alarming rate in Nigeria. They are numerous and coherent and sometimes cumbersome to distinguish one from the others. In this study, statistical analysis showed that the commonly committed crimes out of others in Ekiti State are theft and stealing, store and office breaking, grievous harm, house breaking and assault occult harm and the highest and commonly committed crimes in Osun State are; house breaking, receiving stolen property, armed robbery, assault, grievous harm and wounding, arson. Principal component analysis (PCA) was used to reduce the dimensionality and the results revealed that the first five principal variables which explained 66.769% of the total variation and the first six principal variables which accounted 93.881% of the total variation in Ekiti State and Osun State data set, respectively have been retained using the scree plot.
Keywords:
Criminal activities, Principal components, Dimensionality, Total variation, Scree plot
Cite this paper: Faweya O., Adeniran A. T., Balogun K. O., Principal Component Analysis of Crime Rate in Nigeria: A Case Study of Ekiti and Osun State, American Journal of Mathematics and Statistics, Vol. 8 No. 4, 2018, pp. 79-88. doi: 10.5923/j.ajms.20180804.01.
1. Introduction
Crime is any act of omission which the law forbids and for which it prescribes punishment to be administered by the state through a proceeding in its own name Durkhein (1933) [5]. Ackernan and Murray (2004) [1], a criminal is a person who has committed a crime and who has been apprehended tried by a court of justice prove guilty of the committed offences and finally imprisoned or punished by the government. Crime can be caused by so many factors, criminologists in their knowledge of crime has stipulated some core causes of crime across the globe. They categorized them as early life experience, environmental factors such as growing up in a disrupted family and or uneducated area, poverty affected area, high crime neighborhood and the likes are associated strongly with child anti-social behavior, of which crime is one type (Tanimu, 2006) [16]. Political activity is another cause of high rising of criminal activities in the west African sub region. The politicians in their bids to absorb power, used hired-thugs, or paid assassins/hired killers to perpetrate violence and instill fears on their opponents. Politicians leverage on the high rate of unemployment in the society to recruit idle youths to bribe the voter and electorates, cast multiple votes, snatch ballot box, invade voters and electorates who are not subscribing to their will and do everything possible to favour their unscrupulous interest. The menace of crime across the globe is a serious concern. Every country across the globe has its particular problem. The west African sub region and Nigeria in particular is not an exception. Nigeria is becoming unsafe due to the high rate of crime reported on a daily basis. There is no disagreement from both macro and minor level of studies that the rate of crime in Nigeria has reached an unacceptable level (Fajemirokun, 2006) [6]. According to Honourable Patrick Obahiagbon (2012) [11], member of house of representative in 2012, said “Crime of various form has alluded and polluted the affair of this nation making the microscopic proportion of the population of this country live in pleasant luxury and prospective solicitude while the vast majority of Nigerian continuing to fabricate between exorbitant enthusiasm and irrational irritability”. The political leaders and sit-holders siphon and misappropriate the national treasury. Criminal in returns kidnapped politicians or their relatives and demand huge amount of money to release them, while some intrude Nigerian major source of revenue (oil sector) break the pipeline and illegally smuggle the petroleum products. Regardless of Nigerian place of settlement, occupation, sex, religion, ethnic and the likes, crime has been seen as birthright. The criminal activities had continued to manifest in various forms such as; Boko Haram killings in the North, armed robbery, oil bunkering in south-south part of the country, kidnapping, abduction, raping, drug trafficking, hostage taking and assassinations. Many insurgent groups in Nigeria is a product of discrepancy or conflicts of interests that is existing between the norms of the governments or leaders and the norm of group or society or subculture that the criminals belong. Among these trending criminal activities, human kidnapping for a ransom and terrorism top the chart. It has become so rampant that major crimes of past years like armed robbery and human assassination has being swept to the background even though the government is yet to find a lasting solution to all of these menaces. Despite the fact that Nigerian government and all its stakeholders put an ingenious effort to control and curb the menace of social crime of a particular form, in a particular region of the country, an experience show that it metamorphosis to another significant new crime either in the same region or another. The degradation of Nigeria economy has its great determinant in the high rate of crime occurrences (Danbazau, 2017) [4]. Majority of the citizens of this country see theft/armed robbery, stealing, ritual and the likes as a solution to their economic and social status problem (Nigeria Police Report, November 2017) [10]. The growth in urban crime rate in Nigeria is one of the major social problems facing the country in recent time and inhibiting Nigeria economic growth strength, depression of political and social progress of a nation and a major factor for under development in general (Ahmed, 2010) [2]. This is because criminal activities had been identified as an indispensable factor that discourages both local and foreign investments, reduces the quality of life of its citizens and states, thus undermining democracy, the rule of law and the ability of the country to promote sustainable development and peace (Richard and Dean, 2001) [14]. Because of geometric progression of criminal activities in Nigeria, this study aims to examine the distribution of various crime, the degree of relationship between the different crimes, determine the crime that accounted for highest percentage of the total crimes in Osun and Ekiti state and to determine which of the acts constitute the major or principal components of the crimes as well as their effects on life in the study area.
2. Methodology
The data used in this study was collected from the Research and Planning Department, Ekiti State Police Headquarters and Osun State Police Headquarters. It consists of various types of criminal and civil cases adjudged in the state as well as the penalties levied against such offences. We explored some descriptive statistics of the data in order to explain the distribution of the crime rates over the last 10 years in Osun and Ekiti state. Also, the principal component analysis was carried out to determine the significant component of crimes in Osun and Ekiti state. Principal component analysis, or PCA, is a data analysis tool that is usually used to reduce the dimensionality (number of variables) of a large number of interrelated variables, while retaining as much of the information (variation) as possible (Jolliffe, 2002) [7]. It is used for transforming a set of related (correlated) variables into a set of unrelated (uncorrelated) variables that account for decreasing proportion proportions of the variation of the original observation (Rencher, 2002) [13].Principal component analysis can also be used to determine the overall criminality. When the first eigenvector shows approximately equal loadings on all variables then the first PC measures the overall crime rate.
2.1. Principal Component Procedures
Let X be a vector of  random variables, the main idea of the PC transformation is to look for a few
  derived variables that preserved most of the information given by the variance of the
  random variables (Jolliffe, 2002) [7]. Let the random vector
  have the covariance matrix
  with eigenvalues
  .Consider the linear combinations,
  of the element of
  , where
  is a vector of
  components
  Then,
Then, 
 The PC’s are those uncorrelated linear
  whose variances are as large as possible (Richard and Dean, 2002 [14]). In finding the PC’s we concentrate on the variances. The first step is to look for a linear combination
  with maximum variance, so that
 Next, look for a linear combination
  uncorrelated with
  having maximum variance, and so on, so that at the
  stage a linear combination
  is found that has maximum variance subject to being uncorrelated with
 The kth derived variable
  is the
  PC. Up to
  PC’s could be found, but we have to stop after the
  stage
stage  when most of the variation in X have been accounted for by
  PCs.• The variance of a PC is equal to the eigenvalue corresponding to that PC,
 • The total variance in a data set is equal to the total variance of PCs
 The data was standardized for the variables to be similar scale using a common standardization method of transforming all the data to have zero mean and unit standard deviation. For a random vector
  the corresponding standardized variables are
 In matrix notation
 where
where  is the diagonal standard deviation matrix. Thus,
  and
and  The PCs of
  can be obtained from eigenvectors of the correlation matrix
  of
of  . All over previous properties for
  are applied for the
  , so that the notation
  refers to the
  PC and
  refers to the eigenvalue- eigenvector pair. However, the quantities derived from
  are not the same from those derived from
  (Richard and Dean, 2001 [14]).The
  PC of the standardized variables
  with
with  , is given by
  so that,
 In this case,
  are the eigenvalue – eigenvector pairs for
  with
with 
2.2. Interpretation of Principal Component Model
The loading or the eigenvector  , is the importance of a measured variable for a given measure of the PC. When all elements are positive, the first component is a weighted average of the variables and is sometimes referred to as measure of overall crime rate. Likewise, the positive and negative coefficients in subsequent components may be regarded as type of crime component (Rencher, 2002 [13] and Louis, 1981 [9]). The plot of the first two and three loadings against each other enhances visual interpretation (Soren, 2006 [15]).The score is a measure of the importance of a PC for an observation. The new PC observation
  are obtained simply by substituting the original variables
  into the set of the first q PCs. This gives
 The plot of the first two or three PCs against each other enhances visual interpretation (Soren, 2006 [15]).The proportion of variance tells us the PC that best explained the original variables. A cumulative proportion of explained variance is a useful criterion for determining the number of components to be retained in the analysis. A scree plot provides a good representation of the ability of the PCs to explain in the data (Cattell, 1996 [3]).
3. Results and Discussion
This section presents the result and analysis of the data as well as discussion of results.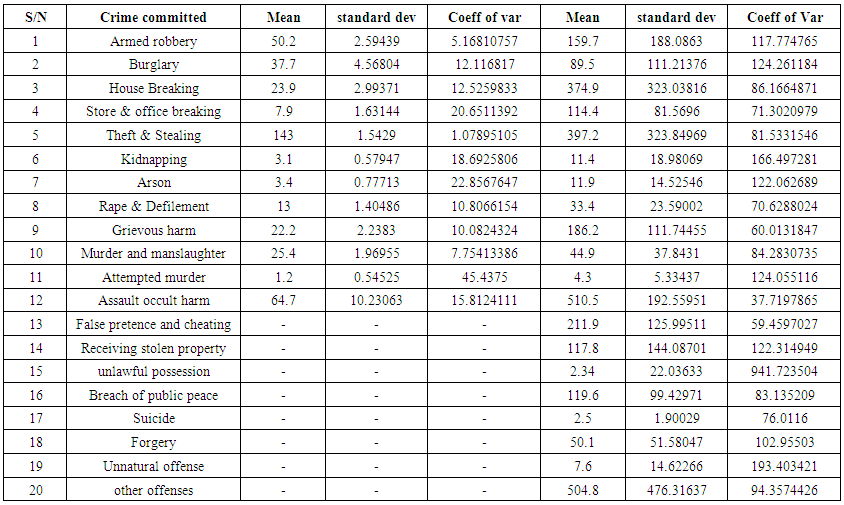 | Table 3.1. Descriptive Statistics of Crimes Committed in Ekiti and Osun States from 2005-2014 |
Criminal activities such as false pretense and cheating, receiving stolen property, unlawful possession, breach of public peace and other offences were not recorded in Ekiti State. Table (3.1) above revealed that in Ekiti State, crimes such as: theft and stealing, assault, armed robbery, burglary and stealing, OBT, murder and house breaking has the highest recorded rates than others. Similarly, in Osun sate, crimes such as; assault, other offences, theft and stealing, house breaking, false pretense and cheating, grievous harm and wounding, armed robbery, breach of public peace, receiving of stolen goods and store breaking has the highest recorded rates while other crimes such as burglary, forgery, murder, rape indecent assault, unlawful possession, arson, kidnapping and child stealing, attempted murder and suicide had the lowest recorded rates. This implies that majority of the crimes committed in the two states were against properties while fewer crimes were committed against persons. In general, the mean rate of committing a particular crime in Osun state is more than that of Ekiti State with higher variability. The pie charts and line graphs below present the crime rate in the two states under consideration.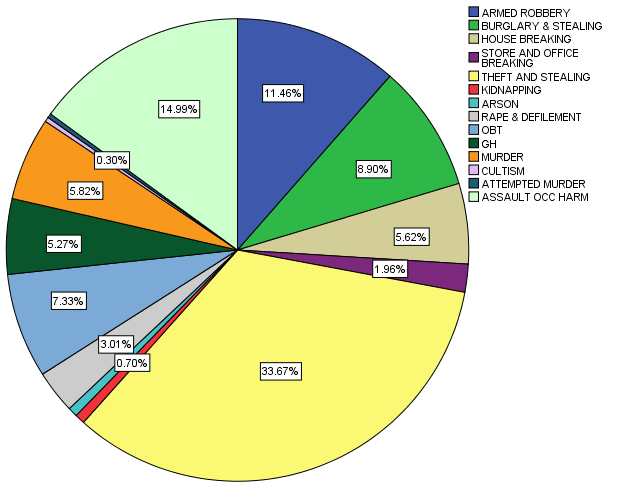 | Figure 3.1. Pie Chart of Major Crimes Committed in Ekiti State from 2005 to 2014 |
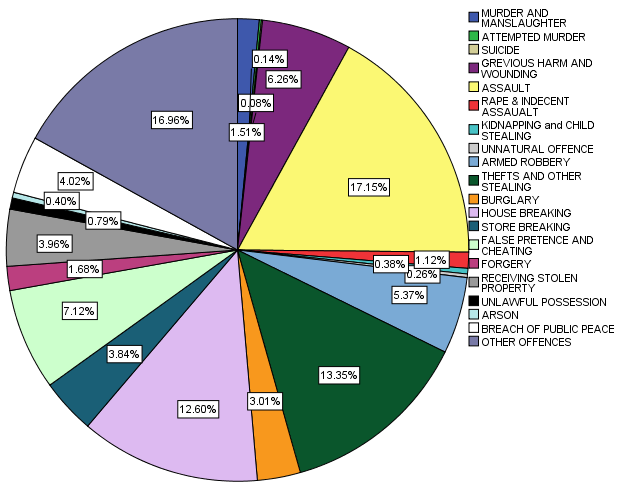 | Figure 3.2. Pie Chart of Major Crimes Committed in Osun State from 2005 to 2014 |
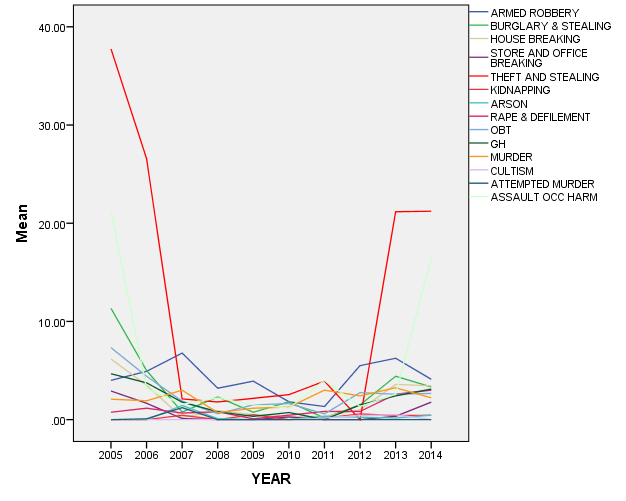 | Figure 3.3. Line Chart of Rate of Crime Committed per Year in Ekiti State |
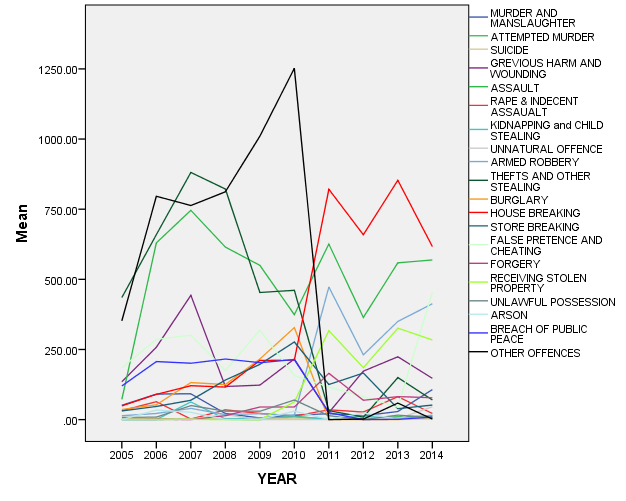 | Figure 3.4. Line Chart Showing the Rate of Crime Committed per Year in Osun State |
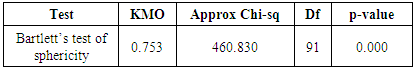
Table 3.2. Kaiser-Meyer-Olkin Measure of Sampling Adequacy and Bartlett’s Test of Sphericity
 |
| |
|
Interpretation: Kaiser (1970, 1975) as cited by Meyers, Perry et al., 2004 [12]) states that, a value of .70 is considered adequate. Since Bartlett's Test of Sphericity has an approx. chi-square that is significant at 91 degree of freedom with p – value < 0.05. Hence, we reject the null hypothesis of lack of sufficient correlation between the variables (i.e. they are orthogonal) and then consider the data used suitable for this type of investigation.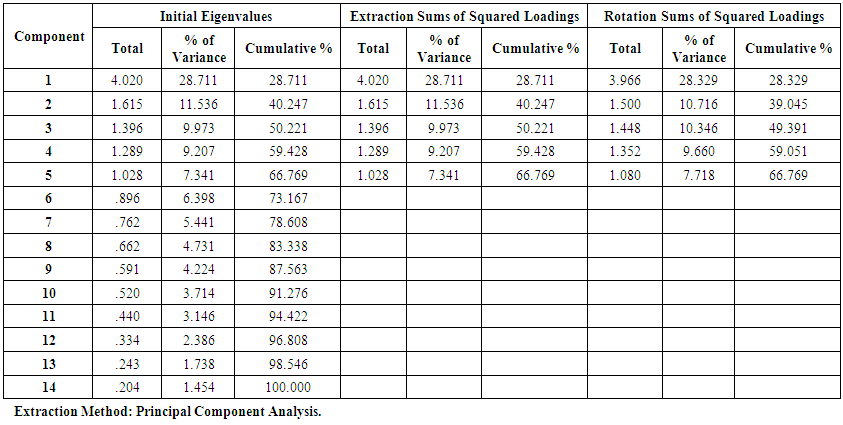 | Table 3.3. Total Variance Explained of Crime Rate in Ekiti State from 2005-2014 |
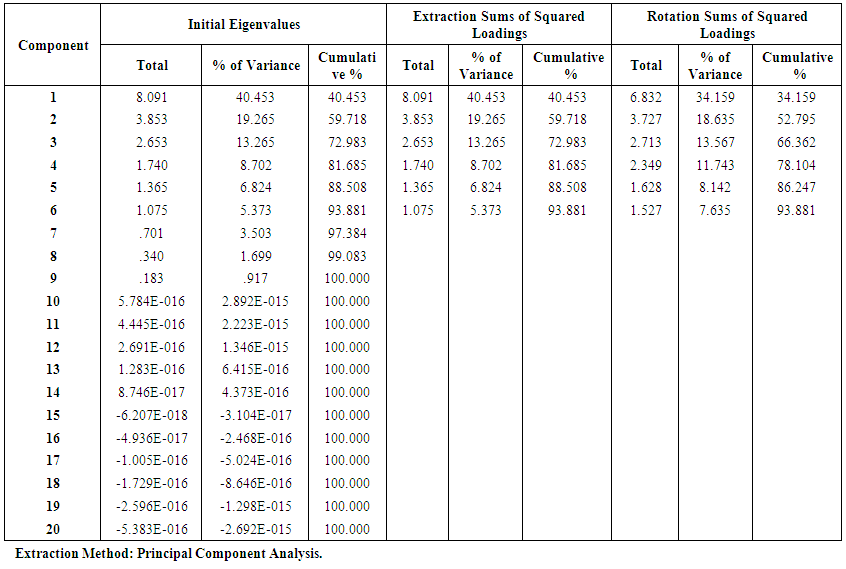 | Table 3.4. Total Variance Explained of Crime Rate in Osun State from 2005-2014 |
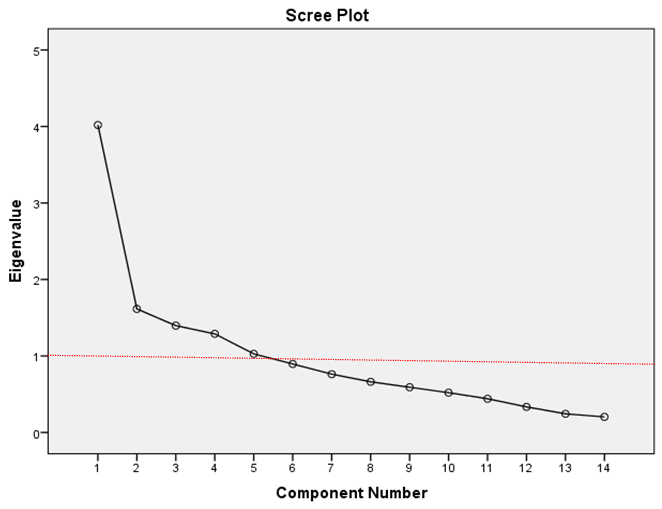 | Figure 3.5. The First Five Components Retained in Ekiti State |
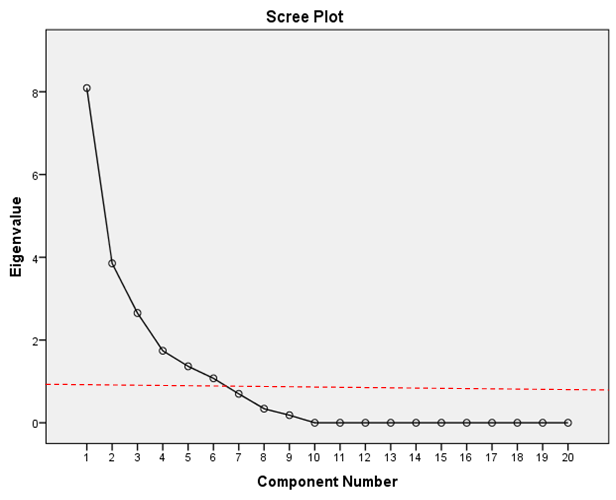 | Figure 3.6. The First Five Components Retained in Osun State |
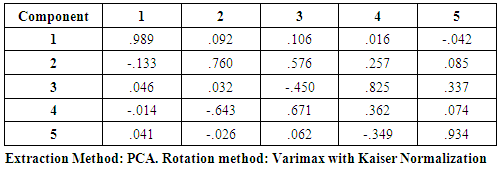
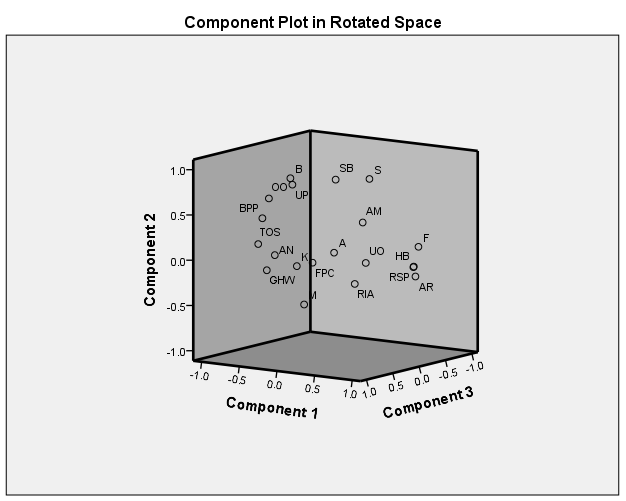
Interpretation: Table (3.3) above revealed that the total of first five eigenvalues were greater than one, whereas Kaiser Criterion (K1 Rule) opined that only components with an eigenvalue greater than 1 should be retained while another multivariate rule states that we should only retain the components whose value is greater than or equals to the average (mean) of all the eigenvalues which is usually 1. Considering the eigenvalue-one criterion in table 3.3, 3.4 and the Scree plot in figure 3.5 and 3.6 above, the first 5 (Principal Components) PCs are retained which explain 66.769% of the total variability in Ekiti State while the first six PCs in Osun State give 93.881% account of the total variability.Table 3.5 and figure 3.7 below present the five principal components which explains a larger variance component out of all 14 crimes committed, which are; theft and stealing, attempted murder, rape and defilement, kidnapping and arson. The position of the points (crime committed) shows more variability in the Z axis than the X and Y axis.Table 3.5. Component Transformation matrix of crime rate in Ekiti State from 2005-2014
 |
| |
|
 | Figure 3.7. Component Plot in Rotated Space Showing the Variance Components of the Crime Rate in Ekiti from 2005-2014 |
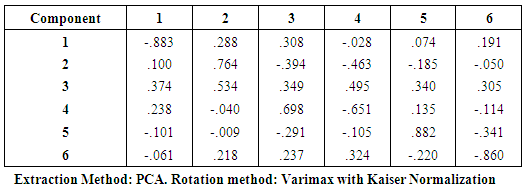
Table 3.6. Component Transformation matrix of crime rate in Osun state from 2005-2014
 |
| |
|
 | Figure 3.8. Component Plot in Rotated Space Showing the Variance Components of the Crime Rate in Osun State from 2005-2014 |
Table 3.6 and figure 3.8 above presents the principal components which explains a larger variance component out of all 20 crimes committed in Osun State, which are; house breaking, other offences, grievous harm and wounding, unnatural offences, assault, kidnapping/child stealing. The position of the points (crime committed) shows more variability in the Y and Z axis than the X axis.
4. Conclusions
Based on the observed data and statistical analysis carried out, majority of the crimes committed in Ekiti State and Osun State were against property while fewer crimes were committed against person. For instance, theft and stealing has the highest recorded rates in Ekiti state while assault has the highest recorded rates in Osun state. In addition, theft and stealing, store and office breaking, grievous harm, house breaking, assault, burglary and stealing were on rampage for the observed ten years in Ekiti state while house breaking, kidnapping and child stealing and assault were on rampage for the covered period of ten years in Osun state. In conclusion, the comparison of crime rate in the two states revealed that Osun State has the highest crime rate than Ekiti state. Hence, needs for Nigeria government at all levels to provide maximum security services that will protect both life and properties of its citizens not only to Ekiti and Osun state but entire country as a whole. Provision of free education for the poor, youth empowerment and employment opportunity that will create job opportunity for the idle people.
References
| [1] | Ackernan, W.W and Murray A.T (2004). Assessing spatial patterns of crime in Lina, Ohio, U.S.A Cities, Vol 21, No 5, p 423-437, 2004. Published by Elsevier Ltd. Printed in Great Britain. |
| [2] | Ahmed, Y.A. (2010). Trend and Pattern of Urban Crime in Southwestern Nigeria, Unpublished PhD Thesis, University of Ilorin, Nigeria. |
| [3] | Cattell, R.B (1996). The Scree test for the number of factors, Multivariate Behavioral Research, 1,245-276. |
| [4] | Danbazau, A.B (2007). Criminology Justice. 2nd edition. Ibadan: Spectrum Books Limited. |
| [5] | Durkhein, E. (1933). The Division of Labour in Society. Macmillan, New York. |
| [6] | Fajemirokun, F., Adewale, O., Idowu, T., Oyewusi, A., and Maiyegun, B. (2006). A GIS Approach to Crime Mapping and Management in Nigeria: A case study of Victoria Island Lagos. www.Oicf.org. |
| [7] | Jolliffe, I. T. (2002). Principal Component Analysis. 2nd edition, Springer-Verlag, New York. CBN Journal of Applied Statistics Vol. 3 No.2 49. |
| [8] | Laerd Statistics; How to perform a principal component analysis (PCA) in SPSS. |
| [9] | Louis,S., Cookie, W.S., Louis, A.Z.. and Sheldon, R. E. (1981). Human Response to Social problems. The Dorsey Press, Illinois. |
| [10] | Nigeria Police Report (June, 2017). nigeriapolicewtch.com/reportcrime, npf.gov.ng/security-tips-terrorism.php, retrieved August 3rd, 2017. |
| [11] | Patrick Obahiagbon (2012). “How are the Mighty Fallen”, Nigeria House of Representative Summit, December 8, 2012. |
| [12] | Perry, R. H., Charlotte, B., Isabella, M. and Bob, C. (2004). SPSS Explained, ISBN: 0-203-67627-0, Routledge, Taylor & Francis Group, London & New York. |
| [13] | Rencher, A.C. (2002) Methods of Multivariate Analysis. 2nd edition, John Wiley & Son, New York. |
| [14] | Richard, A. J. and Dean, W. W. (2001). Applied Multivariate Statistical Analysis. 3rd edition, Prentice-hall, New Dehli. |
| [15] | Soren, H. (2006). Example of Multivariate Analysis in R – Principal Component Analysis (PCA). |
| [16] | Tanimu, B. (2006). Convicts View of the Criminal Justice System in Nigeria, in the National Question and Some Selected Topical Issues on Nigeria, pp. 294-309. |

 Abstract
 Reference
 Full-Text PDF
 Full-text HTML