-
Paper Information
- Paper Submission
-
Journal Information
- About This Journal
- Editorial Board
- Current Issue
- Archive
- Author Guidelines
- Contact Us
American Journal of Mathematics and Statistics
p-ISSN: 2162-948X e-ISSN: 2162-8475
2018; 8(3): 65-69
doi:10.5923/j.ajms.20180803.02

Application of the Logit Hazard Model as an Approach for Ranking of Banks Fragility Status in Kenya
 Abstract
 Reference
 Full-Text PDF
 Full-text HTML
Mugotitsa B., Orwa G., Mung’atu J.
Department of Statistics and Actuarial Sciences, Jomo Kenyatta University of Agriculture and Technology, Nairobi, Kenya
Correspondence to: Mugotitsa B., Department of Statistics and Actuarial Sciences, Jomo Kenyatta University of Agriculture and Technology, Nairobi, Kenya.
| Email: |  |
Copyright © 2018 The Author(s). Published by Scientific & Academic Publishing.
This work is licensed under the Creative Commons Attribution International License (CC BY).
http://creativecommons.org/licenses/by/4.0/

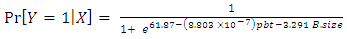
The focus of this study is to fit a model that ranks commercial banks in Kenya, according to their specific financial status. The second focus of this study is to use dimensionally reduced financial distress determinants. Secondary data in audited bank financial statements from the Nairobi Stocks Exchange (NSE) report 2016/2017, and other statements available from bank websites used for the fitting of the model. In total, 17 banks were sampled. 10 explanatory variables were used to analyze the linkage between bank specific factors and economic factors majorly associated with bank fragility. The data obtained was cleaned, coded and the required statistical outputs generated using R for Windows statistical package. Principal component analysis (PCA) was employed in dimension reduction. A multiple logit regression model was fitted to the collected data. The most significant determinants of bank fragility were found to be bank size and profit before tax. Using the derived logit model, it was determined that Kenya Commercial Bank (KCB), Equity Bank and Cooperative Bank were the top three banks in terms of financial strength. Their probabilities of staying up were 1.000, 0.999 and 0.985 respectively. The bottoms two were Chase Bank (0.125) and Imperial Bank (0.037). These two were under receivership during this study.
Keywords: Logit model, Principal component analysis, Bank fragility, Correlation analysis
Cite this paper: Mugotitsa B., Orwa G., Mung’atu J., Application of the Logit Hazard Model as an Approach for Ranking of Banks Fragility Status in Kenya, American Journal of Mathematics and Statistics, Vol. 8 No. 3, 2018, pp. 65-69. doi: 10.5923/j.ajms.20180803.02.
Article Outline
1. Introduction
- BackgroundBanking system fragility has impaired the functioning of the payment system thus leading to various challenges including high interest rates, high inflation rates, bank fraud, banks being put under receivership and economic stagnation [2, 8, 12]. This research will point out the major determinants of banking system fragility in Kenya and the level of their influence to rank commercial banks under study, a topic which related studies largely overlooked in the current academic literature which mainly focus on stability of individual banks or individual countries banking systems [1, 18]. We refer to banking system fragility as a situation where there is present vulnerability of a financial system to a financial crisis. But the attainment of the banking benefits has been jeopardized because both private and commercial banks have been vulnerable to financial distress, with private banks being on the lead. Substantial numbers of banks have failed, mainly because of various fragility determinants. Poor banking sector quality has its roots in the informational problems which afflict financial markets, and which are at their most acute in developing countries, including Kenya. The field of business prediction comprises bankruptcy prediction, firm failure prediction and financial distress prediction [4]. As the name suggests, it involves developing models that attempt to predict the financial failure of a business before it actually happens [6, 17]. The vulnerability of the banking sector associated with a weak macroeconomic environment is characterized by a large government deficit, a large trade deficit, high inflation, excessively high real interest rates, depreciated exchange rate and slow GDP growth. These are among the main factors that increased the problems in the banking sector and led to the emergence of the banking crisis in Kenya [15]. Theoretical ModelsTheoretical models can be examined in three categories: the first, second and third-generation models [5]. The first-generation models focus on the role of weak fundamentals in the policy of government as a triggering factor of currency crises. The fiscal deficit, growth of money supply, current accounts balances and level of foreign exchange. This were the main features of the crisis in the early 1980s in Latin America [7, 13, 14]. The second-generation currency crises models offered no critical developments to fundamental macroeconomic variables; instead, it provided model of self-fulfilled speculative attacks in foreign exchange markets. In this model, market expectations directly influence macroeconomic policy decisions in a rational direction. During this crisis period in Africa countries inflation rates, government deficit and unemployment were low and credit was high. Hence, this crisis in Africa revealed the need for a new framework that integrates weaknesses in the banking sector into the early generation models. This new framework, which takes into account the weaknesses of the financial sector, is called the third-generation models or the term twin crises, which emphasize the occurrence of both banking and currency crises [20].
2. Material and Methods
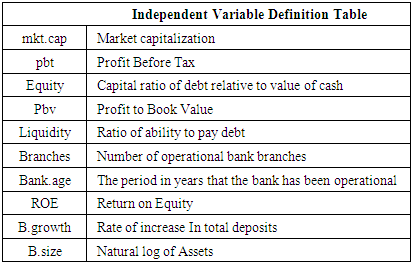
- This research attempted to identify the determinants that have more effect on the overall bank financial status and use this determinants to rank commercial banks in Kenya according to their financial fragility status. DataSecondary data in audited bank financial statements from the Nairobi Stocks Exchange (NSE) report 2016/2017 financial year, and other statements available from bank websites were used. 12 banks were part of the research, 10 of which were listed under NSE sampled. Each had a 5 year financial reporting period 2011-2016 except for Barclays which had the 2010 statement available. Out of these, 9 were private and 3 public (KCB, Coop Bank and NBK). Further, data from two recently failed banks, not listed in the NSE was obtained from the specific banks. 10 explanatory variables were used to analyse the linkage between bank specific factors and economic factors majorly associated with bank fragility. The data obtained was cleaned, coded and the required statistical outputs generated using R for Windows statistical package. Independent Variables
|
 | (1) |
|
3. Results and Discussion
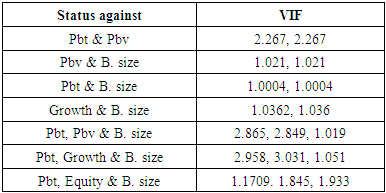
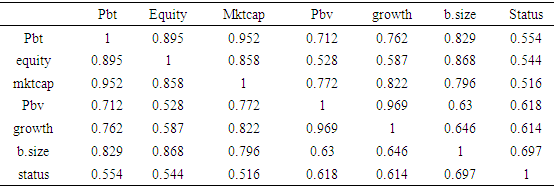
- Correlation analysisCorrelation analysis between the dependent variable and independent ones was carried out with pairwise scatter plots generated for all main variables. Some of the variables were found not to be related to the rest of the variables and with bank status. These include number of branches, bank age, return on equity and liquidity ratio.The plots below (Figure 1 and Table 3) show the inter relationships between variables whose correlations were found to be strongest. The respective correlation analysis gave the following results.
 | Figure 1. Correlation Analysis |
|
|
 has a standard logistic distribution:
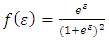 | (2) |
 | (3) |
4. Conclusions
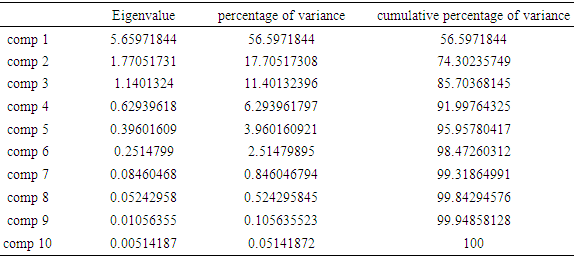
- The main objective of this study was to fit a logit model to bank fragility and use the model to rank commercial banks in under study. A successful attempt was made to fit the logistic regression model to the data, which could be used to predict bank status given a few variables. Finally, after testing the model with bank data, the model was verified. This was then used to rank the banks under consideration in terms of their financial status. The study was also set to perform PCA for dimensional reduction of data used in constructing the bank fragility model. This was carried out successfuly. It was noted that out of the ten initial variables, some were not significant contributors in the determination of bank fragility. These included bank age, number of branches, liquidity ratio, and Return on Equity.The scree plots (figure 2) together with the rotation matrix show the contributions of variables towards the important principal components. The first three contribute to 86% of variation caused by the selected variables. fewer variables were selected for modelling to avoid over-fitting, due to multicollinearity. Variables were discriminated logically and a lean and effective model fit.
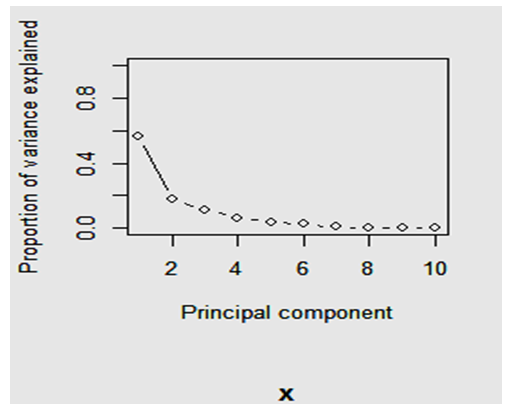 | Figure 2. Scree plot from PCA |
ACKNOWLEDGEMENTS
- I acknowledge the Nairobi Stock Exchange Directorate for making available the Banks Financial Statemnts and the Individual banks database where the individual statements of financial records were also accessed.