-
Paper Information
- Paper Submission
-
Journal Information
- About This Journal
- Editorial Board
- Current Issue
- Archive
- Author Guidelines
- Contact Us
American Journal of Mathematics and Statistics
p-ISSN: 2162-948X e-ISSN: 2162-8475
2018; 8(3): 57-64
doi:10.5923/j.ajms.20180803.01

Modelling of Cancer Patients: An Accelerated Model with Composite Distribution
 Abstract
 Reference
 Full-Text PDF
 Full-text HTML
Bandana Sharma
Associate Professor, Cotton University, Guwahati, Assam
Correspondence to: Bandana Sharma, Associate Professor, Cotton University, Guwahati, Assam.
| Email: |  |
Copyright © 2018 The Author(s). Published by Scientific & Academic Publishing.
This work is licensed under the Creative Commons Attribution International License (CC BY).
http://creativecommons.org/licenses/by/4.0/

A cancer is always referred to by the stage at the time of its diagnosis. The progression of the disease cancer can be specified on the basis of area of infection under the disease. The area of infection for any type of cancer can be detected by using different methods of impression by the Doctors. Once the body of a normal person is invaded by cancer, the biological process of that person gets interrupted and starts behaving in a very unnatural way i.e., the life of the cancer patient gets automatically accelerated and goes through a sequence of transitions viz., from a cancer free stage to a stage with accelerated cancer situation and then to a stage to be followed by death (Kay, 1986). The disease has a chronic or stable phase, which is followed by transition to an accelerated phase (Klein et. al, 1984). Modeling is an experimental approach to investigate the complex biological systems of cancer for better understanding of the disease (Renee et.al, 2016). Over the years, various stochastic models were developed for insights into biological transitions of cancer through cell mutations (Jonathan et. al, 2014). With the accelerated behavior of the life of the cancer patient, in this paper an accelerated model of cancer patients by using Composite distribution under Power Rule Model has been developed along with prediction of the various survival rates of cancer patients as compared to normal persons.
Keywords: Accelerated behavior of cancer patients, Stochastic process, Composite distribution, Power rule model
Cite this paper: Bandana Sharma, Modelling of Cancer Patients: An Accelerated Model with Composite Distribution, American Journal of Mathematics and Statistics, Vol. 8 No. 3, 2018, pp. 57-64. doi: 10.5923/j.ajms.20180803.01.
Article Outline
1. Introduction
- Cancer is the leading cause of death in the economically developed countries and the second leading cause of death in the developing countries. According to WHO’s health report, the estimated death worldwide due to cancer was 8.3 million in 2010 and in 2015 it was almost 9 million. In 2015, out of the total deaths due to cancer, 5.1 million were men and 3.9 million were female.A cancer is always referred to by the stage at the time of diagnosis. It has been observed that survival of cancer patients mainly depends on the area of infection. In order to develop an effective cure and control of cancer, basic understanding of the mechanisms leading to the cancerous cells from normal cells is essential and highly desirable. Due to some unknown reasons, the cells of a particular part of the body started multiplying in a disorderly and uncontrolled manner. The cancerous cells grow beyond their usual boundaries and then started spreading through various pathways like local infiltration in the neighborhood of the organ of origin, lymphatic system or the blood vessels, leading to secondary deposits or metastases.Classification of clinical extent of cancer is of great importance in the planning of treatment and for better understanding of the disease. Cancers can be classified either in accordance to the affected types of cells and organs of the body or in terms of spreading of cancerous cells to different organs of the body viz.,(a) Classification of cancers in accordance to the affected types of cells and organs: (i) Carcinoma is the most common type of cancer arises in the epithelium i.e. in the layers of cells covering the body’s surface or the lining of internal organs and various glands.(ii) Sarcoma originates in the supporting or connective tissues like bones, muscles and blood vessels.(iii) Myeloma starts in the plasma of bone marrow.(iv) Leukemia starts in the cells of lymph system i.e. the body’s circulatory network for filtering body’s impurities.(v) Lymphoma originates at the lymphatic system.(vi) Mixed types are of combination of two or more components of different origins of cancer. (b) Classification of cancers in terms of spreading of cancerous cells to different organs:This type of classification of cancers can be well understood from figure 1 (National Cancer Control Programmes, 2002):
 | Figure 1. Different phases of cancer development |
2. Model
- By keeping the cancer patient under constant observation in the interval (0,t],
 and on basis of the transition graph in Fig 2, a stochastic process {X (t), t ≥ 0} with state space S = { 0, 1, 2, 3, 4, 5 } can be defined (Biswas, 1993; Medhi, 1998) withX (t) = 0, if the patient is in the disease stage known as healthy cells
  = 1, if the patient is in the disease stage known as dysplasia
 = 2, if the patient is in the disease stage known as carcinoma in situ.
 = 3, if the patient is in the disease stage known as localized invasive cancer.
  = 4, if the patient is in the disease stage known as regional lymph node involvement.
  = 5, if the patient is in the disease stage known as distant metastases.Here, state 5 is the absorbing stage as there is no return for a cancer patient from this stage.The corresponding transition matrix is given by
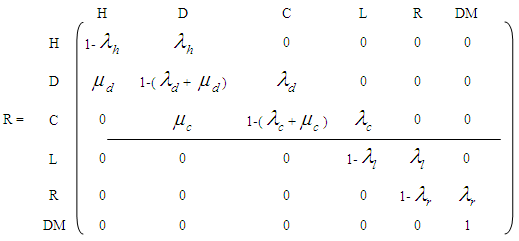 where
where 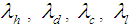 and
and  are the failure rates of transitions from states H, D, C, L and R respectively and
  ,
,  are the cure rates at states D and C respectively. For the sake of simplicity, the study has been restricted to the analysis of cancer patients in the stages viz., carcinoma in situ, localized invasive cancer, regional lymph node involvement and distant metastases only.
 3. Assumptions
- Following are the assumptions that are made for the proposed model(1) Patients with unconfirmed cases of cancer are to be discarded. (2) Patients belonging to the adult group (Barlow and Proschan, 1975) are considered to have lifetime with constant hazard rate
 .(3) The life of a normal person gets accelerated with the detection of cancer under Power rule model (Mann et al., 1973).(4) The ailments score other than cancer at the time of invasive cancer detection is
  . This
  varies from patient to patient and
  .(5) Severity of the disease is to be determined by the area of infection
  in state i
  Now, in accordance with the assumption (3), the hazard rate for accelerated life of a cancer patient becomes
 (6) In state 2, hazard rate
  remains proportional to the area of infection i.e.,
 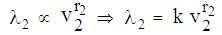 (7) In state 3, the area of infection becomes proportional to time i.e.,
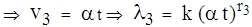 (8) In state 4, the area of infection further becomes proportional to time i.e.,
 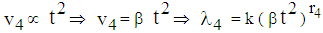 (9) The proportionality of infection to time is assumed to be k, which is a constant for all the states.Hence under the above mentioned assumptions, {X (t), t ≥ 0} will be a stochastic process with state space S = {2, 3, 4, 5} where the transition probabilities of the process are of the types i → i +1 (i = 2, 3, 4). The corresponding transition matrix
  for i = 2,3,4,5 and j = 2,3,4,5 is given by
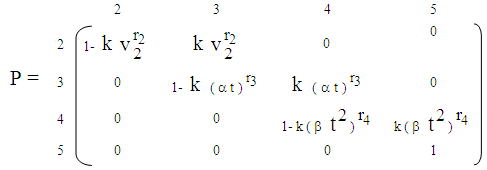
4. Probabilistic Analysis
- The lifetime distribution of a cancer patient is being denoted by
 as
as 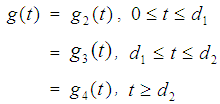 provided
 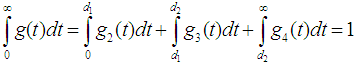 where
where  = p.d.f of a cancer patient to transits from state i to i +1 (i = 2,3,4),
  so that
 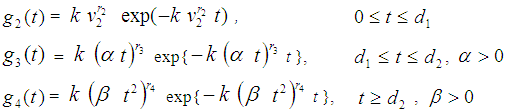 Here the time interval
  is divided into three parts so that we can identify two-partition parameters
  and
and  such that the patient remains in stage 2 for
  , in stage 3 for
  and in stage 4 for
  . The role of partition parameters seems to be of great importance to cancer patients because a patient transits from one state to another state depending upon the area of infection and the patient’s physical capabilities to fight the disease. Here, partition parameters are function of parameters of the p.d.f of the lifetime distribution of the cancer patients. Now
  may be defined as a composite distribution (Mann et al., 1973) viz.,Here
 = Survival function at state
  corresponding to the density
  . With the hazard rates of the transitions from i to i+1
 as
as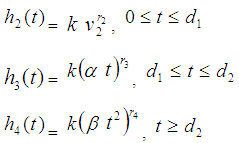 Case 1: When t =
  then
then 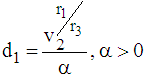 Case 2: When t =
  then
then 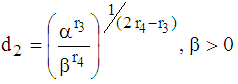 Let m be the mean lifetime of a cancer patient such that
  , where
  is the mean stay time in state i
  . Now
. Now  ,
,  and
and  are calculated as follows:When
  , we have
 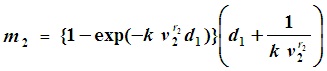 When
When  , we have
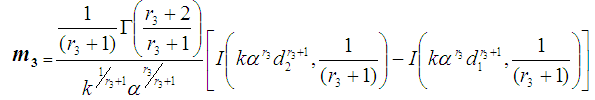 where
where 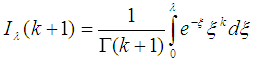 , is the Incomplete Gamma function.When
  , We have
  So that mean life time in one state becomes
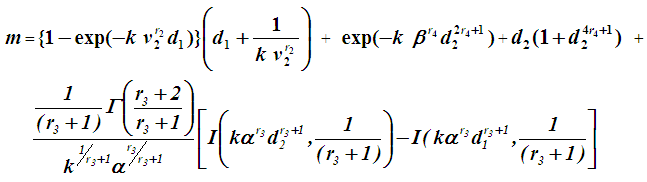
5. Sampling Scheme
- Under the sampling scheme to estimate the characteristics viz., average lifetime, survival probabilities etc. the following assumptions are made:(i) N numbers of patients under incurable phase are taken for study. The patients are medically examined and their stages of cancer are determined.(ii) Once a patient transits from state i to i +1
 , observation on the patient is terminated and his future development regarding the disease cancer is ignored. The time epoch at which the patient reaches the state i +1 from state i is recorded.(iii) The experiment is continued till the transitions of all the N patients to the next states are recorded.(iv)
  , the number of patients under state i
  and
and  , the time point at which the
  patient transits to state i +1 from state i
  . The corresponding three random samples of sizes
  ,
, ,
, are
are  ,
,  and
and  respectively. The time epochs
  are random variables from
  for
for  By using the method of maximum likelihood the values of the parameters were calculated separately for states 2, 3 and 4 as
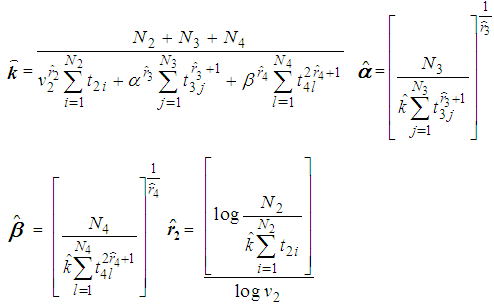 No close form expressions are available for
  and
and  but can be obtained by solving the above expressions explicitly and numerically. It can be observed that all the M.L.Es of the unknown parameters
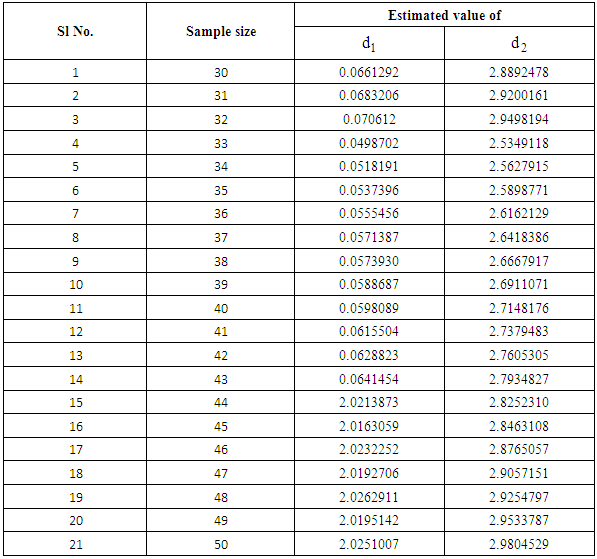
 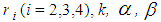 are consistent estimators and are also asymptotically normal (Mann et al., 1973). The estimated values are being verified by using simulated data as only truncated cancer data are available. It has been observed with simulated data as shown in table 1 and figure 1, that the estimated ailments score other than cancer increases as the patient goes to a higher state from a lower state:
|
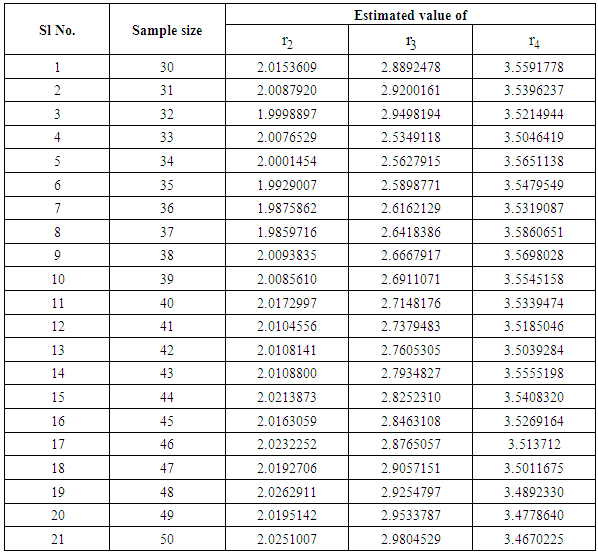
 | Figure 1. Graph on ailment scores at different states of cancer |
 and
and  it is clear that the patient remains in stage 2 for a very short period of time whereas it may remain in stage 3 for some time with proper treatment and care .
|
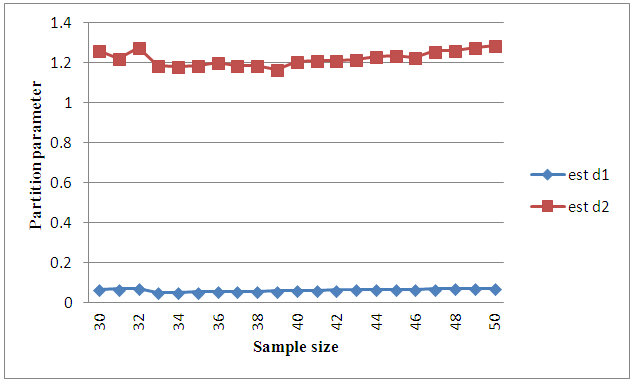 | Figure 2. Graph on partition parameters |
6. Discussion
- While explaining the lifetime of a cancer patient, it may be observed that lifetime distribution of the patient does not remain same in the whole period of the disease. The distribution functions of life times with respect to the area of infection of a cancer patient at different stages of cancer are different and hence it becomes quite difficult to estimate the existing parameters viz., reliability, mean lifetime etc. Recently there has been a great deal of studies on the analysis of survival data on cancer patients. In this paper effort was made to have an insight to the accelerated behavior of cancer patients through transitions from one state to another state of cancer by means of partition parameters. All the parametric constants used in the model were estimated and mean life time of cancer patients was calculated. Through this model it has been observed that estimated ailments scores increases as the patient goes to higher state from the lower state.
7. Conclusions
- It has been already mentioned that life of a normal person gets quite complicated with the invasion of cancer in the body. For this complication it becomes difficult to estimate the different parameters like average lifetime, survival probabilities. Nature of Composite distribution reduces this complexity to some extent through partition parameters. The estimators obtained in the paper thus may be used to obtain the mean lifetime and survival probabilities of cancer patients at different stages. The estimates of the partition parameters d1 and d2 will give the transition time of a cancer patient from stage 2 to stage 3 and from stage 3 to stage 4 respectively which may help the doctors to continue treatment procedure effectively to prolong the survival rates of cancer patients.With growing techniques the survival rate of cancer has increased and so it becomes important to contribute even the smallest help in this field favoring the survival rate. For cancer patients survival rates are considered to be the main criteria to measure the impact of treatment on cancer control.