-
Paper Information
- Paper Submission
-
Journal Information
- About This Journal
- Editorial Board
- Current Issue
- Archive
- Author Guidelines
- Contact Us
American Journal of Mathematics and Statistics
p-ISSN: 2162-948X e-ISSN: 2162-8475
2018; 8(2): 36-49
doi:10.5923/j.ajms.20180802.02

Using Fuzzy Logic or Probability Approach in Revising Unknown, Invalid, or Missing Data Points: Application to Shrimp Data Files in the Gulf of Mexico, Years 2005 and 2006
 Abstract
 Reference
 Full-Text PDF
 Full-text HTML
Morteza Marzjarani
National Marine Fisheries Service, Southeast Fisheries Science Center, Galveston Laboratory, USA
Correspondence to: Morteza Marzjarani , National Marine Fisheries Service, Southeast Fisheries Science Center, Galveston Laboratory, USA.
| Email: |  |
Copyright © 2018 Scientific & Academic Publishing. All Rights Reserved.
This work is licensed under the Creative Commons Attribution International License (CC BY).
http://creativecommons.org/licenses/by/4.0/

Probability and fuzzy logic have played important roles in data analysis, prediction, and estimation. Fuzzy logic can help to solve complex problems using approximations and allows users to analyze incomplete and imprecise data sets. Fishery data in general contain missing data points (see for example, [1, 2] or shrimp data files, Gulf of Mexico, 1984 to present). It is of great importance to estimate such points accurately using reliable scientific oriented techniques. The purpose of this study is to introduce the theories of probability and fuzzy logic especially the latter to the shrimp data files for estimating missing/invalid/unknown data points. In the article, these theories along with the statistical mode and multiple imputation were deployed to revise such data points. As an application, shrimp data in the Gulf of Mexico collected by the National Marine Fisheries Service for the years 2005 and 2006 were selected due to the existence of unknown, invalid, or missing values in the species, fathomzone, and subarea fields and the similarity in missing patterns. The methods mentioned above were deployed to revise these fields. The probability approach deployed a discrete multivariate probability distribution developed based on the shrimp data files 2000-2001, statistical mode, and imputation. The fuzzy logic approach also deployed a special form of a Gaussian membership function based on 2000-2001 data files, statistical mode, and imputation. In general, analyses showed that both theories estimated the species, fathomzone, and subarea in a satisfactory manner. However, it was concluded that the fuzzy logic showed more robustness when a large number of data points were to be estimated.
Keywords: Estimation, Modeling, Probablity, Fuzzy logic
Cite this paper: Morteza Marzjarani , Using Fuzzy Logic or Probability Approach in Revising Unknown, Invalid, or Missing Data Points: Application to Shrimp Data Files in the Gulf of Mexico, Years 2005 and 2006, American Journal of Mathematics and Statistics, Vol. 8 No. 2, 2018, pp. 36-49. doi: 10.5923/j.ajms.20180802.02.
Article Outline
1. Introduction
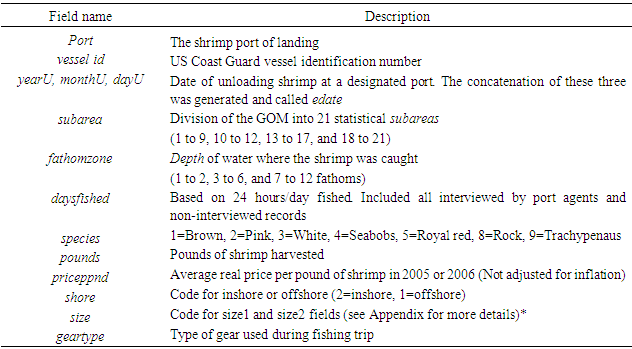
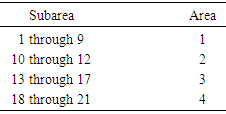
- Fuzzy logic is an extension of Aristotelian or Boolean logic (true or false) where partial membership is allowed through membership functions. The idea was formulated by [3, 4], a professor of computer science at Berkley and it became known as the fuzzy logic. Since then, this theory has been addressed by many authors [5-11], for example.Classical or Boolean logic is good for some applications but does not provide flexibilities needed in some other cases. Fuzzy logic on the other hand, allows solving complex problems using approximations. In some situations, minor approximations could be helpful in reducing the degree of difficulty of the problem. Imagine that you want to park your car in a parking spot. How often do you park your car exactly in the middle of the spot? Theoretically, you are expected to park your car exactly in the middle. However, in practice, a slightly parked car to the left or the right would be acceptable. Therefore, you use this approximation to reduce the degree of difficulty in parking your car. Terms like “heavy”, “light”, and “dark” are called fuzzy terms. You turn on the light in the room if you feel it is too dark. The next person come in and turns off the light since he/she feels that there is enough light in the room.The fuzzy logic has been used in many areas of science and engineering. Japan heavily makes the use of fuzzy logic in its technology [5]. For example, the Sendai subway speedo train was the first to make the use of fuzzy logic [5, 12]. The fuzzy logic is somewhat similar to the probability theory, but the two theories are not the same. Probability theory takes a conservative approach and does not allow approximations. However, as mentioned above, some problems can be solved in a reasonable time if some approximations are used. In situations like these, fuzzy logic can be very helpful. For handling missing data, [13] used a statistical method known as “Imputation.” For invalid or unknown data points, one could assume that these points are missing and estimate them using the above method. However, when dealing with categorical variables, alternative methods should be deployed [14, 15]. In this research, two of these alternatives were presented and applied to estimate some missing, invalid, or unknown data points in shrimp data files 2005 and 2006. The first alternative was a probabilistic approach, which was built on some variables of interest. The second alternative used here was known as fuzzy logic. In addition, since neither theory was capable of estimating all the missing, invalid, or unknown data points, for the purpose of completing the estimation process, the statistical mode, and another probabilistic approach, namely multiple imputation were used to handle the remaining such data points.MethodThe National Marine Fisheries Service (NMFS) is responsible for shrimp effort estimation in the Gulf of Mexico (GOM). NMFS port agents and state trip tickets record the daily operations and shrimp production of the commercial fisheries fleet operating within the boundaries of the U.S. GOM [16]. For assigning fishing activity to a specific geographical location, scientists have subdivided the continental shelf of U.S. Gulf of Mexico into 21 statistical subareas [17]. Subareas 1-9 represent areas off the west coast of Florida, 10-12 represent Alabama/Mississippi, 13-17 represent Louisiana, and 18-21 are designated to Texas (Figure 1). These subareas are further subdivided into 5-fathom depth increments from the shoreline out to 50 fathoms [18]. These divisions are used by port agents and the state trip ticket system to assign the location of catches and fishing effort expended by the shrimp fleet on a trip-by-trip basis [16]. The shrimp data files included several fields of interest to this study. Table 1 gives the fields used in this research and the corresponding descriptions.
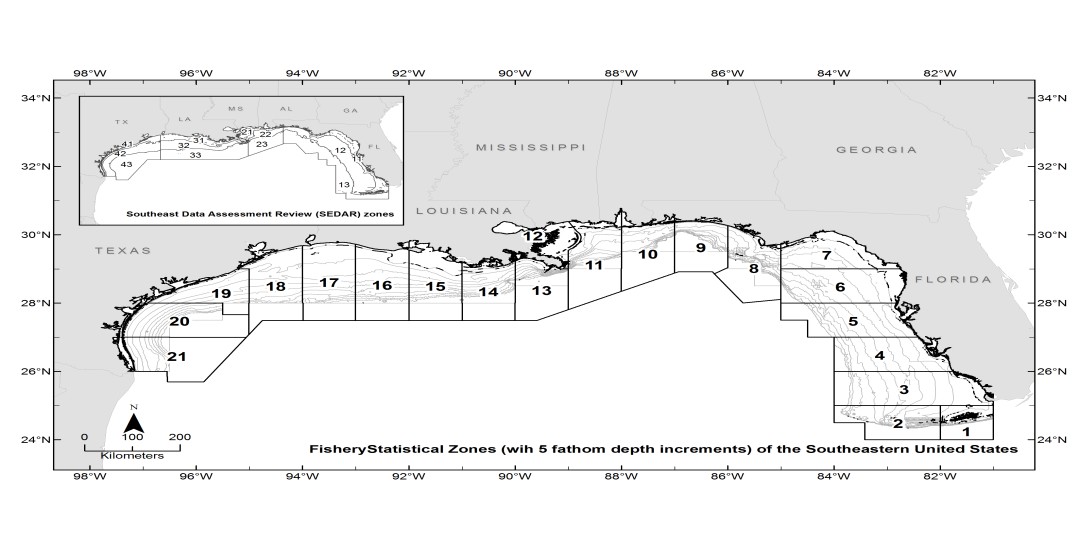 | Figure 1. The Gulf of Mexico is divided into twenty-one statistical subareas (1-21) as shown |
|
|
|
|
|
|
1.1. Fuzzy Logic Approach
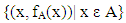
- Unlike classical logic, the most interesting and important feature of fuzzy logic is its ability to handle incomplete, uncertain, imprecise, or vague data sets. In fuzzy logic, the membership function is a continuous function and defines the magnitude of the classical membership (member or not a member). A fuzzy set is a set of elements where the boundaries cannot be defined clearly. To each member of such a set, a membership value is assigned which shows the degree to which the member belongs to the set.More formally, if A is a fuzzy set and fA is the associated membership function, then fA is a mapping from A to the set [0, 1]. That is,
 | (1) |
 | (2) |
 | (3) |
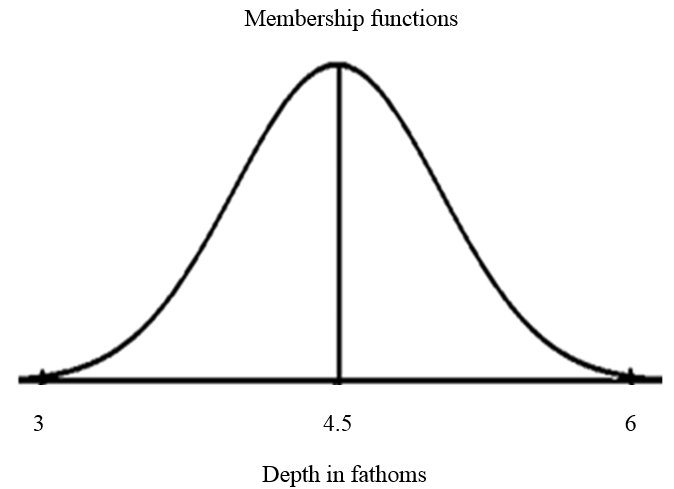 | Figure 2. An example of fuzzy membership function |
 | (4) |
 | (5) |
1.2. Probability Approach
- Similar to the case of fuzzy logic explained above, the variables monthU, port, species, size, and geartype were selected through the backward elimination method mentioned earlier for generating the multivariate probability distributions for the fathomzone, subarea, and species (with the exception of species where this variable was the dependent variable). Again, it is important to note that the choice of independent variables is completely up to the reader and can be modified using alternative selection method (s). These probability distributions then were used to determine the most likely values for the invalid, unknown or missing data points in these fields. To develop the probability distributions for either fathomzone or subarea, suppose Ai, i=1, 2, 3,… represent all possible values for variables monthU, port, species, size, and geartype. Define the corresponding random variable Xi, i=1, 2, 3, … as follows:
 | (6) |
 | (7) |
 | (8) |
1.3. Handling Species
- Throughout this article, software packages such as MS Excel (1), SAS (1), and R (1) were utilized. The multivariate probability and the fuzzy logic approaches described earlier were developed based on the shrimp files 2000 and 2001 and then used to estimate as many as missing species (0 or greater than 3 as stated previously) as possible in shrimp data files 2005 and 2006. For the remaining missing data points in this field, the statistical modes of the existing data points in the data files 2005 and 2006 for each triple (vessel, edate, port) in the species field were calculated and used to revise as many data points as possible. The argument for determining mode based on the triple (vessel, edate, port) was the fact that this triple was used to reorganize records in the shrimp data files as trips [13]. All the remaining missing species (if any) were estimated using a monotone imputation method [20].
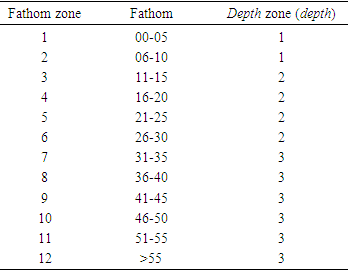
1.4. Handling Fathomzone
- The multivariate probability distributions mentioned above were developed based on the shrimp data files 2000-2001. As mentioned earlier, Table 4 represents the interval boundaries for the fathomzone field (middle column). This field involves measurements and prone to errors. Even, with the use of electronic devices such possibility of errors exists. For example, a slight move or shake of the vessel by nature or otherwise, would cause the electronic device to misread a measurement. As appeared in [17], there are possibilities of errors in delineating statistical subareas and depth contour and possible errors in the planimeter measurements. Therefore, the fuzzy logic seemed an appropriate alternative method for revising an unknown value (99) in the fathomzone field. Upon the application of either probability or fuzzy logic, the modes of the existing fathomzone values based on the triple (vessel, edate, port) in 2005 and 2006 shrimp files were used to replace the unknown fathomzone data points where possible. In either case of probability or fuzzy logic, all the remaining unknown fathomzone data points (if any) were estimated using a monotone imputation method [13]. For a couple of reasons the imputation method was deployed last. First, the variables in question were categorical and the use of imputation in such case (s) should be minimized [14, 15]. Second, the imputation method if applied, would have estimated all the missing data points with no need for an additional estimation method (s).
1.5. Handling Subarea
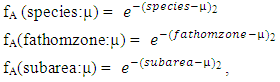
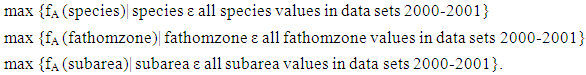
- The only issue with this field was a limited number of invalid records with 0 in the subarea field (see Table 2). Similar to the case of unknown fathomzone values, the probabilities generated via the multivariate distribution for subarea, fuzzy membership functions in the fuzzy logic approach, the mode of the existing subarea data points, and imputation (if either of the latter two needed) were used to replace the 0’s in this field. Upon the completion of the steps listed above, the species, subarea, and fathomzone fields in each shrimp 2005 and 2006 data file satisfied the following relations.
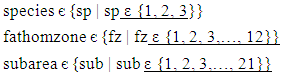 | (9) |
|
2. Analysis and Results
- To measure the effectiveness of the probability and fuzzy logic approaches in revising unknown, invalid, or missing data points in the shrimp data files, analysis was performed on the species, fathomzone, and subarea in the shrimp 2005 and 2006 data files.
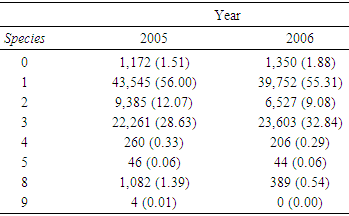
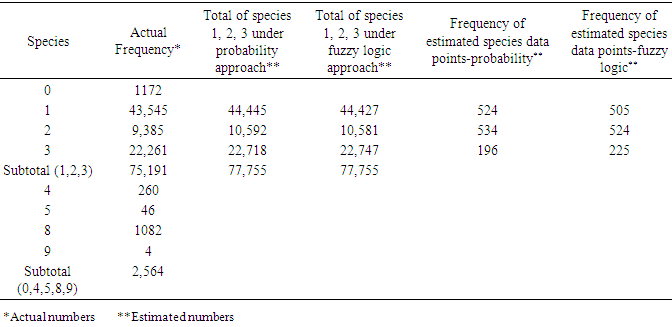
2.1. Species
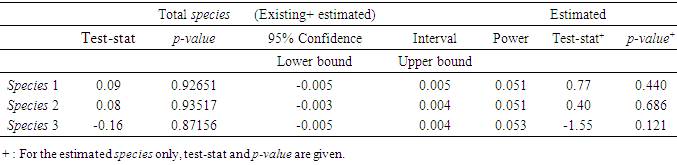
- As mentioned earlier, the probability distribution, the fuzzy logic, and statistical mode or imputation (where needed) were used to estimate the missing data points in the species field. Tables 8 through 11 display some statistics of interest to this study regarding this variable. The hypothesis:
 | (10) |
|
|
|
|
2.2. Fathomzone
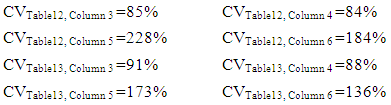
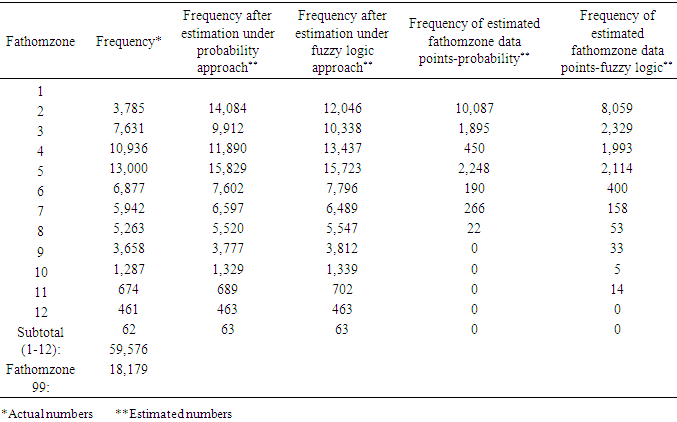
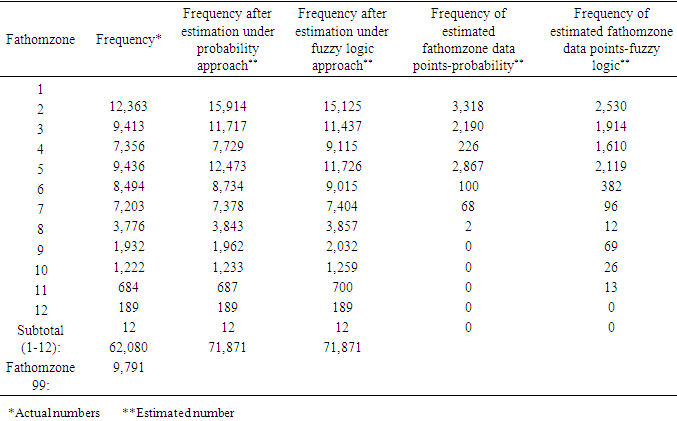
- The number of unknown fathomzone codes (99) was relatively high (over 23%) compared to the number of invalid subarea or missing species data points. The coefficient of variation (CV) for columns 3 and 4 in Tables 12 and 13 were computed and shown below.
 | (11) |
|
|
|

|
|
|
|
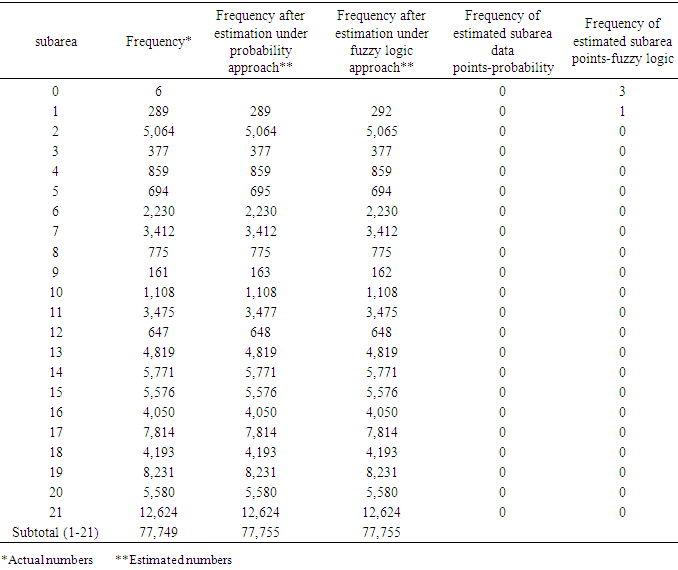
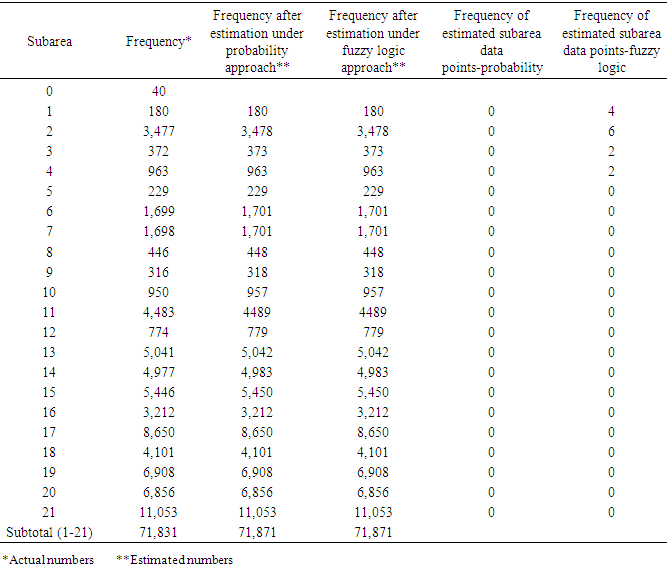
2.3. Subarea
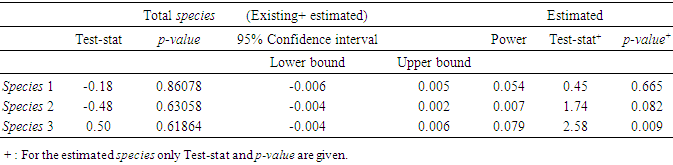
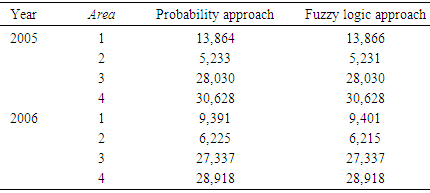
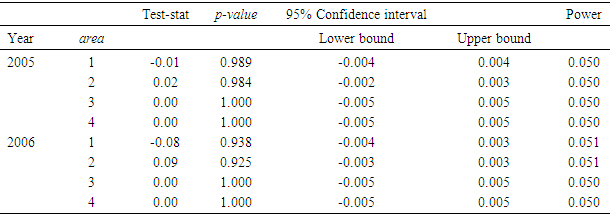
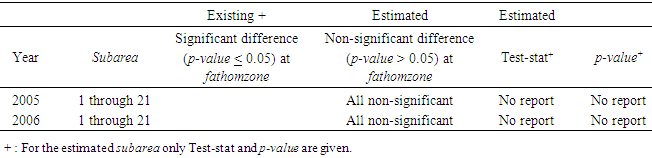
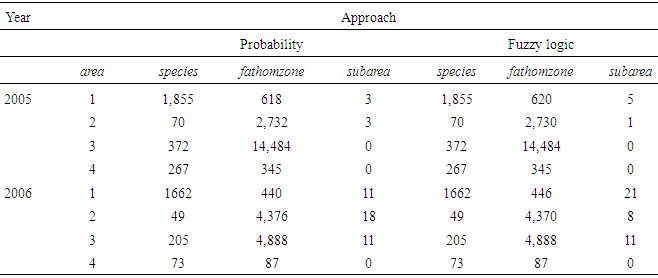
- Analysis was performed on the subarea and the results are listed in Tables 19 through 21. Here, the number of invalid data points was the lowest compared to the variables species and fathomzone. As expected (due low a low percentage) and displayed in Table 21, in either 2005 or 2006 data file, there were no significant differences between the corresponding proportions.
|
|
|
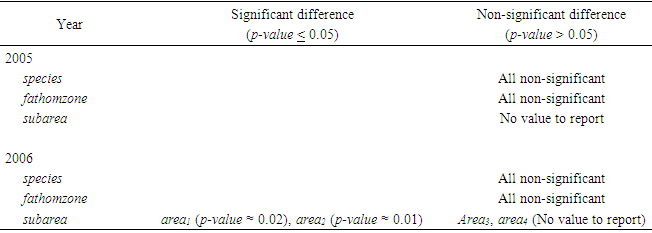
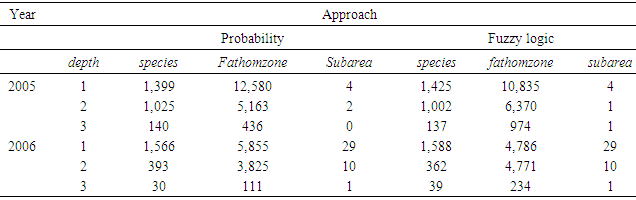
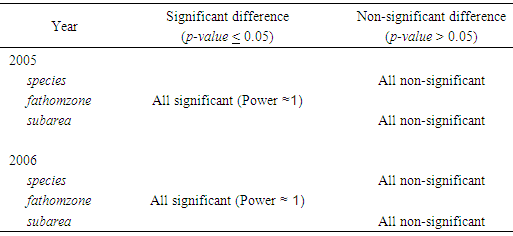
2.4. Summary
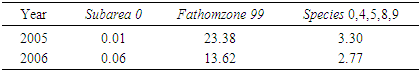
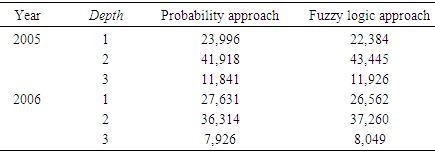
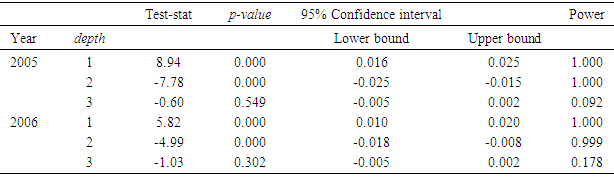
- Tables 22 through 25 display the overall distributions of missing, unknown, or invalid species, fathomzone, and subarea allocated to depth and area along with the corresponding analyses. In Table 23, the only significant difference was observed in 2006 in the subarea field at area1 and area2. In Table 25, the impact of fathomzone was significant meaning that the allocations of estimated fathomzone to the variable depth were different. It can be concluded that from this perspective, the two theories performed differently.
|
|
|
|
3. Discussion and Concluding Remarks
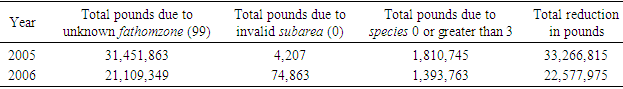
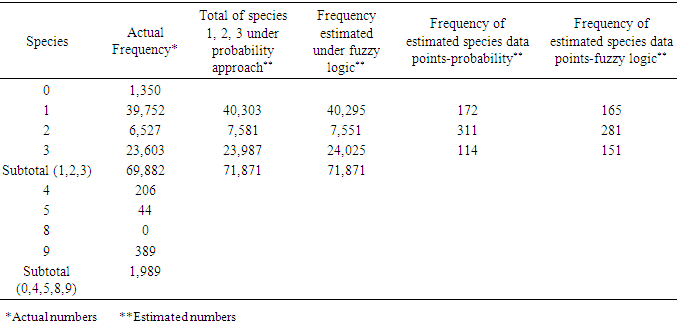
- The purpose of this paper was to propose two approaches to the fishery data files when there was a need to revise or estimate missing, invalid, or unknown data points in these data files. Clearly, these points play a significant role in the estimation/prediction and care must be taken to assure that a correct method (s) is used. The question of finding the most suitable method is an open-ended one and research for finding a proper and advanced method (s) is necessary. The issue becomes more complex and more challenging (hopefully more accurate) as the more advanced techniques are deployed. All possibilities must be explored, and care must be taken when selecting a method for estimating such points. In this article, the probability and fuzzy logic theories were considered for handling this important issue.The study focused on the shrimp 2005-2006 data files and the species 1, 2, 3, due to their high percentage compared to the other species. To maintain all the records in the shrimp data files 2005 and 2006, it was assumed that all species data points in these files except 1, 2, and 3 were missing but keeping the corresponding records in the files. Removing such points would have reduced the number of records in these data files, which in turn, would have had an impact on any application of such files such as shrimp effort estimation. Table 6 displays the reduction in pounds if such records were eliminated from the 2005-2006 shrimp data files. For estimating the probability or fuzzy logic membership functions, the species 0 or greater than 3 in the data files 2000-2001 were removed still providing a very large sample (276,956 records) and the required distributions were determined based on these records in the data files 2000-2001. The issues with fathomzone and subarea in the 2005 and 2006 shrimp data files were the presence of invalid subarea (0) and unknown fathomzone data points (99). The data files shrimp 2000 and 2001 seemed comparable with these files with the advantage of having no subarea (0) data points in the subarea filed and no code (99) in the fathomzone field. These two files were selected as the basis for generating the multivariate probability distributions for species, fathomzone, and subarea and then used to estimate/revise the missing/invalid/unknown data points in these fields. The readers might choose alternative files for this purpose.Tables 8 through 11 address the frequencies of species (original versus after allocation) and the allocation of this variable to the variables area and depth. As displayed in Tables 9 and 11, the proportions assigned under the fuzzy logic or the probability approach in both cases of total species (existing and estimated), and estimated species were relatively close (that is, the differences were not statistically significant). Tables 12 through 18 address the distributions and allocations of the estimated fathomzone data points. As displayed in Tables 14, 16, and 18, the two approaches performed somewhat differently. In Table 14, the results of the tests showed a significant difference in proportions at the lower depths (5 and below) when estimated and existing data points were added. Considering estimated data points only, the proportions were different with no comparisons at depths 11 and 12 in both years 2005 and 2006 due to the 0 frequencies. This implied that the two approaches performed somewhat differently. This might be due to the large number of unknown data points in the field fathomzone (Tables 2 or 3). Looking at the CVs given in (11), one could conclude that the fuzzy logic distributed the estimated data points more consistently. This is consistent with the fact that the probability approach is precise, allows no approximation, and requires precise and compete data sets. Fuzzy logic on the other hand, is more flexible in that respect and is built upon the assumption of being able to handle imprecise and incomplete data sets. As mentioned earlier, analyses showed some sensitivities with respect to the number of data points to be estimated. In the case of species with a moderate number of points to be estimated, the two theories performed equivalently (Tables 9 and 11). However, in handling a large number of data points to be estimated, we observed some discrepancies between the two approaches (Tables 14, 16, and 18). Tables 19 through 21 address the estimated data points in the field subarea. The analysis showed that the two approaches performed equivalently when applied to the total proportions (existing and estimated). However, due to a very low number of invalid data points in this field, it was difficult to compare the performances of the two theories in this case and it was not something one can heavily emphasize or draw any definite conclusions from these tables. Tossing a fair coin does not necessarily produce the expected 50% heads or invalidates the expected frequency. Overall, for a relatively large number of data points to be estimated, fuzzy logic seems to respond reasonably well. Tables 22 through 25 provide the allocations of missing/invalid/unknown data points to the variables area and depth. These two variables play a role in models dealing with shrimp effort estimation [13] or similar applications. In Table 23, one can observe the equivalency of the approaches with a minor discrepancy regarding the subarea field even though such conclusions for this field are not conclusive due to a very low number of invalid data points in this field. In Table 25, the proportions of fathomzone allocated to the variable depth were all statistically different. Along with the probability and fuzzy logic, two important other statistical methods were deployed in this research, that is, statistical mode and imputation. Statistical mode is a measure of location and represents the most frequent observation in a given data set. Here, following the applications of the probability theory and/or fuzzy logic, this measure was deployed to estimate additional data points. As appeared in [13], a trip was formed based on the triple (vessel id, edate, port). A real example was a case where a vessel was at the port say, A, on May 2, 2005, four times recorded at fathomzone 1 and once at fathomzone 99 (unknown). From a statistical perspective, it was reasonable to assume that the code 99 was recorded in error and very likely the vessel was at the fathomzone 1. Unfortunately, none of the three methods, the probability, the fuzzy logic and the statistical mode were able to estimate all the missing/invalid/unknown data points. Since the main objective of the research was to compare the probability and fuzzy theories, these two implemented first followed by the statistical mode and imputation to complete the estimation of missing/invalid/unknown data points. For the obvious reason, imputation was used last. To do otherwise, imputation would have estimated any and all the missing/invalid/unknown data points. The probability theory was expected to be more sensitive towards the number of data points to be estimated losing robustness as the number of such data points increased. Fuzzy logic also displayed the same, but with less severity. Under a reasonable number of data points to be estimated and roughly speaking, both theories of fuzzy logic and probability performed equivalently in this research. The probability approach would be recommended for its accuracy and precision for cases where a low or moderate number of data points are to be estimated (See Table 4 and discussion on the CVs). For a very large number of such data points, perhaps fuzzy logic is an option due to its flexibility towards handling imprecise or incomplete data sets. For brevity purposes and to avoid extending the scope of this paper further, the issue of “large” was not explored beyond this point in this article. One possibility is to conduct a simulation study and determine the cutoff point for a number of missing data points to be called “large.”Previously, [13] used multiple imputation in handling missing data points where covariates used in the estimation process were continuous. In this article, it was possible to use this method and estimate all the missing, invalid, or unknown data points. The concern about this approach was the fact that the covariates representing these missing data points were all categorical in nature. The issue and concern about applying the imputation method to the categorical variables was addressed in [14, 15]. In this article, the application of this approach was limited to the cases where the other methods would not help with estimating the missing data points.Both the probability and fuzzy logic have been used in research in one form or another. For example, [21] used the probability theory in their book to address the estimation of parameters in a fishery stock assessment model (Chapter III, pages 157-434). Authors in [22] used fuzzy logic for estimating the parameters of weight-length relationship. In addition, authors in [23] used fuzzy logic to build an expert system to estimate intrinsic extinction vulnerabilities of marine fishes to fishing. Here, these theories were deployed from a different perspective that is, estimating missing/invalid/unknown data points in shrimp data sets. The ideas are wide open and it is entirely up to the readers to modify these approaches. Up to now, no “perfect” method has been proposed for handling missing data points. The imputation method has shown to be a good candidate, but the issue with categorical variables and rounding presents a problem to the researchers. Unfortunately, in a research work of this nature, it is difficult to say that one method is superior to another. Comparisons are all relative, but not absolute. There are always advantages and disadvantages in any approach we select. For example, the probability approach is accurate, precise and allows no approximation. The probability distribution once defined is unique and offers no flexibility in that respect. Fuzzy logic on the other hand, uses approximation and offers flexibility in defining/selecting a proper membership function. The methods deployed here have been chosen out of many possibilities and by no means have they constituted the best set of options. It is up to the reader to modify the selection of independent variables used to estimate species, fathomzone, or subarea or to replace them with some alternatives. Another possibility is to use a different method (s) for selecting the predictors, which might suggest different sets for different response variables.The methods for estimating the missing data points as written in (5) and (8), were intentionally defined to be similar so that if there were any differences , it would not have been due to the selection of membership functions. In other words, any discrepancy would mainly have been due to the difference between the two theories and again, not completely due to the selection of fuzzy membership. In conclusion, the focus of this article was the introduction of the probability and fuzzy logic theories in estimating unknown/invalid/missing data points when dealing with categorical variables. Although the application was limited to the shrimp data, it could easily be extended and applied to other data sets where categorical data need to be estimated.
ACKNOWLEDGEMENTS
- The author would like to thank Mr. James Primrose of NMFS for providing the data sets for this research and Dr. Ryan Kitts-Jensen of NMFS, and an anonymous referee for their excellent editorial comments.
Disclaimer
- The scientific results and conclusions, as well as any views or opinions expressed herein, are those of the author and do not necessarily reflect those of NOAA or the Department of Commerce.
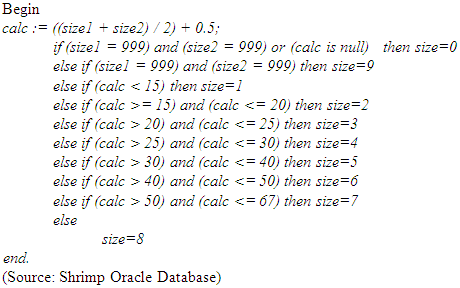
Appendix
- Each original shrimp data file contains two fields called size1 and size2. These variables represent the lower and upper bound for the shrimp size range. The following algorithm was used to calculate the size variable included in this analysis.