Ramya D.1, Devaarul S.2
1Department of Statistics, P.S.G. College of Arts and Science, Coimbatore & A Part Time Research Scholar at Bharathiar University, India
2Department of Statistics, Government Arts College, Coimbatore, India
Correspondence to: Devaarul S., Department of Statistics, Government Arts College, Coimbatore, India.
| Email: |  |
Copyright © 2018 Scientific & Academic Publishing. All Rights Reserved.
This work is licensed under the Creative Commons Attribution International License (CC BY).
http://creativecommons.org/licenses/by/4.0/

Abstract
Variable Sampling Plans play a vital role in product control measures through inspection of incoming lots. In the sampling plan literature, the measurable quality characteristic is assumed to be normally distributed. But in few circumstances the assumption are being violated due to target deviation of the process. To off-set the disadvantages, variable sampling plans are developed for a non-normal process. In this paper sampling plans are designed and developed for a heavy tailed production process by utilizing Lomax distribution. Since skewness and kurtosis contributes more to this distribution, sampling plans are designed based on such measures. The parameters of the sampling plans are determined once the heavy tail measures skewness and kurtosis are known. The Lomax variable sampling plans are designed through AQL & LQL and also with minimum angle technique. Tables are constructed for easy selection of Lomax variable sampling plans.
Keywords:
Variable sampling plans, Non normal process, Lomax distribution, Heavy tailed, Minimum angle
Cite this paper: Ramya D., Devaarul S., Design and Development of Variable Sampling Plans for Non-Normal Heavy Tailed Lomax Process, American Journal of Mathematics and Statistics, Vol. 8 No. 1, 2018, pp. 13-21. doi: 10.5923/j.ajms.20180801.03.
1. Introduction
In acceptance sampling generally a sample is drawn from a lot for inspection, and in most of the cases the population follows a normal distribution. But this need not necessarily be true, so there could also be non-normal populations in the production process. In industries for variable quality characteristics the sample units may be measured on a continuous scale. This paper focuses specifically on Variable sampling plans based on non -normal process for a heavy tailed population. Here the methodology involved to deal with non -normal process has been identified from Zimmer and Burr [1]. The main objective of this paper is that for a heavy tailed non normal distribution such as Lomax distribution, if the skewness and kurtosis of the distribution is determined then the corresponding sampling parameters n and k can be obtained. Another objective is that when the angle is minimized, then the abstract OC curve tends to ideal OC curve. Hence by using skewness and kurtosis as a new approach this paper has been developed. Many authors have contributed towards variable sampling plans and non-normal distributions. Lomax [2] has introduced this distribution in the analysis of business failure data. Bander Al-Zahrani and Mashail Al-Harbi [3] considered the estimation problem of the probability S = P(Y < X) for Lomax distribution based on general progressive censored data. Artur J. Lemonte and Gauss M. Cordeiro [4] proposed a new five-parameter continuous distribution, called McDonald Lomax distribution that extends the Lomax distribution and some other distributions. Bassiouny, Abdo and Shahen [5] proposed a new generalization of Lomax distribution called Exponential Lomax distribution. Takagi [6] designed unknown-sigma sampling plans based on non-normal distributions such as Gamma, Weibull and Burr distributions. Devaarul [7] developed mixed samplings plans and minimum tangent angle sampling plans. Devaarul and Jemmy Joyce [8] have developed reliability sampling plans based on minimum angle technique. Soundararajan & Christina [9] have developed Single sampling variables plans based on the minimum angle. Jemmy Joyce, Devaarul and Rebecca Edna [10] proposed mixed sampling plans based on the tangent angle, AQL and LQL. Owen [11] presented one-sided specifications for variable sampling plans based on normal distribution.Variable sampling plans are generally preferred over attribute sampling plans for the reduction in the size of the samples. The parameters of variable sampling plans, namely n and k are obtained with respect to the distribution used. Here the variable sampling plan for non-normal process is determined. The underlying distribution in this study is Lomax distribution. This distribution is a heavy tailed distribution. Moreover a heavy tailed distribution has a large and a positive kurtosis. In this paper contribution has been made in developing variable sampling plans for non-normal production process. One of the heavy tailed, Lomax distribution, has been used for designing purpose. The efficiency measures for the Lomax variable sampling plans such as operating characteristic function, ASN and AOQ have been provided for the first time. Tables are constructed to facilitate easy selection of the sampling plans.
2. Formulation of the Sampling Plans
Let the random variable, ‘x’ is said to follow Lomax distribution.The probability density function (pdf) is defined as: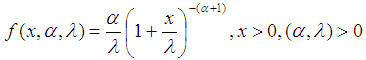 | (1) |
The cumulative distribution function (cdf) of Lomax distribution is given by,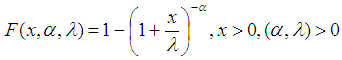 | (2) |
where λ is the scale parameter and α is the shape parameter. Let,n = sample size = sample meanσ = standard deviationU = upper specification limitK = acceptance constantλ = scale parameterα = shape parameterM = Mean of Lomax distributionS = Standard deviation of Lomax distributionβ1 = Skewnessβ2 = Kurtosisp = proportion nonconformingPa(p) = probability of acceptancetanθ = angle of the tangent
2.1. Measures of the Lomax Distribution
The various measures of the heavy tailed Lomax distribution are expressed as follows:
2.1.1. Mean
The mean of Lomax distribution is denoted by M 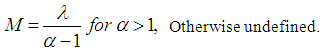 | (3) |
2.1.2. Variance
The variance of Lomax distribution is denoted by S2 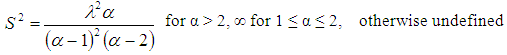 | (4) |
2.1.3. Skewness
The skewness of Lomax distribution is denoted by β1 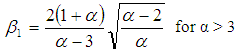 | (5) |
2.1.4. Kurtosis
The kurtosis of Lomax distribution is denoted by β2
2.2. Operating Procedure of the Lomax Variable Sampling Plans
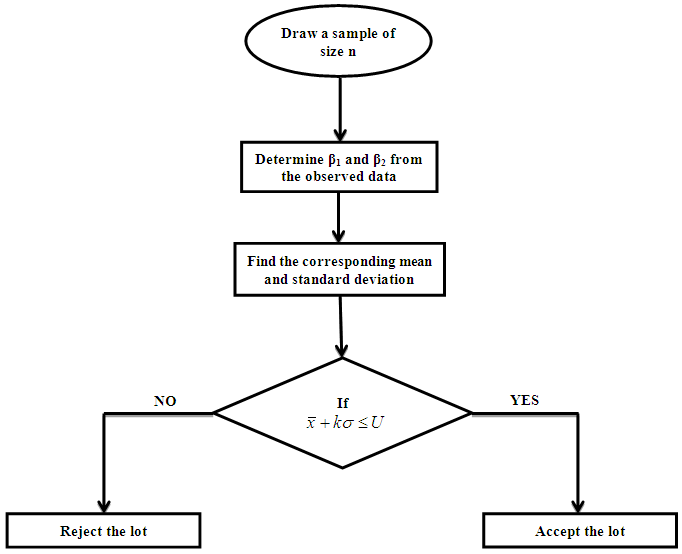
Step 1: The scale parameter λ and shape parameter α of Lomax distribution are determined using past experience in the production process.Step 2: Draw a random sample of n items say x1, x2, x3 …..xn from a lot of size N.Step 3: Determine the Skewness (β1) and Kurtosis (β2) from the observed data.Step 4: Now obtain the corresponding mean M and standard deviation S.Step 5: If  , accept the lot or otherwise reject it. (where
  is the sample mean and σ is known). Step 6: In case of unknown σ, if
  , accept the lot or otherwise reject it.
2.3. Flow Diagram for Lomax Variable Sampling Plans
2.4. Measures of the Lomax Variable Sampling Plans
2.4.1. Operating Characteristic Function
The probability of accepting the lot of a sampling plan is given by the Operating Characteristic (OC) function. Let X follows Lomax distribution with parameters (α,λ).The Lot will be accepted if the sample mean 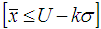 The probability of acceptance of the lot is defined as
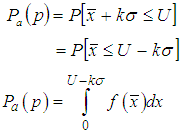 | (7) |
The mean and variance of the Lomax distribution is given by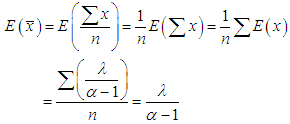 | (8) |
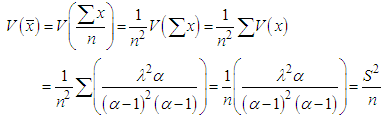 | (9) |
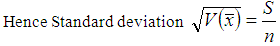 | (10) |
2.4.2. Average Sample Number (ASN)
The Average Sample Number of this sampling plan is n.(i.e.,) E(n) = n.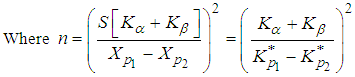 | (11) |
2.4.3. Average Outgoing Quality (AOQ)
The Average Outgoing Quality is given by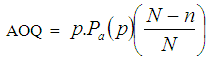 | (12) |
3. Designing Lomax VSP Indexed through AQL and LQL
3.1. Lomax VSP for Known Standard Deviation
This study is limited to heavy tailed Lomax distribution and to single specification limit only. Here the variable single sampling plans are developed based on the upper specification limit. The operating procedure for these plans for known standard σ is given in section 2.2. According to the need of the industries similar sampling plans can be developed with Lower speciciation limit. Let Fx(x;μ,σ) be the underlying distribution function of x with mean μ and variance σ2 that is it gives the probability that X≤x. the acceptable quality level, AQL = p1, is defined by, | (13) |
Where μ1 is the mean of the Lomax distribution, which results in the acceptable quality. Also: | (14) |
where α is the Type I error, the probability of rejecting the acceptable quality. (The α used here should not be confused with the shape parameter of the Lomax distribution). The LQL = p2, the Limiting Quality Level, is defined by: | (15) |
Where μ2 is the mean of the Lomax distribution which results in rejectable quality. Also: | (16) |
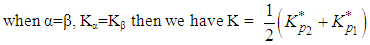
where β is the Type II error, the probability of accepting the rejectable quality.When the underlying distribution is normal in variable sampling plans, it is necessary to determine the standard normal variate Z* in order to find the parameters n and k. Similarly for non-normal distribution it is necessary to determine Kp* for determining the parameters. Hence the mean and variance of non-normal Lomax distribution is used for obtaining the standard deviate Kp*Now to relocate and scale the Lomax distribution to Fx(U;μ1,σ) the following transformation is necessary: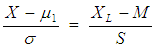 | (17) |
Then p1 can be defined in terms of  using equation (2)
 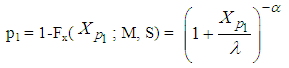 | (18) |
Where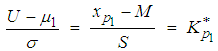 | (19) |
Thus  is a standardized value of XL, (where L stands for Lomax distribution) for which the upper tail area is p1, and p2 can be similarly defined in terms of
  :
: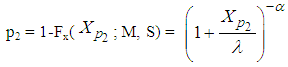 | (20) |
Where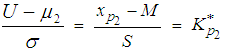 | (21) |
Thus  is a standardised value of XL (where L stands for Lomax distribution) for which the upper tail area is p2. Now the values of n and k have to be determined. And the procedure for determining n and k can be obtained from Zimmer and Burr [1],
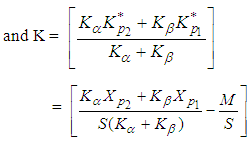
 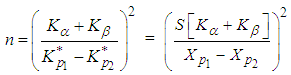 | (22) |
 | (23) |
 | (24) |
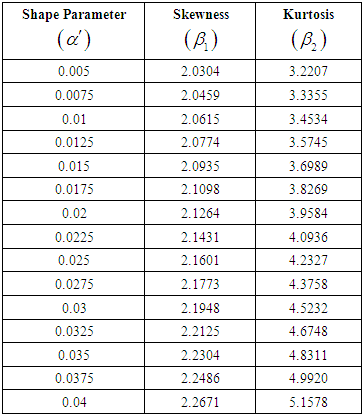
The skewness (β1) and kurtosis (β2) for Lomax distribution for the various values of shape parameter α are given in Table 1. It can be noted that the skewness and kurtosis of the Lomax distribution is based only on the shape parameter α. The corresponding mean M and the standard deviation S of the Lomax distribution are also presented in Table 2. The upper values in the Table 2 are mean values of the Lomax distribution and the lower values are standard deviation values corresponding to the various levels of λ and α. The parameters  and
and  are used for tabulation. Table 3 consists of the sampling plan parameters n and k values of Lomax distribution for various levels of skewness (β1) and kurtosis (β2). The upper values in the Table 3 are the n values and the lower values are k values.
3.2. Construction of Tables
Table 1 & 2:Table 1. Skewness and Kurtosis for Lomax Distribution for the Known, α
 |
| |
|
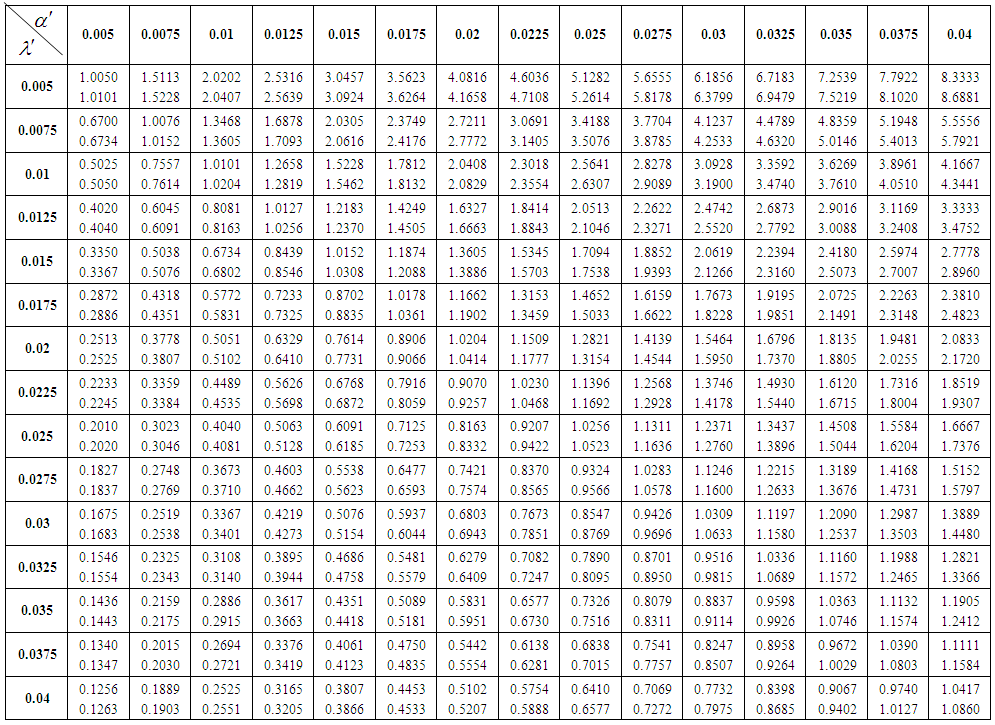 | Table 2. Values of Mean M and Standard deviation S the known α and λ |
i) The scale parameter λ and the shape parameter α are chosen at fixed intervals.ii) Corresponding to different values of α, the skewness (β1) and the kurtosis (β2) are obtained using the equations (5) and (6) and hence the values of  , β1 and β2 are presented in Table 1.iii) For the different levels of
  and
and  , the values of mean (M) and standard deviation (S) are obtained using equation (3) and (4).iv) The values of
  ,
,  , M and S are presented in Table 2. v) The upper value in the body of the Table 2 is the mean value (M) and lower value is the standard deviation value (S).Table 3:
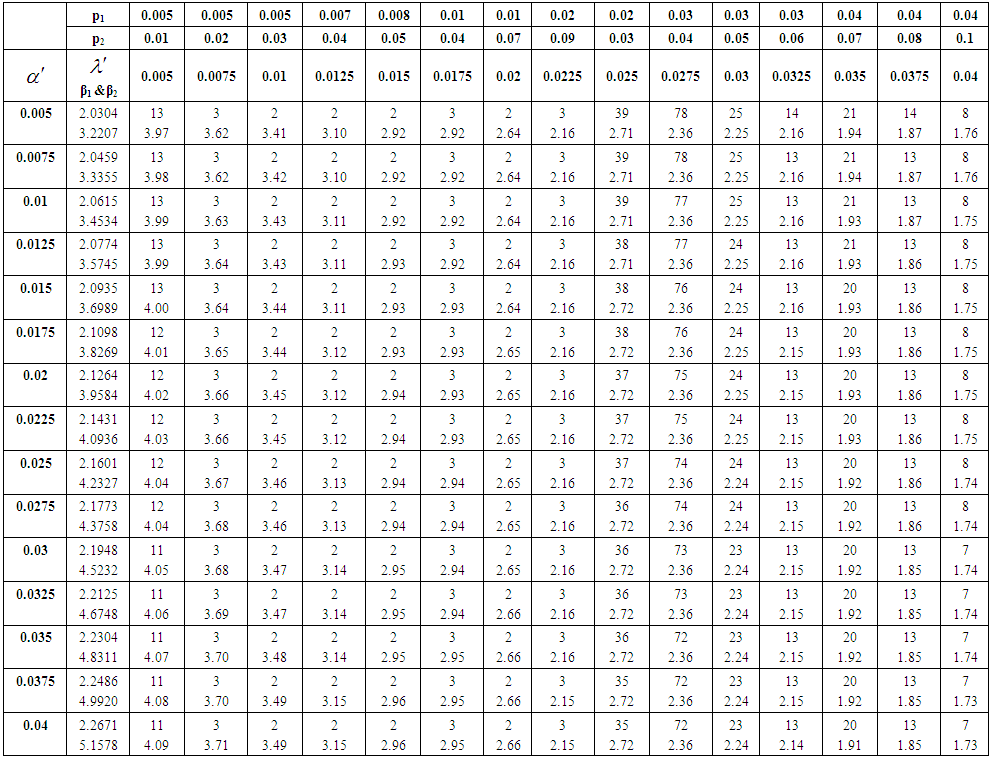 | Table 3. Values of n and k for the different values of p1, p2, α and λ with the different levels of skewness (β1) and kurtosis (β2) for known standard deviation |
i) The parameters of Lomax distribution namely α and λ are assumed to be known.ii) The AQL and LQL values are chosen from the production process. iii) The corresponding values of skewness (β1) and the kurtosis (β2) are obtained using the equations (5) and (6)iv) Also the corresponding values of mean M and standard deviation S are obtained using equation (3) and (4)v) The values of Xp1 and Xp2 are determined using the equations (18) and (20).vi) The values of Kα and Kβ for α=β=0.10 are found.vii) The values of  and
and  are obtained using equations (19) and (21).viii) And hence the sample size n and variable constant k are obtained using equations (22) and (23) for known standard deviation.ix) The values of n and k are presented in Table 3 along with corresponding values of
  ,
,  , p1, p2, β1 and β2.x) The upper value in the body of the Table 3 is n and the lower value is the corresponding k.Table 4:
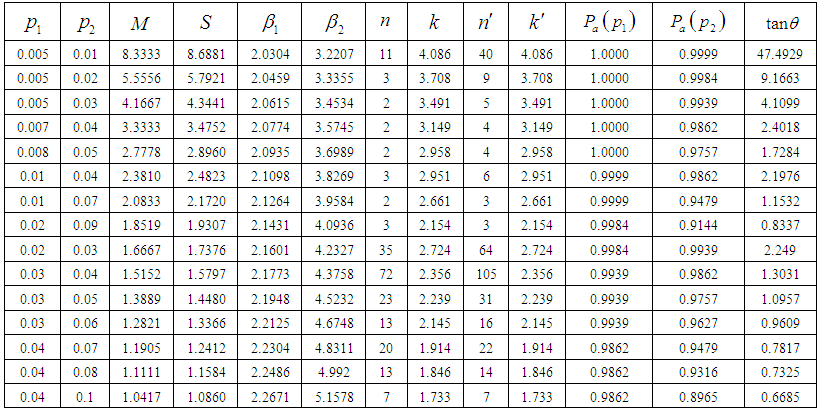 | Table 4. Minimum Tangent Angle Values for the given values of n, p1, p2 and k |
i) The values of p1 and p2 are fixedii) The corresponding values of skewness (β1) and the kurtosis (β2) are obtained using the equations (5) and (6)iii) Also the corresponding values of mean M and standard deviation S are obtained using equation (3) and (4)iv) The values of n and k are obtained using equations (22) and (23) for known standard deviation.v) The values of  and
and  are obtained using equations (25) and (26) for known standard deviation.vi) The values of tanθ are obtained using the equation (27).Example 1:The dimension and its variations in a production process follows heavy tailed Lomax distribution. The production process turns out skewness = 2.0774 and kurtosis = 3.5745. Determine variable sampling plans when AQL = 7% and LQL = 10% with corresponding probability of acceptance 90% and 10% respectively. Solution: It is given that the production process turns out Skewness = 2.0774 and Kurtosis = 3.5745. The distribution is positively skewed.Hence if p1=0.07 and p2 = 0.10 and α = β= 0.10, from Table 1,
  =0.0125 and if
  =0.015, then α=80 and λ=66.67.From Table 2, the corresponding mean M = 0.8439 and the standard deviation S = 0.8546.Using these measurements n and k values are determined as follows: Letting FX(x) in (1) be 0.93 and 0.90 corresponding to p1 and p2 and solving for Xp1 and Xp2, we get:
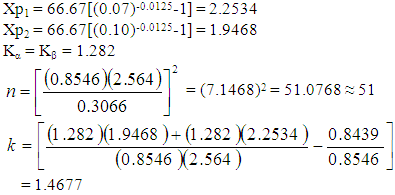
3.3. Lomax VSP for Unknown Standard Deviation
The operating procedure for these plans for unknown standard σ is given in section 2.2. When the standard deviation is not known then an alternate formula for finding the parameters n and k is given by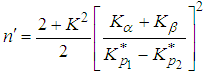 | (25) |
and 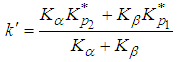 | (26) |
Hence it can be observed that whenever the skewness and kurtosis of a Lomax distribution is determined, the corresponding parameters of the Lomax Variable sample plans could be easily found. The procedure given in this paper facilitates easy selection of the plans through the tables provided. The tables can be extended further for various producer and consumer risks.
4. Designing the Sampling Plans with Minimum Angle Method
Another objective is that when the angle is minimized, then the abstract OC curve tends to ideal OC curve which leads to best sampling plans. In minimum angle technique generally a portion of the abstract OC curve is compared with the ideal OC curve. The approach of minimum angle method by considering the tangent of the angle between the lines joining the points (AQL, 1-α) & (LQL, β) is shown in Figure 1. 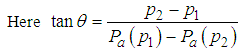 | (27) |
Thus when the two points on the OC curve are known, the minimum values of tanθ can be calculated. This minimum angle provides a better sampling plan with good discriminating power. It minimizes the angle between the abstract and ideal OC cuves. For a minimum tanθ, the angle θ approaches to zero and the chord AB approaches to AC, hence the ideal condition is reached. This approach minimizes both producers and consumers risk simultaneously. Thus both are benefitted by choosing these plans. The minimum angle method of Lomax variable sampling plans are presented in Table 4. The parameters of Lomax variable sampling plans are chosen from Table 4 corresponding to the minimum angle.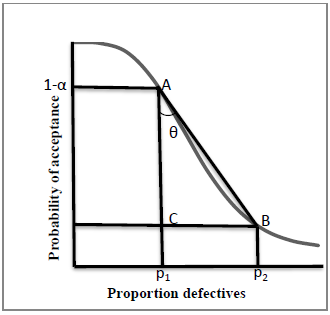 | Figure 1. Minimum Tangent Angle |
5. Conclusions
In variable sampling plans, although many process is based on normal distribution in most of the practical situations the process is non-normal and heavy tailed. Hence this article provides an insight to sampling plans based on non-normal Lomax distributions. Also the operating and designing procedures with necessary tables for easy selection of the sampling plans are provided. However, this study is limited only to heavy tailed Lomax distribution and only one specification limit. But this study can be extended to other non normal distributions and to lower specification limit also. It can be noted that by applying the minimum angle technique, there is a great reduction in the sample size. Also, this minimizes the risk of both the producer and consumer. The minimum tangent angle method helps to choose a better sampling plan which may tend towards an ideal situation. Also, it provides a better discernment of accepting good lots.
ACKNOWLEDGEMENTS
The authors are thankful to the referees for rendering appropriate suggestions to improve the article.
References
| [1] | Zimmer W, J, Burr I, W, Variables Sampling Plans Based on Non Normal Populations. Industrial Quality Control, Vol.20, No.1, pp.18–36, 1963. |
| [2] | Lomax, K. S. Business failures: Another Example of the Analysis of Failure Data. Journal of the American Statistical Association 49, 847–852, 1954. |
| [3] | Bander Al-Zahrani and Mashail Al-Sobhi, On Parameters Estimation of Lomax Distribution under General Progressive Censoring. Journal of Quality and Reliability Engineering, 2013. |
| [4] | Artur J. Lemonte and Gauss M. Cordeirob, An Extended Lomax distribution. Statistics, iFirst, pp.1-17, 2011. |
| [5] | Bassiouny, A.H., Abdo, N.F., and Shahen, H.S, Exponential Lomax Distribution. International Journal of Computer Applications, Vol.121, No.13, pp.24-29, 2015. |
| [6] | K. Takagi, On Designing Unknown-sigma sampling plans based on a wide class of non-normal distributions. Technometrics, Vol. 14, No.3, pp. 669-678, 1972. |
| [7] | Devaarul, S, Certain Studies Relating to Mixed Sampling Plans and Reliability Based Sampling Plans”, Ph.D., Thesis, Department of Statistics, Bharathiar University, Coimbatore, Tamil Nadu, India, 2002. |
| [8] | Devaarul, S and Jemmy Joyce. V, Designing and Selection of Reliability Sampling Plans Based on Minimum Angle Technique. International Journal of Mathematics and Computation, 20, No.3, pp.60-65, 2013. |
| [9] | Soundararajan. V & A. L. Christina, Selection of Single Sampling Variables Plans Based on the Minimum Angle. Journal of Applied Statistics, Vol.24, No.2, pp.207-217, 1997. |
| [10] | V. Jemmy Joyce, S. Devaaarul & K. Rebecca Jebaseeli Edna, Designing and Selection of Mixed Sampling Plans Based on Tangent Angle. International Journal of Mathematics and Computer Applications Research, Vol.3, Issue 1, pp. 217-222, 2013. |
| [11] | D. B. Owen, One-sided variables sampling Plans. Industrial Quality Control, Vol.22, pp. 450-456, 1966. |

 Abstract
 Reference
 Full-Text PDF
 Full-text HTML