Adekanmbi D. B.
Department of Statistics, Ladoke Akintola University of Technology, Ogbomoso, Nigeria
Correspondence to: Adekanmbi D. B., Department of Statistics, Ladoke Akintola University of Technology, Ogbomoso, Nigeria.
| Email: |  |
Copyright © 2017 Scientific & Academic Publishing. All Rights Reserved.
This work is licensed under the Creative Commons Attribution International License (CC BY).
http://creativecommons.org/licenses/by/4.0/

Abstract
Logit and Probit models are members of generalized linear models that are widely used to estimate the functional relationship between binary response variable and predictors. Comparison of regression models for binary response variable could be complicated by the choice of link function. The focus of this study is to determine which of the models will perform better in fitting birth data. The second focus of this study is to also make a comparative study between Yoruba women in Igbo-Ora known for high rate of multiple births and Yoruba women in Ogbomoso with sparse record of multiple birth, with the aim of determining factors that are responsible for the high rate of multiple births among the Igbo-Ora women in South-Western Nigeria. Theoretical derivations of the two models were given. Binomial regression model was fitted to the birth data with logit and probit links which resulted into logit and probit regression models respectively. The pchisq value of both the logit and the probit models were in excess of 0.05, an indication that the models fitted the birth data well. Due to simplicity of interpretation of results for Logit model, it was focused on for interpretation. The predictors considered in the models were age, religion, parity, tribe and the interaction term between age and religion of women. The results showed that the logit of having multiple births was positively related to tribe and the interaction term age*religion, but was found to be negatively related to women’s age, religion and their parity. It was also discovered that the odds of having multiple births by Yoruba women in Igbo-Ora is about three times higher than Yoruba women in Ogbomoso. The marked difference between the odds of having multiple births by women in Igbo-Ora and women in Ogbomoso is an indication that an inherent factor was responsible for the high rate of multiple births in Igbo-Ora. The high rate of multiple births could be ascribed to their regular consumption of Ilasa and Amala or due to a hereditary factor peculiar to Igbo-Ora women. Religion of women was only marginally significant, in the presence of other predictors. Graphical and numerical diagnostic evaluations of the models conducted revealed that the models were good summary of the birth data. Criterion-based variable selection procedure was also considered in selecting predictors that produce the most parsimonious models for both logit and probit models. Based on the AIC values, the final logit and the final probit regression models contained only tribe variable as the predictor for the most parsimonious model. It was difficult to distinguish between the logit and the probit models on the Receiver Operating Characteristic (ROC) curve, showing that the two models are quite similar, though the logit appeared to yield better performance than the probit model. This is an indication that the logit model has slight better prediction than the probit model. The choice of link function between logit and probit therefore depends on the data generating the process; and largely the choice is subjective.
Keywords:
Logit transformation, Probit transformation, Receiver Operating Characteristic Curve (ROC), Ilasa, Amala, Criterion-based Variable selection, Effect modification, Akaike Information Criterion, (AIC)
Cite this paper: Adekanmbi D. B., Comparison of Probit and Logit Models for Binary Response Variable with Applications to Birth Data in South-Western, Nigeria, American Journal of Mathematics and Statistics, Vol. 7 No. 5, 2017, pp. 199-208. doi: 10.5923/j.ajms.20170705.02.
1. Introduction
Binary Logit and binary probit models are classification models that belong to the family of generalized linear models. They can be used to model functional relationship between a dichotomous response variable and one or more predictors, [9, 11, 12]. When the response variable is dichotomous such as the multiple birth data being considered in this study, both models are suitable for estimating the functional relationship between response variable and the predictors. Both models can therefore be used to analyze same data set for the same purpose, [4, 6, 20]. Since the two models can be used for the same purpose, it is necessary to determine which model performs better. Logit model is a method for fitting a set of data when the response variable consists of proportions or binary coded data. Probit model is a type of binary classification model, which is also appropriate in fitting regression curve, when the response variable is a binary or dichotomous variable and the predictors are either numerical or categorical, [8, 13, 14, 19]. Multiple birth is a type of birth in which a mother gives birth to two or more offsprings from the same pregnancy, [1, 5, 10]. It refers to the delivery of twins and higher order multiples such as triplets, quadruplets, quintuplets, sextuplets, septulets, octuplets, and so on, [15]. Yoruba is a tribe that has the highest rate of twining and multiple births in the world with 90-100 twins per 1,000 livebirths, [5, 10]. Igbo-Ora, a town in Oyo-State, Nigeria, has the highest incidence of multiple births, especially twin births, [1, 5, 10, 16, 17]. The unusually large numbers of multiple births in Igbo-Ora have popularized the town, and this has earned the town a nick name twin capital of the world, [1, 5]. Igbo-Ora is a town in South-Western, Nigeria, situated 80 kilometers north of Lagos-State, with a population of approximately 60,000, [1, 5]. A distinct trait of Igbo-Ora twin is that they are usually identical. Birth statistics showed that there are 158 twins per 1000 births in Igbo-Ora, [5, 10]. In fact it has been established that delivery of twins in the local community hospital in Igbo-Ora is a regular occurrence, [17].Some medical experts though believed that the real cause of the phenomenon has not been medically found. Studies conducted by various fertility specialists have established that factors such as advancing maternal age at conception, diet, ethnicity, genetics and life style play significant roles in the possibility of a woman having multiple births, [15]. The chances of hyper-ovulatory cycles increase with advancing maternal age, which could lead to chance of multiple pregnancy, [15, 18]. Women with family history of multiple pregnancies in their maternal side have higher chances of carrying hyper-ovulating genes, which consequently lead to multiple births [15]. Racial factors also play a significant role in multiple births, [18]. A number of diets that medical experts believe increase the rate of ovulation by increasing the secretion of certain hormones that stimulates ovaries to release multiple ova, could results in multiple births, [18]. Such diets include wild yams, dairy products, soy isoflavones, whole wheat, whole grains, and okra leaves, [16, 18].The indigenes of Igbo-Ora have attributed the high rate of multiple births to consumption of a kind of okra leaves, locally known as Ilasa, and Amala, [5, 10]. Amala is a morsel meal made from yam powder, while Ilasa is a special okra soup indigenous to Igbo-Ora people. In fact research has linked consumption of Ilasa to the high rate of multiple births in the town, [10, 16, 17]. Extensive researches conducted on this phenomenon have also discovered that yam contain chemical known as Gonadotrophins which increases the chance of production of multiple eggs in women, [15, 18].The main focus of this study is to make empirical examination of the link function selection and model fits of logit and probit regression models, in modeling the birth data, and to also determine factors responsible for high rate of multiple births among Yoruba women in Igbo-Ora. Model fit can be improved by the selection of appropriate link for binary data. The article is organized as follows. Section 2 explains the data employed in this study. In section 3, the theories of logit and probit regression models, including theories of measures of goodness of fit and diagnostic measures and also variable selection method are discussed. Section 4 focuses on effect modification, while the theory on Receiver Operating Characteristic curve is given in section 5. The models as applied to retrospective multiple birth data from Igbo-Ora and Ogbomoso. The results of analyses and interpretations are presented in section 6. Finally, section 7 concludes with discussion of issues arising from the study.
2. Data
The secondary data on births were extracted from the records of a teaching hospital in Ogbomoso, and also from a government owned hospital at Igbo-Ora, where multiple births are regular occurrences. The data was on a total number of 982 women who delivered livebirths between the periods 2012 to 2015, in Ogbomoso and Igbo-Ora. The variables recorded on the women were age, religion, tribe, and parity. This study is therefore a comparison study of Yoruba women in Igbo-Ora and Yoruba women in Ogbomoso with a view of determining factors responsible for prevalence of multiple births among Igbo-Ora women. Examination of the data revealed that the maternal age with the highest livebirths was 30 years, while the lowest number of births was recorded for women aged 45.
3. Logit and Probit Regression
When the response variable is nominal rather than quantitative, and could be explained as a function of the predictors, then the acceptable model of fitting such data is Binomial regression. Some of the link functions for Binomial regression are logit and probit transformations, [2, 4, 8, 9, 11]. The choice of link function can be crucial to the accuracy of the result of binary modeling of a data set.
3.1. Logit Transformation
A logit model of a binary response variable is specified as follows: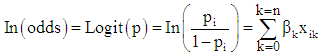 | (1) |
The ratio  is the odds that
  The inverse transformation is therefore
 | (2) |
(2) is called the logit of p, [2, 4, 9]. It is the log of odds that  is 1 rather than 0. Any value of p in the range (0, 1) is transformed into a value of the logit(p) in
  so that as
 [12]. In logit regression, the errors are assumed to have a standard logistic distribution. The mean of a standard logistic distribution is 0, while its variance is
  Logit model can be generalized to k explanatory variables which require a linear predictor, which is a function of several predictors.
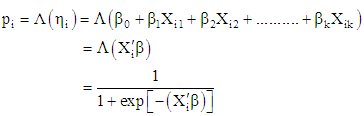 | (4) |
Also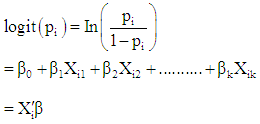 | (5) |
The odds can vary on a scale of  so that the log-odds can vary on the scale of
  There is no error term in logit regression model, unlike in classical linear regressions.Exponentiating (5), then
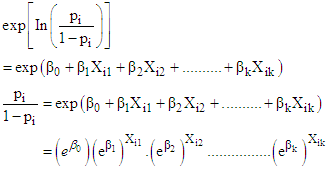 | (6) |
The  is the multiplicative effect on the odds of increasing
  by 1, while holding other
  constant, [9]. The
  coefficients of a logit regression model are the log-odds ratio. The coefficients give information on how the log-odds changes with a unit change in the predictor. The sign of the log-odds indicate the direction of the relationship of a predictor with the logit. The exponential of the coefficient then gives the expected odds-ratio, which gives intuitive sense of how the logit is changing. The coefficient of interaction give information on how much the odd-ratio related to a predictor is different between groups, [9, 13, 14].
3.2. Probit Transformation
Another suitable transformation function for a binary response is the probit link function. Probit is also referred to as inverse Normal function, [9, 12, 14]. In order to ensure that p is between 0 and 1, a positive monotone function that maps the linear predictor,  into the unit interval.
 | (7) |
where cumulative distribution function.
 are parameters to be estimated.A reasonable apriori
  should be both smooth and symmetric, and should approach
  as asymptotes. Given the cumulative distribution function of the unit-normal distribution,
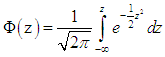 | (8) |
The normal distribution  yields linear Probit model, such that:
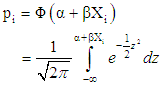 | (9) |
Then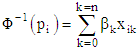 | (10) |
where Standard normal cumulative distribution.The probit model can also be generalized to k explanatory variables, such that
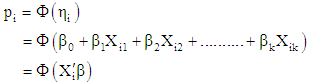 | (11) |
In probit regression, the errors are assumed to have a standard normal distribution. If  is defined in terms of the inverse normal probability integral as
  then
then  is referred to as the probit of p.Logit and probit models can be fitted to a data set by the method of maximum likelihood, [4, 6, 9, 13]. The difference between logit and probit models lies in the assumption about the distribution of errors. Logit has standard logistic distribution of errors, while probit has Normal distribution of errors. The probit and logit models usually produce almost identical marginal effects. For logit and probit models, the predicted probabilities are limited between 0 and 1, [6, 12, 13, 14]. When the variances of logit and probit transformations are equated, the two transformations become so similar that it becomes difficult to distinguish between them, [4, 6, 9]. There are practical advantages of logit transformation over the probit transformation. The equation of the logistic cumulative distribution function (CDF) is simple compared to CDF of probit, especially for dichotomous data, [9, 13]. The inverse linearising transformation for the logit model,
  is directly interpretable as log-odds, as opposed to the inverse transformation
  in probit that does not have a direct interpretation [9].
3.3. Hypothesis and Confidence Interval for Logit and Probit Models
Hypothesis tests for logit and probit models are based on Wald statistic, [4, 6]. For an individual coefficient, to test the hypothesis:  the Wald statistic should be calculated as
 | (12) |
where the asymptotic standard error of
 follows an asymptotic unit-normal distribution under the null hypothesis. The asymptotic
  confidence interval for
  is:
is: | (13) |
where the value from
  with a probability of
  to the right.
3.4. Deviance: A Measure of Goodness-of-fit
Deviance provides a measure of overall model fit for binomial regression model. It is an extent to which a generalized linear model adequately represents a set of binary data, [8, 9, 11]. The goodness-of-fit of a generalized linear model can be assessed by computing the scaled deviance, and comparing the result with a  distribution with the relevant degrees of freedom, [14].
 | (14) |
where is the maximal model likelihood estimate.Generally, a generalized linear model that is based on estimation of p parameters from a data set with n observations will have its test statistic distributed as
  [11].
[11].
3.5. Variable Selection Method
Variable selection procedure is a mean to select the most parsimonious model that fits the data well, and explains the relationship in a data set, [9, 19]. The variable selection procedure that will be employed in this study is criterion-based procedure. Criterion-based methods involve a wider search and compare models in a preferable manner compared to stepwise procedures which depends on a restricted search through the space of potentials models, and use dubious hypothesis testing based method for selecting between models. Given p potential predictors, then there are 2p possible models. All the models should be fitted and the best model is chosen based on some criterion. The criterion that will be used in this study for the criterion-based method is the Akaike Information Criterion (AIC). AIC is explained in details in section 3.7.
3.6. Diagnostic Measures for Generalized Linear Model
Model diagnostic refers to the validity of binomial models in terms of the general form of the model to determine whether the relationships between the response and predictors have been modeled in the correct manner; so as to ensure that the model is not grossly wrong, [4, 6]. It also concerns verification of the underlying assumptions of a binomial model to determine if they are well satisfied or not, and to determine the adequacy of the link function, [9]. Another aspect of model checking or model validation is checking for outliers or influential observations, [9, 13]. These checks are usually based on graphical analysis of residuals or a transformation of these residuals. Diagnostic measures in logit and probit models are based on residuals. There are several forms of residual in the binomial case. (1) Pearson ResidualsPearson residuals are elements of the Pearson chi-square that can be used to detect ill-fitted factor pattern. Given that  then the Pearson Residuals is
  | (15) |
So that the Chi-squared statistic  (2) The Deviance residuals is
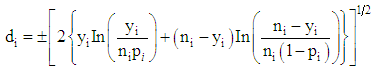 | (16) |
Either of the two residuals can be plotted versus the observation number to check for the form of the linear predictor. A systematic pattern in this plot is an indication that the model is incorrect. For a binary response, the logit transformation is always appropriate and does not need checking, [13, 14, 20].
3.7. Influential Observations
Generally, outliers can be identified by standardized residuals greater than +2 or smaller than -2. A Binomial regression model should not be accepted unless diagnostic tests for lack of fit and influential observation have been conducted, [2, 12]. Diagnostics for identifying influential observations are:(i) Leverage  is a measure of the leverage of covariate pattern ‘i’ to determine how much of an effect does an observation have on the estimated model. A point with high leverage has the potential to be influential. The diagonal elements of the ‘hat matrix’ are a measure of leverage of covariate pattern ‘i’. A threshold used is that values greater than
  indicate large leverage, where p is the number of variables in the model and n is the number of covariate patterns.(ii) Cook’s statisticIt is a popular influence diagnostic. Cook’s statistic is a measure of the distance between a binomial regression coefficients with and without each observation.
 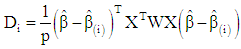 | (17) |
 can be computed using the formula
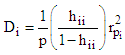 | (18) |
The thresholds of 0.33 or 1 signaled unusual observation, [8, 9].
3.8. Akaike Information Criterion (AIC)
There are several criteria for selecting the best parsimonious model in generalized linear modeling, as advocated by several authours, [12, 14]. AIC is one of the model selection criteria, [7]. AIC is defined as: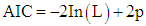 | (19) |
whereL: maximized value of the likelihood function for the estimated model.p: number of parameters in the model.When comparing competing models fitted by maximum likelihood to the same data, the smaller the AIC the better the fit, [3, 12].
4. Effect Modification
Interaction is an alternative term for effect modification. It is an interaction between the effects of two variables if the effect of one variable varies according to the level of the other variable. A covariate is an effect modifier only when the interaction term included in a binary regression model is both meaningful and statistically significant, [8]. In this study it is reasonable to think that religion of women modifies the effect of age of women, since religion influences the age at marriage and consequently influences age at birth. The crucial interaction term to include in the models is therefore between age and religion.
5. Receiver Operating Characteristic (ROC) Curve
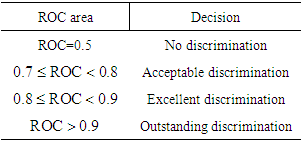
ROC is the plot of sensitivity versus 1-specificity over all possible cutpoints. The area under the curve provides a measure of discrimination. It is a visual index to compare competing models. It plots the probability of detecting true signal (sensitivity) and false signal (1-specificity) over all possible cutpoints, [6]. It is helpful in comparing two or more diagnostic tests. The general rule for ROC curve is given in table 1.Table 1. General rule of ROC curve
 |
| |
|
6. Results and Interpretations of Analyses
The response variable in this study is type (type of birth) which is coded as 1=multiple births, 0=single birth. The Gender is coded as 0=Male, 1=Female. Religion of women is coded as 0= Islam, 1=Christianity, while tribe is coded as 0= Ogbomoso; 1= Igbo-Ora. Age of women at birth is a continuous variable in the data. Parity, which is the number of children ever born by a woman, is also a continous variable. Figure 1 is the boxplot of the distribution of the age of women according to whether they have single birth or multiple births. The median age of women who had multiple births is a bit lower than women who had multiple births. Two outliers can be identified on the women with single birth group. The scatterplot of the pair of response versus predictors and pair of predictor versus predictor arranged in a matrix form is shown in Figure 2. The scatterplot reflects the relationship between the response variable (type) and the predictors, and shows the dichotomous nature of the response variable so that all observations fall in either multiple births (y=1) or single birth (y=0).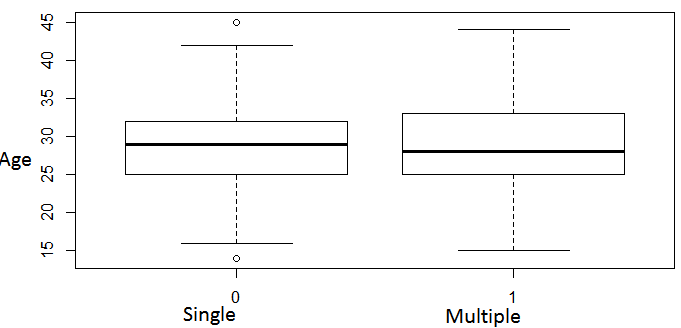 | Figure 1. Boxplots of the distribution of age of women with single or multiple livebirths |
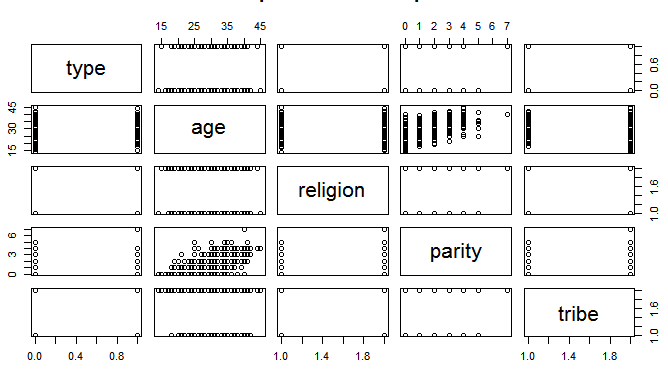 | Figure 2. Scatterplot matrix of the variables in the models |
6.1. Results of the Logit Regression of the Data
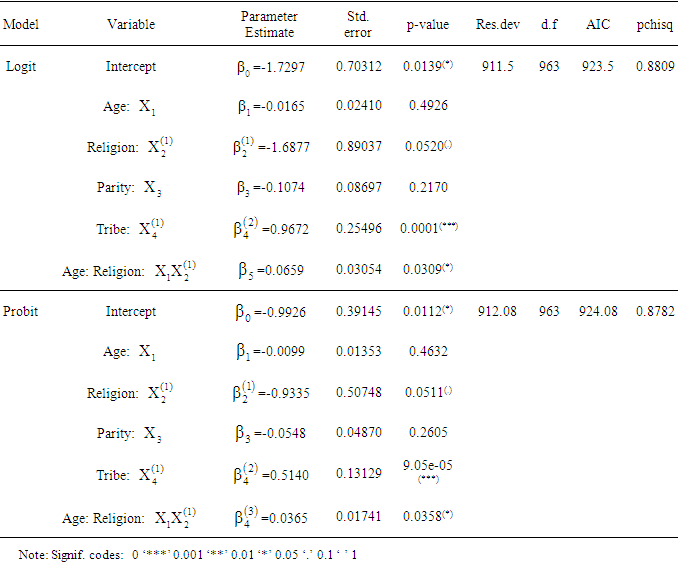
The fitted logit model has the equation: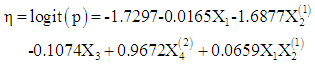 The results of the logit regression of the birth data are shown in the upper part of table 2. The logit model contains four predictors and an interaction term. The p-value is in excess of 0.05, and could be concluded that the model fits very well, so that the model can be accepted to have generated the data
 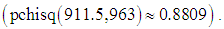 The interaction term age* religion, and tribe, are statistically significant, in the presence of other variables, (p=0.0309; 0.0001 respectively). Religion is only marginally significant, (p=0.0520). The logit of having multiple births is negatively related to age, religion and parity of women. So that as women advances in age, the chances of having multiple births decline. Age and parity are not significant in predicting whether a woman will have multiple births or not. According to the logit model, the odds of having multiple births is (exp(0.9672)=2.63), which is almost 3 times higher for Igbo-Ora women compared to Ogbomoso women, after adjusting for the effects of other variables. The coefficient of age is -0.0165, which implies that for every one year increase in age of women multiplies the odds of having multiple births by 0.98, controlling for other variables. The marked difference in the odds of having multiple births by Yoruba women in Igbo-Ora compared to Yoruba women in Ogbomoso shows that an inherent factor is responsible for this phenomenon in Igbo-Ora. This could be due to an inherent hereditary factor that is peculiar to the Igbo-Ora women only or could be ascribed to their diets, which is Ilasa and Amala. The result also shows that for Muslim women, a one year increase in age yields a change in odds ratio of -0.0165, while for Christian women the change in odds ratio is -1.6383, with other predictors held constant. In terms of odds, for muslim women the odds of having multiple births is exp(-0.0165)=0.9836 for a year increase in age of women, and the odds is exp(-1.6383)= 0.1943 for a one year increase in age of Christian women, after adjusting for the effects of other predictors.
Table 2. Summary of the Logit and Probit Regression Models of the birth data
 |
| |
|
6.2. Results of Probit Regression of the Data
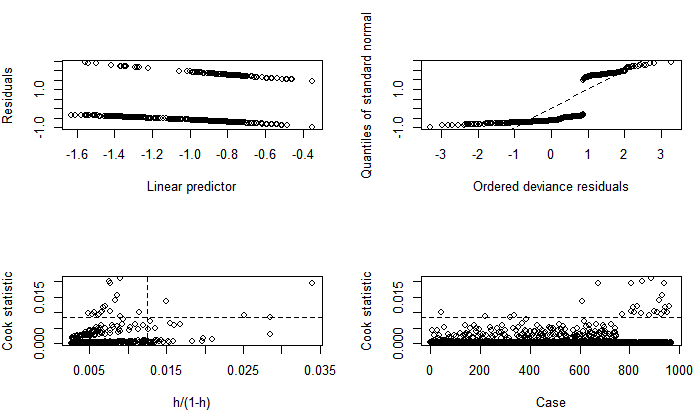
The probit fit to the birth data has the equation: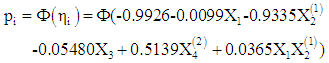 Results for probit analysis on the birth data are also presented in the lower part of table 2. According to the probit model, the association between likelihood of multiple births and tribe and the interaction term age*religion are positive and statistically significant, (p= 0.00009, 0.0358), but is only marginally significant with religion, (p=0.051), in the presence of other variables. Parity and age are negatively related to the likelihood of having multiple births, but are not significant in the presence of other variables. The result shows that a year increase in the age of married women increases the z-score of having multiple births by 0.0099, with respect to other variables in the model. Also, Igbo-Ora women compared with Ogbomoso women increases the z-score of having multiple births by 0.5140.Logit model fits the birth data with residual deviance of 911.5 on 963 d.f yields a p-value of 0.8809, while the probit model fits the data with a deviance of 912.08 on 963 d.f yields a p-value of 0.8782. The two models fit well since their p-values are in excess of 0.05, though the logit has a marginal better prediction than the probit model. The ratio of deviance/d.f is almost 1 for each of the models, indicating that there is no problem of overdispersion in the data. Diagnostic evaluation of the logit models were conducted to detect cases in the data that do not fit the pattern of the rest of the data, and to also verify the assumption of the models. Figures 3 and 4 show the plots of jackknife deviance residuals against linear predictor in the upper left panel of the figures, normal scores plots of standardized deviance residuals referred to as normal QQ plot in the upper right panel in the figures, plot of approximate Cook statistics against leverage/(1-leverage) in the lower left panel of the figures, and case plot of Cook statistic against case number in the lower right panel of the figures, for the logit and the probit models respectively. The dichotomous nature of the logit and probit residuals in the plot of residuals against linear predictors makes it almost impossible to discern any pattern in the plot. The QQ plots in figures 3 and 4 show a little deviation from linear trend at the middle of the plots, indicating skewness. For large dataset such as the birth data used in this study, the normality assumption is not crucial, since the inference will be approximately correct in spite of the non-normality. The plot of the cook statistic for the logit and the probit models as given in the lower left panel of figures 3 and 4, show that some cases are outliers. A further close investigation of these cases shows that they are not influential. The Dfbeta for the parameters have values less than 1, showing that none of the cases when deleted from the models have any significant effect on the estimates of the parameters. Also, the standardized residuals all have values less than
  so that there is little concern on the residuals.
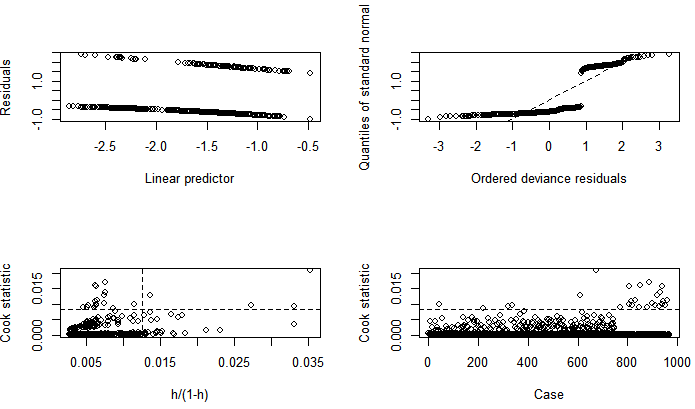 | Figure 3. Diagnostic plots for Logit model |
 | Figure 4. Diagnostic plots for Probit model |
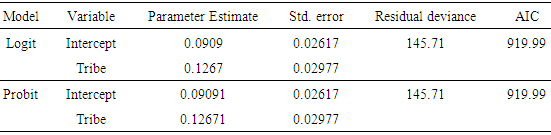
A criterion-based variable selection procedure was conducted on the response variable type of birth and the four predictors: Age, Religion, Parity and tribe, for the logit and probit regression models. The results for the criterion-based regression for the logit and the probit regression are provided in table 3. All the possible models for both logit and probit are fitted differently, and the models that produced the lowest values of AIC are selected as best models for logit and probit regression. According to the procedure, the best model is the one with only tribe variable as predictor. Both logit and probit regression yielded the same result.Table 3. Summary of the Variable Selection Procedure of the Logit and the Probit Regression
 |
| |
|
Figure 5 shows the sketch of ROC curve of both logit and probit models. The performances of the two models are above the diagonal line, indicating that the models are better than random guess. It is nearly difficult to distinguish between curves of logit and probit, showing that the two results are quite similar. The area under the ROC curve for the logit model is 0.622, with 95% confidence interval 0.576-0.663. For the probit model, the area under the ROC curve is 0.620 with a 95% CI of 0.576-0.664. 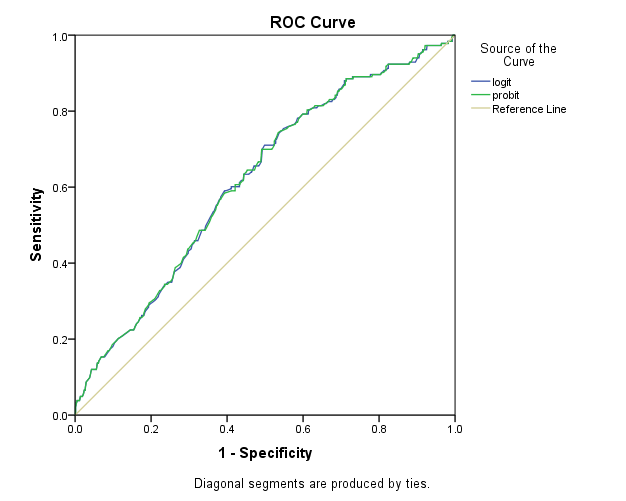 | Figure 5. ROC of the logit and probit models |
7. Conclusions
The purpose of comparing the two birth groups from Ogbomoso and Igbo-Ora is to determine if there is significant difference in the predicted response of the binomial models; and also to determine the predictors that have significant contributions to the likelihood of having multiple births. The two models: logit model and probit model produced almost identical marginal effects, though the estimates of parameters of the models are not directly comparable. There was a strong interaction between age and religion for both logit and probit scale. The interaction term was included in the model to check for effect modification of age by religion. Regular consumption of Ilasa and Amala by Igbo-Ora women appeared to have significant effect on the likelihood of women having multiple births, as evidenced by the higher rate of multiple births compared with other Yoruba women in Ogbomoso. Diagnostic checks were conducted on the two models to determine the adequacy of the models. The criterion-based procedure which was a variable selection method employed in this study penalized the model heavily, retaining only one predictor in both the logit and probit models. The procedure involved a wide search and compared models in a preferable manner, which was an advantage of the procedure.Identified practical advantages of logit model over probit model were the simplicity of its structural form and interpretability of the results. The transformation for the logit model was directly interpretable as log-odds, but the inverse transformation for the probit model did not lend itself to direct interpretation. The choice of link function for binomial regression could be based on physical knowledge of the data or as a matter of simple convenience. The choice is largely therefore subjective.
References
| [1] | African Celebs. Land of twins. Accessed August 20, 2016. Available at http://africacelebs.com/land-twins/. |
| [2] | Agresti, A. Categorical data analysis. 2ed. New-York: John Wiley, 2002. |
| [3] | Akaike, H. A new look at the statistical model identification. IEEE Trans. Autom.Contr. AC-19, 1986; 716-723. |
| [4] | Alison, P.D. Comparing logit and probit coefficients across groups. Sociological Methods and Research, 1999; 28: 186-208. |
| [5] | BBC World Service. The land of twins. Accessed July 20, 2016. Available at http://www.bbc.co.uk/worldservice/people/highlights/010607_twins.shtml. |
| [6] | Cakmakyapan, S., and Goktas, A. A comparison of binary and probit models with a simulation study. Journal of Social and Economic Statistics, 2013; 2(1): 1-17. |
| [7] | Clayton, M.K., Geisser, S., and Jennings, D.E. A comparison of several model selection procedures. Bayesian Inference and Decision Techniques, Amsterdam: North Holland, 1986. |
| [8] | Dobson, A.J. An introduction to generalized linear models. London: Chapman and Hall, 1990. |
| [9] | Efron, B., and Hastie, T. Computer age statistical inference: algorithms, evidence and data science. Cambridge: Cambridge University Press, 2016. Faraway, J.J. Extending the linear model with R, generalized linear, mixed effects and non-parametric regression models. New-York: Chapman and Hall/CRC, 2006. |
| [10] | Gateway, Nigeria. 2011. Igbo-Ora, the town with the highest number of twins in the world. Accessed August 20, 2016. Available at http://www.gatewaynigeria.tv/relocate/2011/04/igbo-ora-the-town-of-twins-in-nigeria/. |
| [11] | Krzanowski, W.J. An introduction to statistical modeling. New-York: Oxford University Press, 1998. |
| [12] | Lawal, B. Categorical data analysis with SAS and SPSS Applications. New-Jersey: Lawrence Erlbaum Associates, 2003. |
| [13] | Long, J. S. Regression models for categorical and limited dependent variables. Thousand Oaks, CA: Sage Press, 1997. |
| [14] | McCullagh, P. and Nelder, J. Generalized linear models (2ed). London: Chapman and Hall, 1992. |
| [15] | Medical Art Centre. Multiple births: reactions from medical experts. Accessed August 20, 2016. Available at http://www.medicalartcentre.com/multiple-births-reactions-from-medical-experts/. |
| [16] | Nairaland Forum. How to raise your chance of having twins. Accessed August 20, 2016. Available at http://www.nairaland.com/.../foods-increase-chances-having-twins/2. |
| [17] | Nairaland Forum. Twins in Igbo-Ora. Accessed August 20, 2016. Available at http://www.nairaland.com/94488/nigerias-land-twins-baffles-fertility. |
| [18] | New health Guide. How to conceive twins. Accessed August 20, 2016. Available at http://www.newhealthguide.org/How-To-Conceive-Twins.html. |
| [19] | Tibshirani, R. Regression shrinkage and selection via the Lasso. Journal of Statistical Society Series B, 1996; 58: 267-288. Williams, R. Using heterogenous choice models to compare logit and probit coefficients across groups. Sociological Methods and Research, 2009; 37(4): 531-559. |
| [20] | Xu, J and Long, J.S. Confidence intervals for predicted outcomes in regression models for categorical outcomes. The Stata Journal, 2005; 5: 537-559. |

 Abstract
 Reference
 Full-Text PDF
 Full-text HTML