Oseghale O. I.1, Akomolafe A. A.2
1Department of Mathematics and Statistics, Joseph Ayo Babalola University, Ikeji Arakeji, Nigeria
2Department of Statistics, Federal University of Technology Akure, Nigeria
Correspondence to: Oseghale O. I., Department of Mathematics and Statistics, Joseph Ayo Babalola University, Ikeji Arakeji, Nigeria.
| Email: |  |
Copyright © 2017 Scientific & Academic Publishing. All Rights Reserved.
This work is licensed under the Creative Commons Attribution International License (CC BY).
http://creativecommons.org/licenses/by/4.0/

Abstract
In this paper, a new five-parameter generalized version of the Weibull distribution called Kumaraswamy transmuted Weibull. The new distribution is quite flexible and can have a decreasing, increasing, and bathtub-shaped failure rate function depending on its parameters making it effective in modeling survival data and reliability problems. The maximum likelihood function of the new distribution was derived. Some comprehensive properties of the new distribution, such as closed-form expressions for the density, cumulative distribution, hazard rate function, the ith order statistics were provided. At the end, in order to show the capability of KTWD over its sub models, an application to a publish carbon data illustrates its potentiality over all other models.
Keywords:
Kumaraswamy transmuted Weibull, Maximum likelihood estimation, Bathtub-shaped failure rate
Cite this paper: Oseghale O. I., Akomolafe A. A., Performance Rating of the Kumaraswamy Transmuted Weibull Distribution: An Analytical Approach, American Journal of Mathematics and Statistics, Vol. 7 No. 3, 2017, pp. 125-135. doi: 10.5923/j.ajms.20170703.05.
1. Introduction
The Weibull distribution is a very popular life time probability distribution that has been extensively used for modeling in reliability, engineering and biological studies. Generalizations of the distribution have been suggested by many authors. Sarhan and Zaindin (2009) studied the modified Weibull distribution, Mudholkar and Srivastava (1993) introduced the exponentiated Weibull distribution and Pal, Masoom Ali, and Woo (2006) investigated many of its properties. Elbatal (2011) studied the exponentiated modified Weibull distribution. Combining the work of Eugene et al (2002) and Jones (2004) to construct a new class of kumaraswamy generalized (KwG) distribution can be obtained. From an arbitrary parent cumulative density function, F(x), the cumulative density function,  of the Kumaraswamy Generalized distribution is defined by
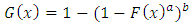 | (1) |
Where 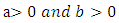 are two additional parameters whose role is to introduce Skewness and vary the tail weights. Because of its tractability, the kumaraswamy distribution function (Kw) distribution can be used quite effectively even if the data were censored.Correspondingly, the density function of this family has a very simple form given by
 | (2) |
Several generalized distributions from (4) have been defined and investigated in the literature including the Kumaraswamy Weibull distribution by Cordeiro et al. (2010), the Kumaraswamy generalized gamma distribution by de Castro et al. (2011) and the Kumaraswamy generalized half-normal distribution by Cordeiro et al. (2012).In this article, we use transmutation map approach suggested by Mansour et al. to define a new model, which generalizes the Kumaraswamy Transmuted Weibull (KTWD) distribution. According to this approach, the cumulative distribution function (cdf) satisfies the relationship: | (3) |
G(x) be the cumulative distribution function (cdf) of a non-negative absolutely continuous random variable, G(x) be strictly increasing on its support, and G(0) = 0.
2. The Proposed Kumaraswamy Transmuted Weibull Distribution
According to Ahmad et al. (2016), the pdf and cdf of Kumaraswamy transmuted generated distribution family are respectively 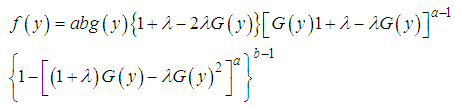 | (4) |
 | (5) |
Note that the Weibull density is defined as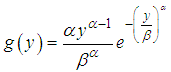 | (6) |
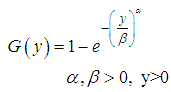 | (7) |
If we put (3) and (4) in (1) we have  | (8) |
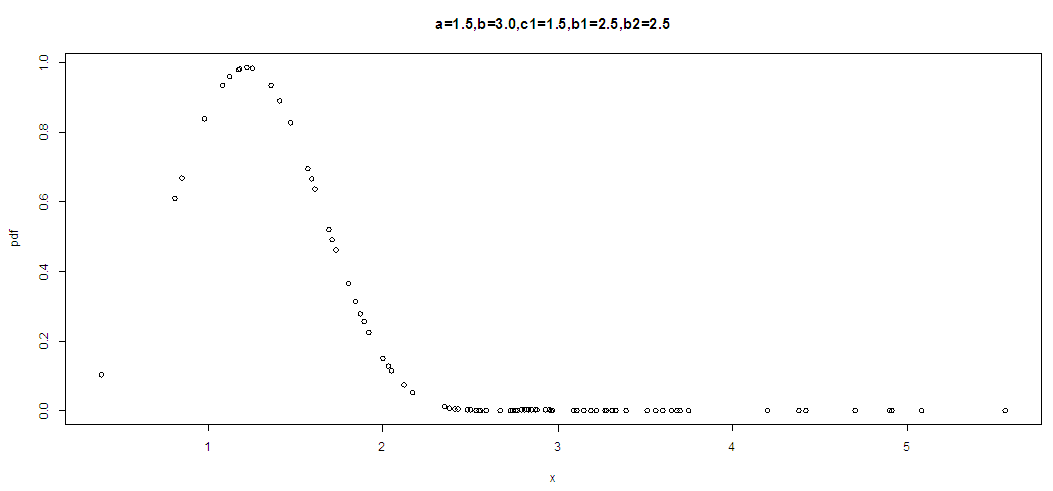 | Figure 1. The graph of pdf of KTWD for various values of the parameters |
The graph above indicates that the KTWD is skewed to the right and corresponding cdf of the proposed Kumaraswamy Transmuted Weibull distribution function is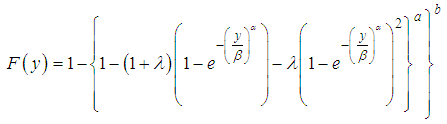 | (9) |
Several distributions can be derived from (9)(i) When  , it becomes Transmuted Weibull(ii) When
  , it becomes Kumaraswamy transmuted Weibull (iii) When
  , it becomes exponentiated transmuted Weibull(iv) When
  , it reduces to Conventional Weibull density(v) When
  , it becomes exponentiated transmuted Weibull Verification of the true pdf
 This verified that KTWD is a true Pdf.
3. Properties of KTWD
Cumulative density FunctionIf  denotes random samples of size n from the KTWD, the Cdf is obtained using (2) and is given as
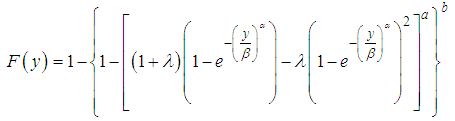 | (10) |
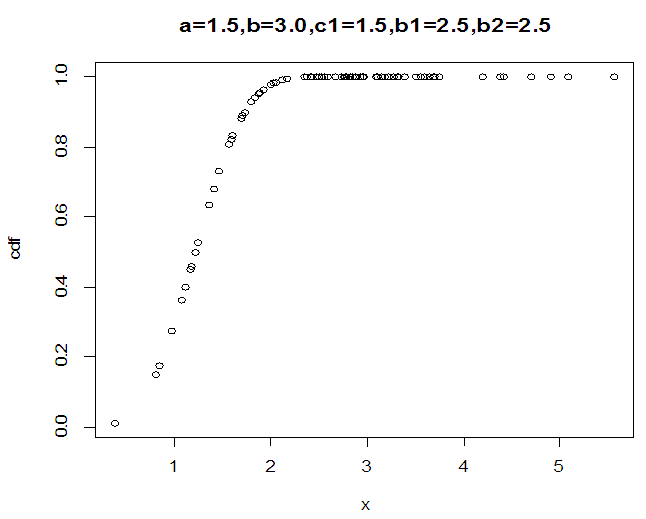 | Figure 2. The cdf of KTWD for various parameters |
The figure 2 above indicates that the KTWD converges to one as n tends to infinity, which indicates that it is a proper pdf.
4. Hazard Function
The hazard function can be obtained using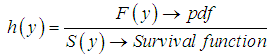 The Survival function,
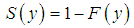
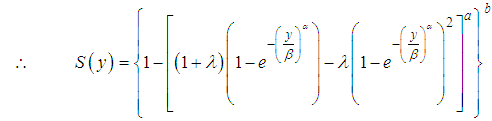 | (11) |
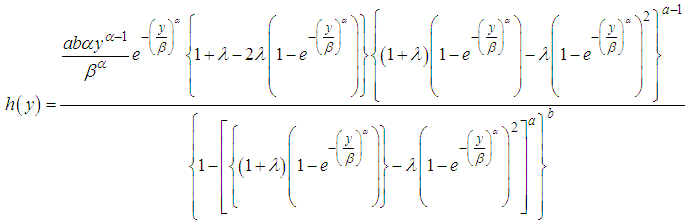 | (12) |
Mixture Representation of KTWDFrom (5)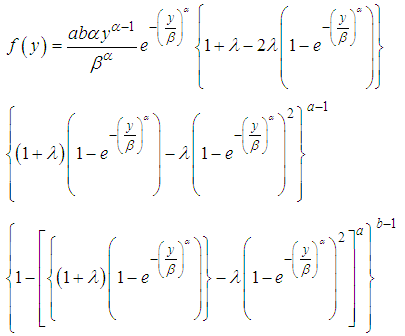 If we consider the power series expansion given as
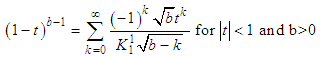 | (13) |
Real non integerUsing the power series expansion in (13), we have | (14) |
Further in (14) where 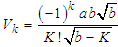 then (14) can be written as
 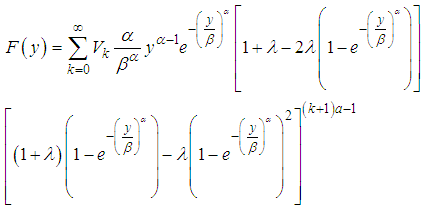 | (15) |
5. Moment
Let 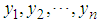 be a random sample of size n from (4), the rth moment can be obtained using
 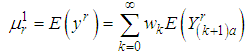 | (16) |
Where  is the rth moment of the exponentiated Weibull density.
5.1. Moment Generating Function (mgf)
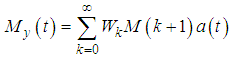 | (17) |
Where,  is the mgf of
  .
.
6. Entropy
The entropy is a measure of degree of dis-orderliness in a system. The Renyl entropy is defined by 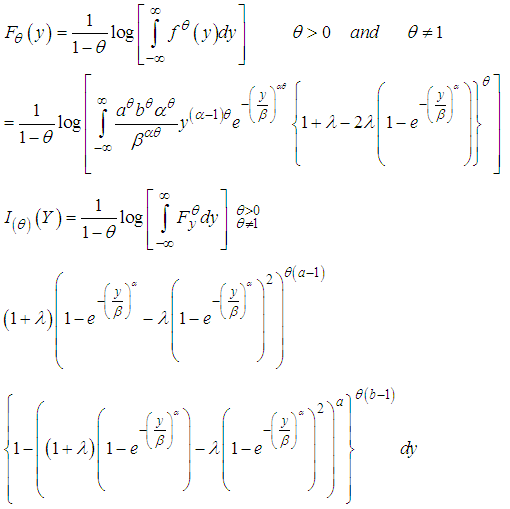 | (18) |
After applying power series, we have the Renyi entropy of the KTWD is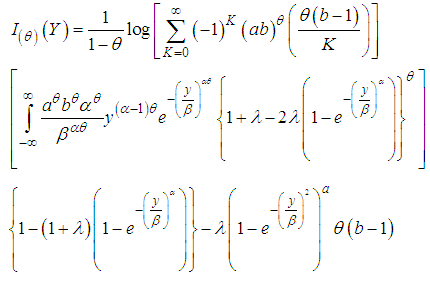 | (19) |
7. Order Statistics
Order statistics make their appearance in many areas of statistical theory and practice. The density  of the
  order statistics for
  , from
  random variables
 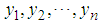 be a random sample from the KTWD. The order Statistics can be obtained using
 | (20) |
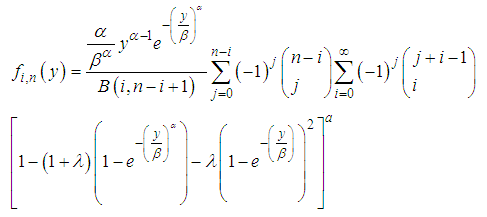 | (21) |
8. Statistical Inference
Let  be a random sample of size n taken from (4), we have the likelihood function of a vector of parameters given as
 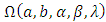 .
.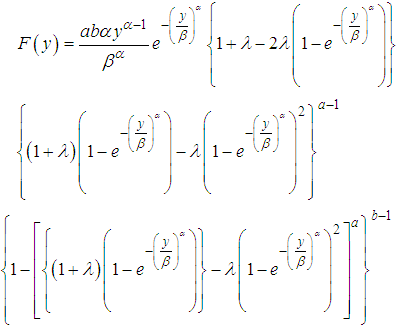 Considering the likelihood function of this we have
 | (22) |
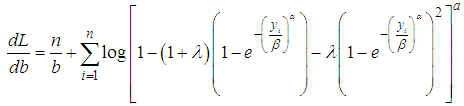
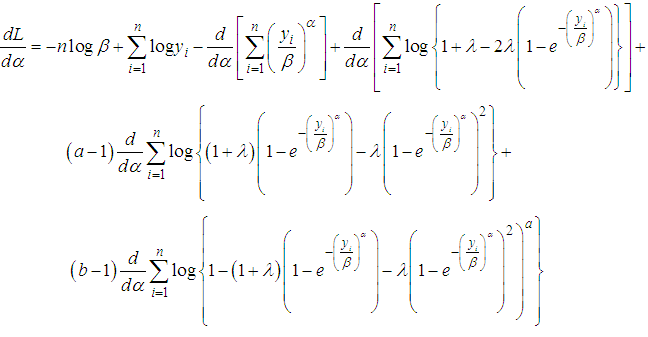
taking the log of (22), we have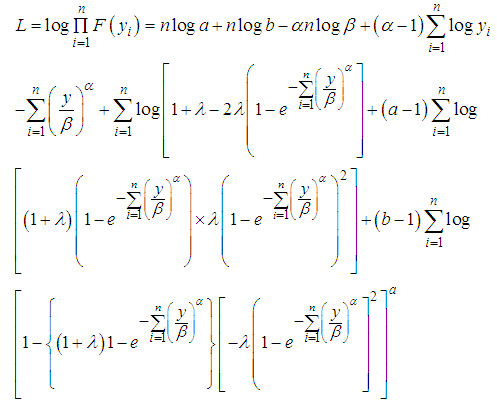 | (23) |
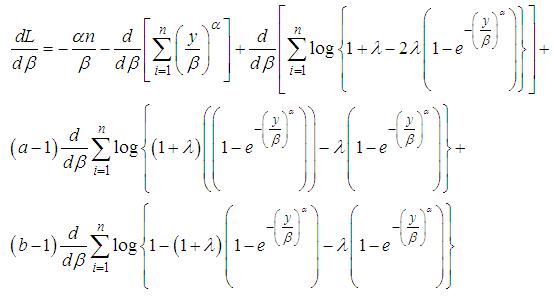
Then the score vector 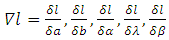 has components,We then differentiate (23) with respect to
 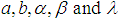 to obtain their MLE
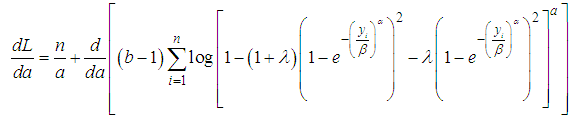 | (24) |
 | (25) |
 | (26) |
 | (27) |
 | (28) |
9. Application
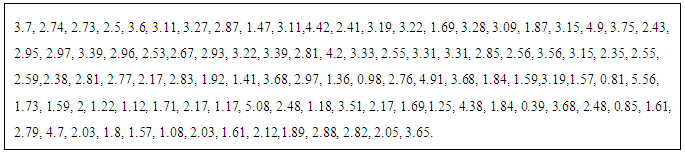
To illustrate the new results presented in this paper, we fit the KTWD distribution to an uncensored data set from Nichols and Padgett, (2006) considering 100 observations on breaking stress of carbon fibres (in Gba). The data are given in table 1.: 3.7, 2.74, 2.73, 2.5, 3.6, 3.11, 3.27, 2.87, 1.47, 3.11, 4.42, 2.41, 3.19, 3.22, 1.69, 3.28, 3.09, 1.87, 3.15, 4.9, 3.75, 2.43, 2.95, 2.97, 3.39, 2.96, 2.53, 2.67, 2.93, 3.22, 3.39, 2.81, 4.2, 3.33, 2.55, 3.31, 3.31, 2.85, 2.56, 3.56, 3.15, 2.35, 2.55, 2.59, 2.38, 2.81, 2.77, 2.17, 2.83, 1.92, 1.41, 3.68, 2.97, 1.36, 0.98, 2.76, 4.91, 3.68, 1.84, 1.59, 3.19, 1.57, 0.81, 5.56, 1.73, 1.59, 2, 1.22, 1.12, 1.71, 2.17, 1.17, 5.08, 2.48, 1.18, 3.51, 2.17, 1.69, 1.25, 4.38, 1.84, 0.39, 3.68, 2.48, 0.85, 1.61, 2.79, 4.7, 2.03, 1.8, 1.57, 1.08, 2.03, 1.61, 2.12, 1.89, 2.88, 2.82, 2.05, 3.65.These data were previously studied by Souza et al. (2011) for beta Frechet (BF), exponentiated Frechet (EF) and Frechet distributions. In the following, we shall compare the proposed KGM and its sub-model (GM) with several other three- and four-parameter lifetime distributions, namely: the Zografos-Balakrishnan log-logistic (ZBLL) (Zografos and Balakrishnan, 2009), the beta Frechet (BF) (Nadarajah and Gupta, 2004 and Souza et al., 2011) and recently the Kumaraswamy Pareto (KP) (Bourguignon et al., 2013) models with corresponding densities: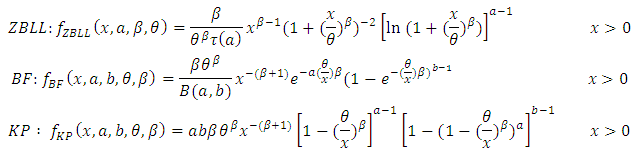 Where
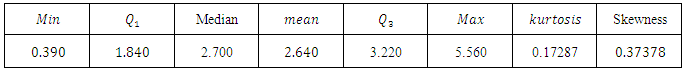
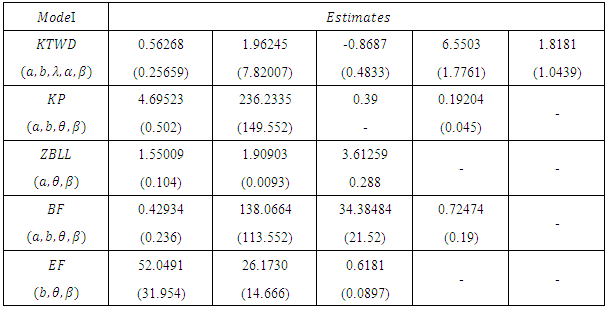
Where  .Table 2 gives the descriptive statistics of the data and Table 3 lists the MLEs of the model parameters for KTWM, GM, BF, KP, ZBLL, BF and EF distributions, the corresponding errors(given in parenthesis) and the statistics
  (where
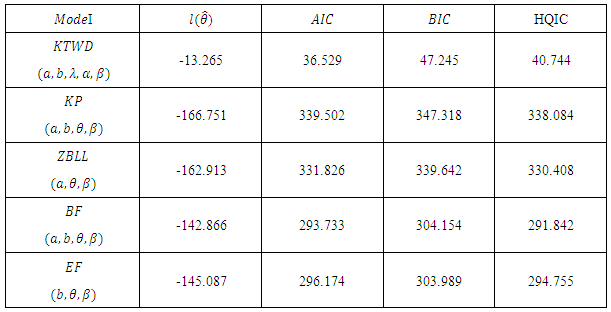
  denotes the log-likelihood function evaluated at the maximum likelihood estimates), Akaike information criterion (AIC), the Bayesian information criterion (BIC) and Hannan-Quinn information criterion (HQIC) was given in table 4 which serves as the basis of comparison.
Table 1. Data on Breaking stress of carbon fibers
 |
| |
|
Table 2. Descriptive Statistics on Breaking stress of Carbon fibres
 |
| |
|
Table 3. MLEs (standard error in parenthesis)
 |
| |
|
Table 4. Criteria for Comparison
 |
| |
|
10. Conclusions
The study of skew models is useful in modeling skew data that brings about new proposed distribution which generalizes the Weibull distribution and the new distribution which includes sub-models. We call the new model the kumaraswamy transmuted Weibull distribution which was studied mathematically and some properties investigated. We also derive the density and distribution function, survival function, hazard function, asymptotic behaviour, moment and moment generating function. Graph 1 depicts the shape of the cdf of and shows that is a proper cdf, graph 2 shows the shape of the pdf. The parameters of the proposed distribution were obtained also the standard error of each estimate as well as the information criteria. Since the kumaraswamy transmuted Weibull distribution has the lowest  AIC, BIC and HQIC values among all the other models, and so it could be chosen as the best model. Additionally, it is evident that the KP distribution presents the worst fit to the first data. Furthermore the new model may be applied to many areas such as survival analysis, insurance, engineering, environmental pollution study etc.
References
| [1] | Ahmad et al. (2016). The kumaraswamy Transmuted –G Family of Distributions: Properties and Applications. Journal of Data science 14(2016), 245-270. |
| [2] | Afify, A. Z., Nofal, Z. M. and Ebraheim, A. N. (2015). Exponentiated trans-muted generalized Rayleigh distribution: a new four parameter Rayleigh distribution. Pak. J. Stat. Oper. Res., 11, 115-134. |
| [3] | Afify, A. Z., Yousof, H. M., Cordeiro, G. M., Ortega, E. M. M. and Nofal, Z. M. (2016). The Weibull Fréchet distribution and its applications. Journal of Applied Statistics. Forthcoming. |
| [4] | Alzaatreh, A., Lee, C. and Famoye, F. (2013). A new method for generating families of continuous distributions. Metron, 71, 63-79. |
| [5] | Cordeiro, G.M. and M. de Castro (2010). A new family of generalized distributions. Journal of Statistical Computation and Simulation, 81: 883-898. |
| [6] | Cordeiro, G.M., E. M. M. Ortega and S. Nadarajah (2010). The Kumaraswamy Weibull distribution with application to failure data. J. Frankl. Inst., 347: 1399-1429. |
| [7] | Elbatal, I (2011). “Exponentiated Modified Weibull Distribution.” Economic Quality Control, 26, 189–200. |
| [8] | Eugene, N., Lee, C., Famoye, F. (2002). Beta Normal distribution and its applications. Communications in Statistics Theory and Methods, 31, 497-512. |
| [9] | Jones, MC (2004). “Family of Distributions Arising from Distribution of Order Statistics.” Test, 13, 1–43. |
| [10] | Khan, M. N. (2015). The modified Beta Weibull distribution with applications. Hacettepe Journal of Mathematics and Statistics, 44, 1553-1568. |
| [11] | Lee C, Famoye F, Olumolade O (2007). “Beta-Weibull Distribution: Some Properties and Applications to Censored Data.” Journal of Modern Applied Statistical Methods, 6, 173–186. |
| [12] | Mudholkar GS, Srivastava DK (1993). “Exponentiated Weibull Family for Analyzing Bathtub Failure rate Data.” IEEE Transactions on Reliability, 42, 299–302. |
| [13] | Pal M, Masoom Ali M, Woo J (2006). “On the Exponentiated Weibull Distribution.” Statistica, 66, 139–147. |
| [14] | Sarhan AM, Zaindin M (2009). “Modified Weibull Distribution.” Applied Sciences, 11, 123–136. |
| [15] | Shahbaz, M.Q., S. Shahbaz and N.S. Butt (2012). The Kumaraswamy inverse Weibull distribution. Pakistan Journal of Statistics and Operation Research, 8: 479-489. |
| [16] | Souza, W.M., G.M. Cordeiro and A.B. Simas (2011). Some results for beta Frechet distribution. Commun. Statist. Theory-Meth., 40: 798-811. |

 Abstract
 Reference
 Full-Text PDF
 Full-text HTML