Ogunde A. A. , Oseghale O. I. , Audu A. T.
Department of Mathematics and Statistics, Federal Polytechnic Ado-Ekiti, Department of Mathematics and Statistics, Joseph Babalola University, Ikeji Arakeji, Federal School of Statistics Ibadan, Nigeria
Correspondence to: Ogunde A. A. , Department of Mathematics and Statistics, Federal Polytechnic Ado-Ekiti, Department of Mathematics and Statistics, Joseph Babalola University, Ikeji Arakeji, Federal School of Statistics Ibadan, Nigeria.
| Email: |  |
Copyright © 2017 Scientific & Academic Publishing. All Rights Reserved.
This work is licensed under the Creative Commons Attribution International License (CC BY).
http://creativecommons.org/licenses/by/4.0/

Abstract
In this paper we developed a three parameter distribution known as Type 1 half logistic Gompertz distribution which is quite flexible and can have a decreasing, increasing and bathtub-shaped failure rate function depending on its parameters making it more effective in modeling survival data and reliability problems. Some comprehensive properties of the new distribution, such as closed-form expressions for the density function, cumulative distribution function, hazard rate function and an expression for order statistics were provided as well as maximum likelihood estimation of the Type 1 half logistic distribution parameters and at the end an application using a real data set was presented.
Keywords:
Type 1 half logistic Gompertz distribution, Maximum likelihood estimation, Bathtub-shape failure rate
Cite this paper: Ogunde A. A. , Oseghale O. I. , Audu A. T. , Performance Rating of the Type 1 Half Logistic Gompertz Distribution: An Analytical Approach, American Journal of Mathematics and Statistics, Vol. 7 No. 3, 2017, pp. 93-98. doi: 10.5923/j.ajms.20170703.01.
1. Gompertz Distribution
The Gompertz (G) distribution is a flexible distribution which can skew to the right and to the left. This distribution is a generalization of the exponential (E) distribution and is commonly used in many applied problems, particularly in real life data analysis (Johnson, Kotz & Balakrishnan 1995, p. 25). The G distribution is considered to be useful in the analysis of survival data, in some sciences such as gerontology (Brown & Forbes 1974), computer (Ohishi, Okamura & Dohi 2009), biology (Economos 1982), and also in marketing science (Bemmaor & Glady 2012). The hazard rate function (hrf) of G distribution is an increasing function and often applied to describe the distribution of adult life spans by actuaries and demographers (Willemse & Koppelaar 2000). The G distribution with parameters  has the cumulative distribution function (cdf) given as
  | (1) |
And the probability density function is given as  | (2) |
A generalization based on the idea of Gupta & Kundu (1999) was proposed by El-Gohary & Al-Otaibi (2013). This new distribution is known as generalized Gompertz (GG) distribution which includes the E, generalized exponential (GE), and G distributions (El-Gohary & Al-Otaibi 2013).
2. Generalized Half Logistic Distribution (GHLD)
A generalization of the half logistic distribution is developed through exponentiation of its cumulative distribution function and termed the Type I Generalized Half Logistic Distribution (GHLD). We define the cumulative distribution function (cdf) of the new type I half-logistic (TIHL) family of distributions by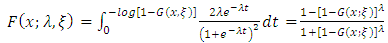 | (3) |
Where  is the baseline cumulative distribution function (cdf) depending on a parameter vector
  and
and  is an additional shape parameter. For each baseline
  we can generate the
  distribution is a wider class of continuous distributions.The corresponding probability density function (pdf) to equation (3) is given by
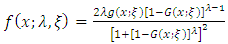 | (4) |
Where  is the baseline probability density function (pdf). Equation (4) will be most tractable when
  and
and  have simple expressions.
3. The Type 1 Half Logistic Gompertz Distribution (T1HLGD)
Putting equation (10 into equation (3) the cumulative density function of (TIHLGD) can be obtained as follows: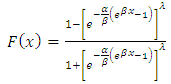 | (5) |
Equation (5) can be simplified as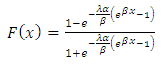 | (6) |
Using the series expansion,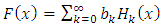 | (7) |
where,  .And
.And  denotes the exponentiated-G cumulative distribution function with parameter
  , we generate an expression for equation (6) as follows:
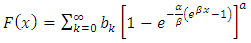 | (8) |
If we consider the series expansion, | (9) |
Valid for  and
and  real and non-integer, equation (8) can be expressed as
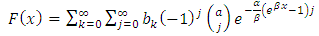 | (10) |
An expression for the probability density function for the type 1 half logistic Gompertz distribution can be obtained by inserting equation (2) in (4)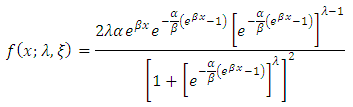 This can be simplified as
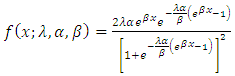 | (11) |
The density function of  can be expressed as an infinite linear combination of
  densities given as
 | (12) |
If we consider the series expansion in equation (8).Valid for  and
and  real and non-integer, equation (12) can be written as,
 | (13) |
The graph of the cumulative density function and the probability density function of the Type 1 half logistic Gompertz distribution (T1HLD) when  is given below
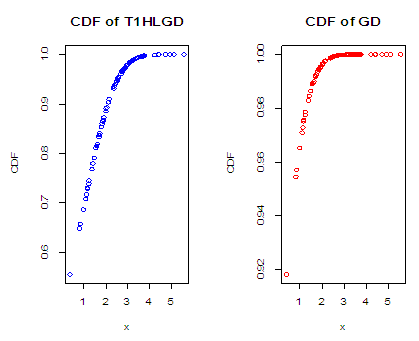
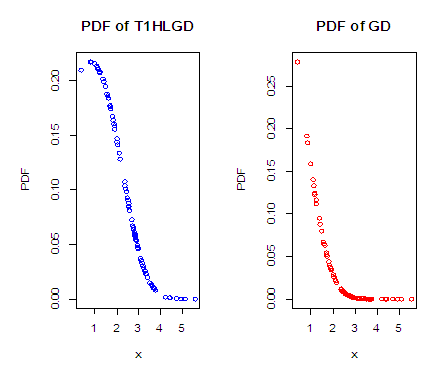 The graph above clearly shows the flexibility of the Type 1 Half logistic Gompertz distribution over the Gompertz distribution.
4. The Asymptotic Properties
Here we investigate the asymptotic properties of the Type 1 half logistic Gompertz distribution when the value of x tends to 0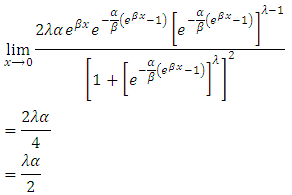 This implies that as x tends to zero the probability density function of T1HLD depends only on the two shape parameters
  .
.
5. Reliability Function
Given a random variable  the reliability function
  is defined as
 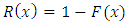 For T1HLGD, its reliability function is given as
 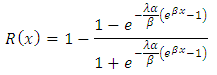 This gives
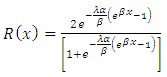 | (14) |
6. Hazard Rate Function
The hazard rate can be obtained using, | (15) |
Substituting equation (11) and (14) in (15), we have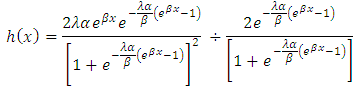 This gives
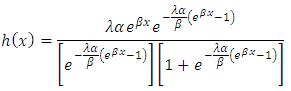 Finally the hazard rate function of T1HLGD is
 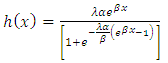 | (16) |
The equation (16) can be called the Type 1 half logistic Gompertz model.
7. Hazard Graph
The T1HLGM hazard graph drawn below depicts the flexibility in the model as its exhibits both the properties of the bathtub and the constant shape failure rate.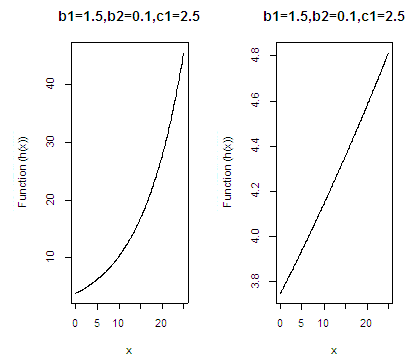
8. Moment Generating Function
The moment generating function of a random variable x is given as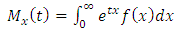 | (17) |
Putting equation (13) in (14), we have
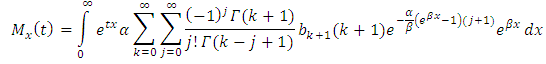 We have,
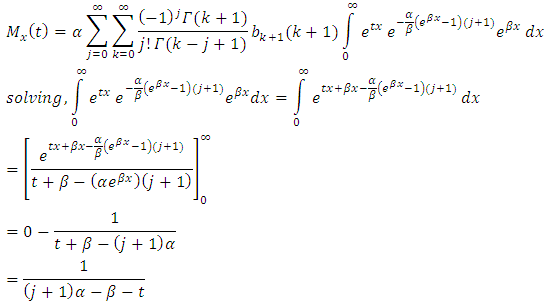 Therefore, the moment generating function of T1HLGD is given as
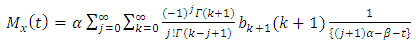 | (18) |
9. The Quartile
The quartile  of order u for the T1HLD distribution is given by the solution of
 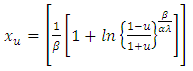 ProofLet
 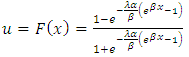 Then,
Then, Therefore,
 This gives,
 Finally this produces the quantile function of order
  given as,
 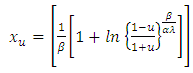 | (19) |
Special quartiles may obtained by equation (16), for example when  ; the upper quartile,
  ; the median,
  ; the upper quartiles.
10. Order Statistics
The order statistics play an important role in reliability and life testing. Let  be a simple random sample from T1HLG distribution with pdf as 13 and cdf as 10 respectively. Let
  denote the ith order statistics, say
  denote the lifetime of an
  system which consist of n independent and identical components. The pdf of
  is given by
 | (20) |
Since,  for
for  , then by using the binomial series expansion of
  , we obtain
  | (21) |
Then substituting for  in equation 13 and 10 respectively, we obtain
 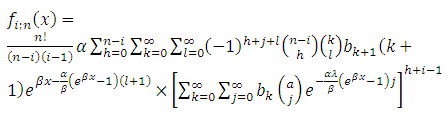 | (22) |
11. Maximum Likelihood Estimation
The maximum likelihood estimation (MLE) is one of the most widely used estimation method for finding the unknown parameters. Let  be an independent random sample from T1HLD. The total log-likelihood is given by
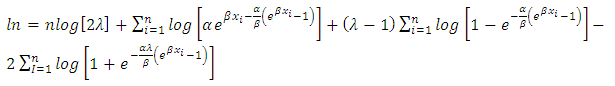 | (23) |
If we let, 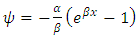 , therefore, the likelihood function can be expressed as:
 | (24) |
The score vector 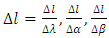 has components
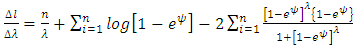 | (25) |
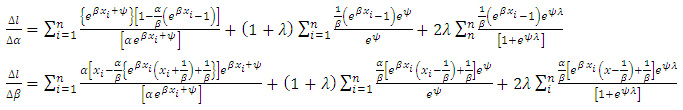 | (26) |
12. Application
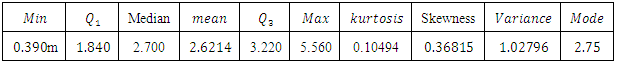
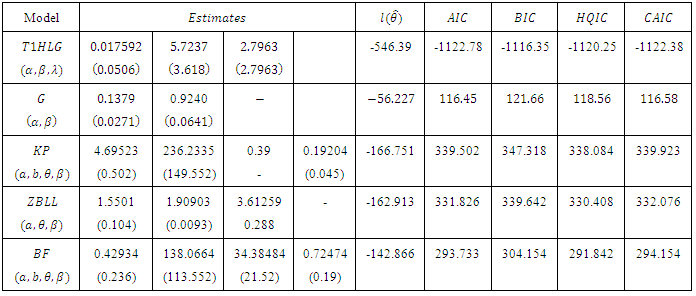
To illustrate the new results presented in this paper, we fit the T1HLD distribution to a real data. The first example is an uncensored data set from Nichols and Padgett (2006) consisting of 100 observations on breaking stress of carbon fibres (in Gba). The data are as follows : 3.7, 2.74, 2.73, 2.5, 3.6, 3.11, 3.27, 2.87, 1.47, 3.11,4.42, 2.41, 3.19, 3.22, 1.69, 3.28, 3.09, 1.87, 3.15, 4.9, 3.75, 2.43, 2.95, 2.97, 3.39, 2.96, 2.53,2.67, 2.93, 3.22, 3.39, 2.81, 4.2, 3.33, 2.55, 3.31, 3.31, 2.85, 2.56, 3.56, 3.15, 2.35, 2.55, 2.59,2.38, 2.81, 2.77, 2.17, 2.83, 1.92, 1.41, 3.68, 2.97, 1.36, 0.98, 2.76, 4.91, 3.68, 1.84, 1.59,3.19,1.57, 0.81, 5.56, 1.73, 1.59, 2, 1.22, 1.12, 1.71, 2.17, 1.17, 5.08, 2.48, 1.18, 3.51, 2.17, 1.69,1.25, 4.38, 1.84, 0.39, 3.68, 2.48, 0.85, 1.61, 2.79, 4.7, 2.03, 1.8, 1.57, 1.08, 2.03, 1.61, 2.12,1.89, 2.88, 2.82, 2.05, 3.65. We shall compare the Type 1 half logistic Gompertz model with its sub- model, the Gompertz model.Table 1 gives the descriptive statistics of the data and Table 2 lists the MLEs of the model parameters for T1HLG and G distributions, the corresponding errors (given in parenthesis) and the statistics  (where
  denotes the log-likelihood function evaluated as the maximum likelihood estimates), Akaike information criterion (AIC), the Bayesian information criterion (BIC), Consistent Akaike information criterion (CAIC) and Hannan-Quinn information criterion (HQIC). Also we provide total time on test plot.
Table 1. Descriptive Statistics on Breaking stress of Carbon fibres
 |
| |
|
TTT PLOT (TOTAL TIME ON TEST PLOT) FOR BREAKING STRESS OF CARBON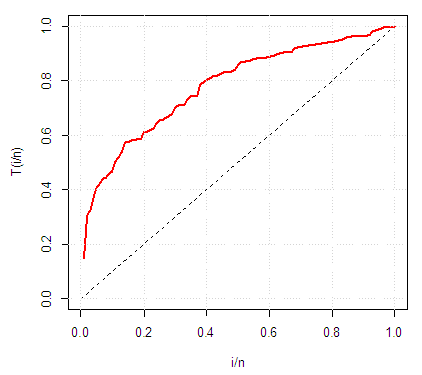
Table 2. MLEs for the Breaking Stress of Carbon Data (standard errors in parentheses) AIC, BIC, HQIC, CAIC
 |
| |
|
13. Conclusions
Since the Type 1 half logistic Gompertz distribution provide a better fit than its sub-model, in modeling a real life data that exhibits a bathtub shape failure rate by having a smaller AIC, BIC, HQIC and CAIC it should be considered as a better model.
References
| [1] | Aarset, M V. How to identify bathtub hazard rate. IEEE Transactions on Reliability, v. 36, p.106{108, 1987. |
| [2] | Gauss M. Cordeiro, Morad Alizadeh and Pedro Rafael Diniz Marinho (2015). The type I half –Logistic family of distributions, Journal of Statistical Computation and simulation: DOI:10.1080100949655.2015:1031233. |
| [3] | Akaike, H. A new look at the statistical model identification. Automatic Control, IEEE Transactions on, v. 19, p. 716{723, 1974. |
| [4] | Broyden, C G, Fletcher, R, Goldfarb, R, D. DF Shanno J. Inst. Math. Appl, v. 6, p. 76, 1970. |
| [5] | Chen, G, and Balakrishnan, N. A general purpose approximate goodness-of-fit test. Journal of Quality Technology. v. 27. p. 154{161, 1995. |
| [6] | Cordeiro, Gauss M, Ortega, Edwin MM, and Nadarajah, Saralees. The Kumaraswamy Weibull distribution with application to failure data. Journal of the Franklin Institute, v. 347, p. 1399{1429, 2010. |
| [7] | R Core Team. R: A Language and Environment for Statistical Computing. R Foundation for Statistical Computing, https://www.R-project.org/, Austria, 2016. |
| [8] | Cordeiro, G. M. & Nadarajah, S. (2011), ‘Closed-form expressions for moments of a class of Beta generalized distributions’, Brazilian Journal of Probability and Statistics 25(1), 14–33. |
| [9] | Economos, A. C. (1982), ‘Rate of aging, rate of dying and the mechanism of mortality’, Archives of Gerontology and Geriatrics 1(1), 46–51. |
| [10] | El-Gohary, A. & Al-Otaibi, A. N. (2013), ‘The generalized Gompertz distribution’, Applied Mathematical Modeling 37(1-2), 13–24. |

 Abstract
 Reference
 Full-Text PDF
 Full-text HTML