Öznur İşçi Güneri, Atilla Göktaş
Department of Statistics, Faculty of Science, Muğla Sıtkı Koçman University, Muğla, Turkey
Correspondence to: Atilla Göktaş, Department of Statistics, Faculty of Science, Muğla Sıtkı Koçman University, Muğla, Turkey.
| Email: |  |
Copyright © 2017 Scientific & Academic Publishing. All Rights Reserved.
This work is licensed under the Creative Commons Attribution International License (CC BY).
http://creativecommons.org/licenses/by/4.0/

Abstract
Regression Analysis (RA) is one of the most used tools for functional relationship. The Ordinary Least Squares (OLS) method is the basic technics of RA. In this study we introduce one of the robust regression approaches, called Least Squares Ratio (LSR), and make a comparison of OLS and LSR according to mean square errors of regression parameter estimations. In this study for certain theoratical model, we generate data for different sample sizes, error variances and number of outliers. It is found that no matter what the sample size is LSR always performs well when there is 1 or more outliers.
Keywords:
Ordinary Least Squares Regression, Least Squares Ratio, Estimation, Data Generation with Outliers
Cite this paper: Öznur İşçi Güneri, Atilla Göktaş, A Comparion of Ordinary Least Squares Regression and Least Squares Ratio via Generated Data, American Journal of Mathematics and Statistics, Vol. 7 No. 2, 2017, pp. 60-70. doi: 10.5923/j.ajms.20170702.02.
1. Introduction
RA is usually used to construct a functional relationship between a dependent variable and certain number of regressors. There are many methods of estimation regression parameters. OLS is used in linear regression analysis due to its simplicity. There are also some other regression models such as Robust Regression [7], Principal Component Regression [3], and Logistic Regression [2]. To choose the “best fitting” line representing the fuctional relationship between dependent and independent variables, the unknown regression coefficients  of the regression model must be estimated [5]. Although the estimation procedure is not unique, the easiest and the most common estimation procedures is OLS used for minimizing the square distance between the observed and the predicted values of the dependent variable. Since OLS method is only taking the distance betweeen observed and predicted into consideration and does not require any statistical assumption, using OLS can be problematic especially when there exists an outlier or nonconstant variance of the error term. In this case we propose to use one of the new robust regression methods called LSR that is removing the effect of any outlier in the data set in place of OLS. In this paper we extend the stduy of [1] in terms of the number of regressors, the number of outliers, the number of different variances of the error term and the number of different sample sizes. Similar comparisons have been made according to mean square errors of the regression coefficients. When there exists no outlier in the data set, OLS method preforms somehow better but not much better. However in the presence of even a single outlier no matter what either the sample size or the degree of variation in the error term LSR always performs better.
2. Ordinary Least Squares Regression (OLS)
OLS method is the simplest and presents the most basic form for regression analysis. The main idea behind it is to minimize the sum of the square of the residual values for the regression model given by (1): | (1) |
where  is a vector representing the dependent variable with n rows and a single column,
  is regressor matrix with n rows and p (p-1 is the number of regressors) columns.
  is the coefficient vector with p rows and a single column. OLS method use the formulation form as follows [8]:
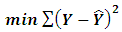 | (2) |
Where  is the px1 vector of regression coefficients, and
  is the predicted values obtained from
  Taking the partial derivatives of (2) with respect to the members of
  and solving for the roots results the OLS estimates as
  in matrix form [5].
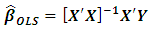 | (3) |
3. Least Squares Ratio (LSR)
As with other forecasting techniques, OLS aims to estimate observed values with zero error: we can indicate this goal by  or
or  Hence, the ordinary least squares approach satisfies this goal by estimating the regression parameters minimizing the sum of
  LSR also starts with the same goal
  as in OLS. However, it proceeds by dividing through by Y and so
  is obtained under an assumption of
  Hence, it is obvious that, as a result, equations
 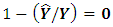 and
and 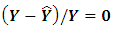 are raised by basic mathematical operations. The final equation is taken into account as the origin of the LSR which minimizes the sum of
  . Consequently the aim of LSR can be written mathematically as follows [4]:
 | (4) |
Formula (4) can also be written as in (5), by using formula (1): | (5) |
Taking the partial derivatives of  with respect to the members of
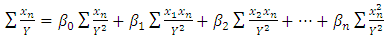
  and setting them equal to zero yields normal equations given (6a)–(6d) [1]:
 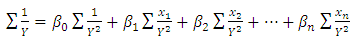 | (6a) |
 | (6b) |
 | (6c) |


 | (6d) |
If the matrix X has full rank p, the estimation  using LSR appears as in Eq. (7):
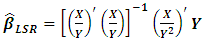 | (7) |
The matrix  is obtained by dividing each regressor by
 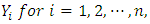 where n is the sample size and p is the number of unknown regression parameters and
  is computed in the same manner by dividing each regressor by
  [1].
[1].
4. The Simulation Study
Our simulation study evaluates linear multiple regression analysis with three independent variables extending the study of [1] as shown in (8). OLS and LSR are compared according to the MSE of 
 | (8) |
Here,  is the dependent variable,
  are independent variables,
  is the error term, and
  is the ith actual regression parameter. For OLS we have
 on the other hand, using LSR we end up with
 For our simulation protocol, the independent variables
  are randomly generated from a normal distribution with
  are set to be equal to 1. so
  Thus, the regression model becomes Eq. (9):
 | (9) |
Finally, errors are randomly generated as Gaussian white noise with variance  It is clear that the dependent variable has a normal distribution with
  and
and 
 We performed our simulations using the statistical package Minitab 16.0 [6], using different sample sizes a
 and multiple error variances as
  For each generation, the dependent and independent variables are computed by the specified protocol. Estimation of regression parameters is then performed by both OLS and LSR. The two methods are compared by the mean square errors for parameter estimation, defined as
  and
and  respectively.The simulation has been replicated for 10 000 times for all combinations of
  and
and 
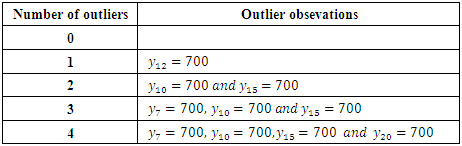
 This generation is also repeated five times for each number of outliers as presented in Table 1.
Table 1. Number of outliers and outlier observation
 |
| |
|
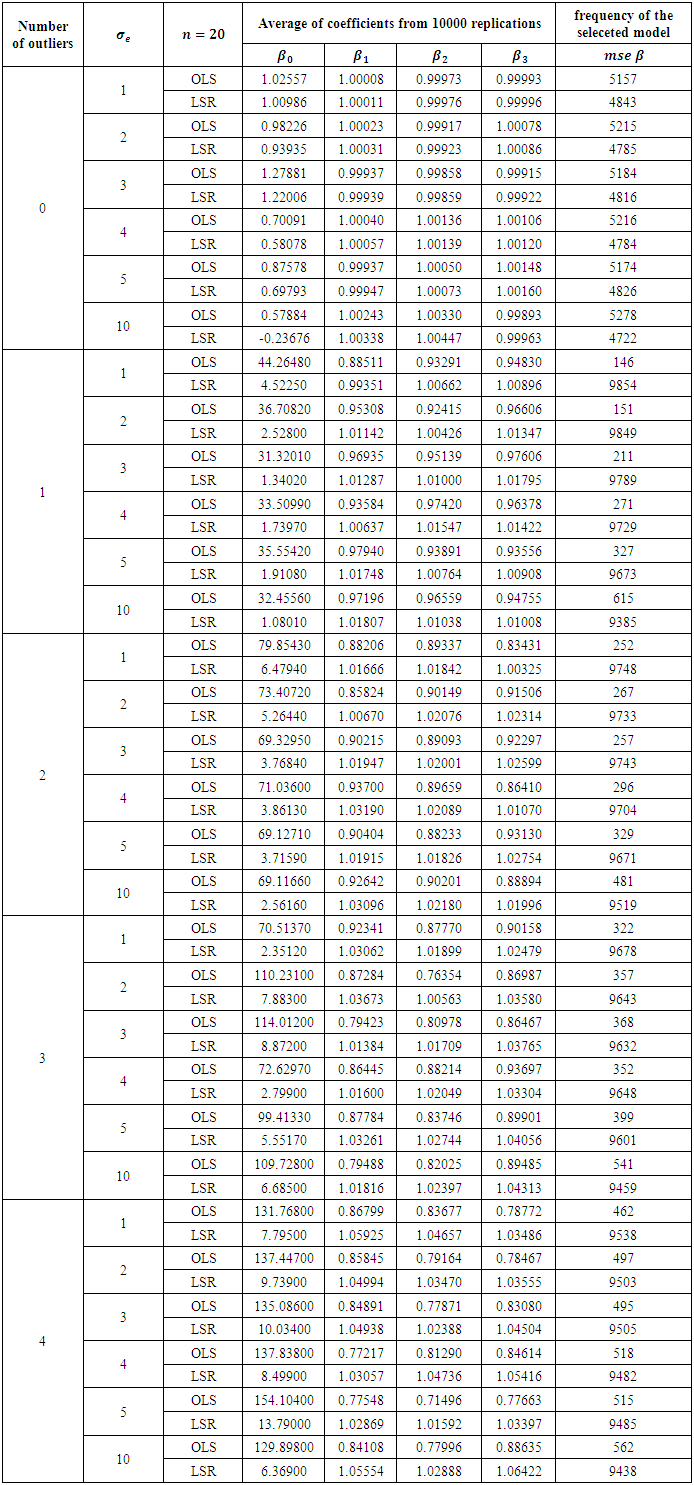
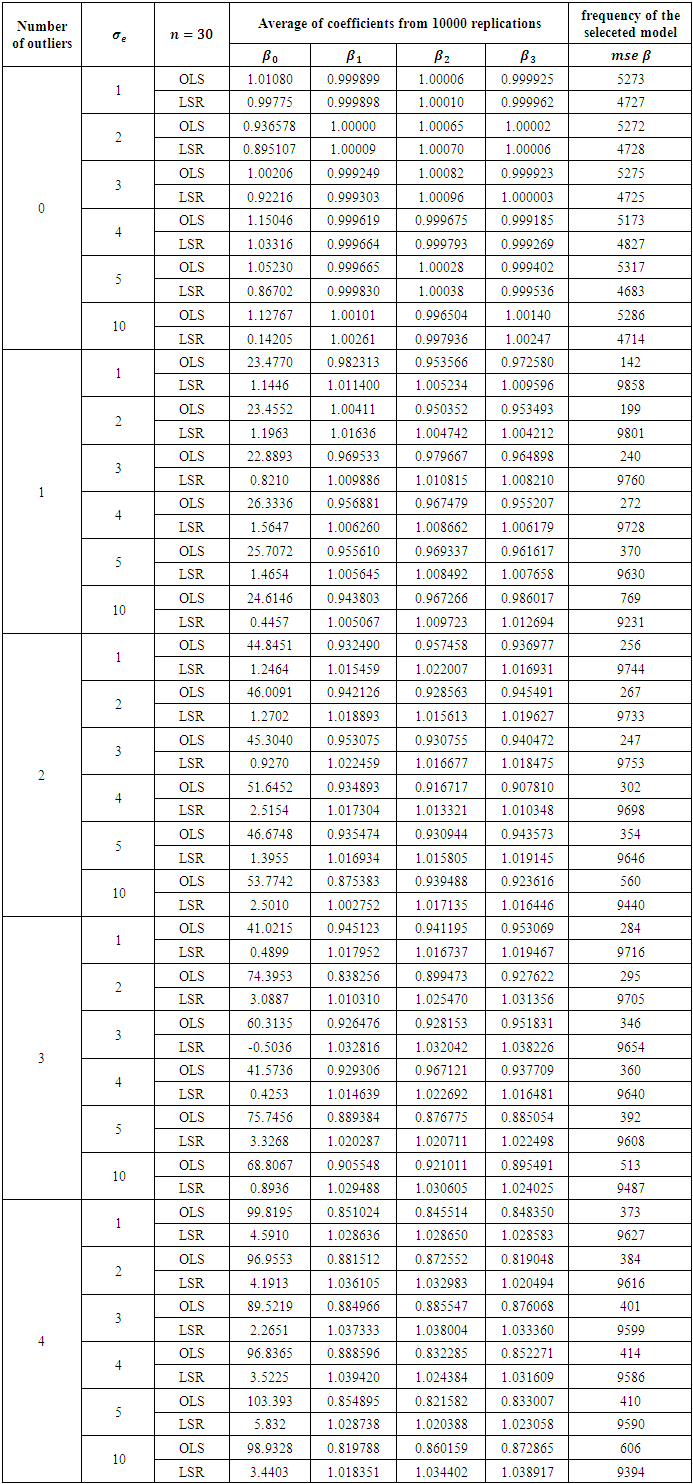
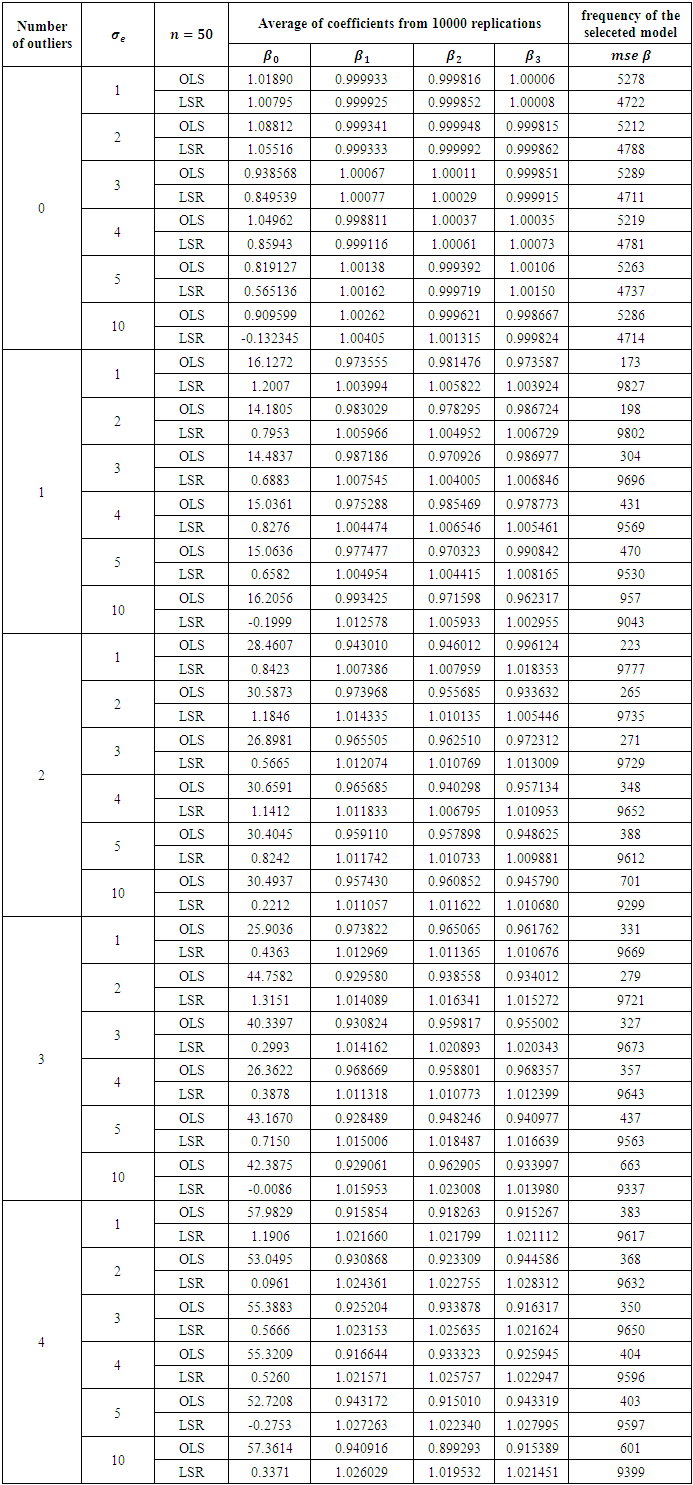
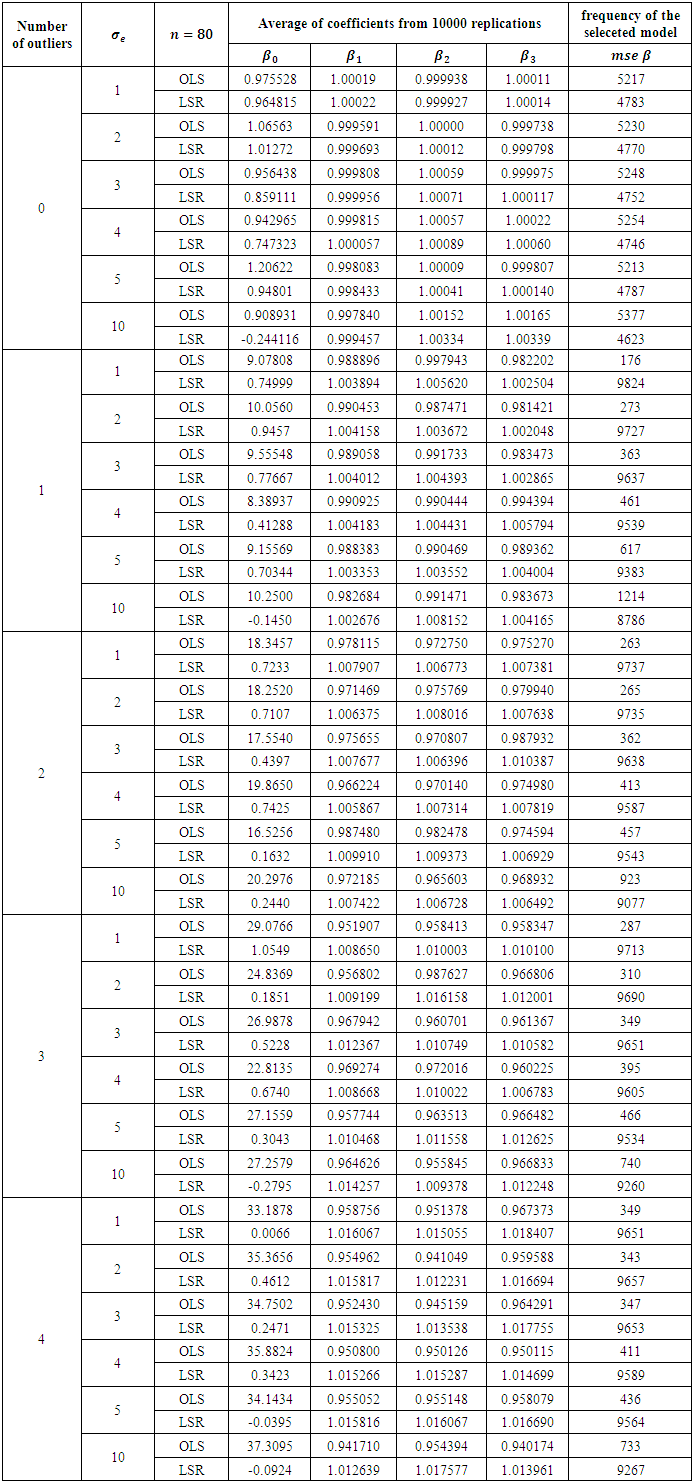
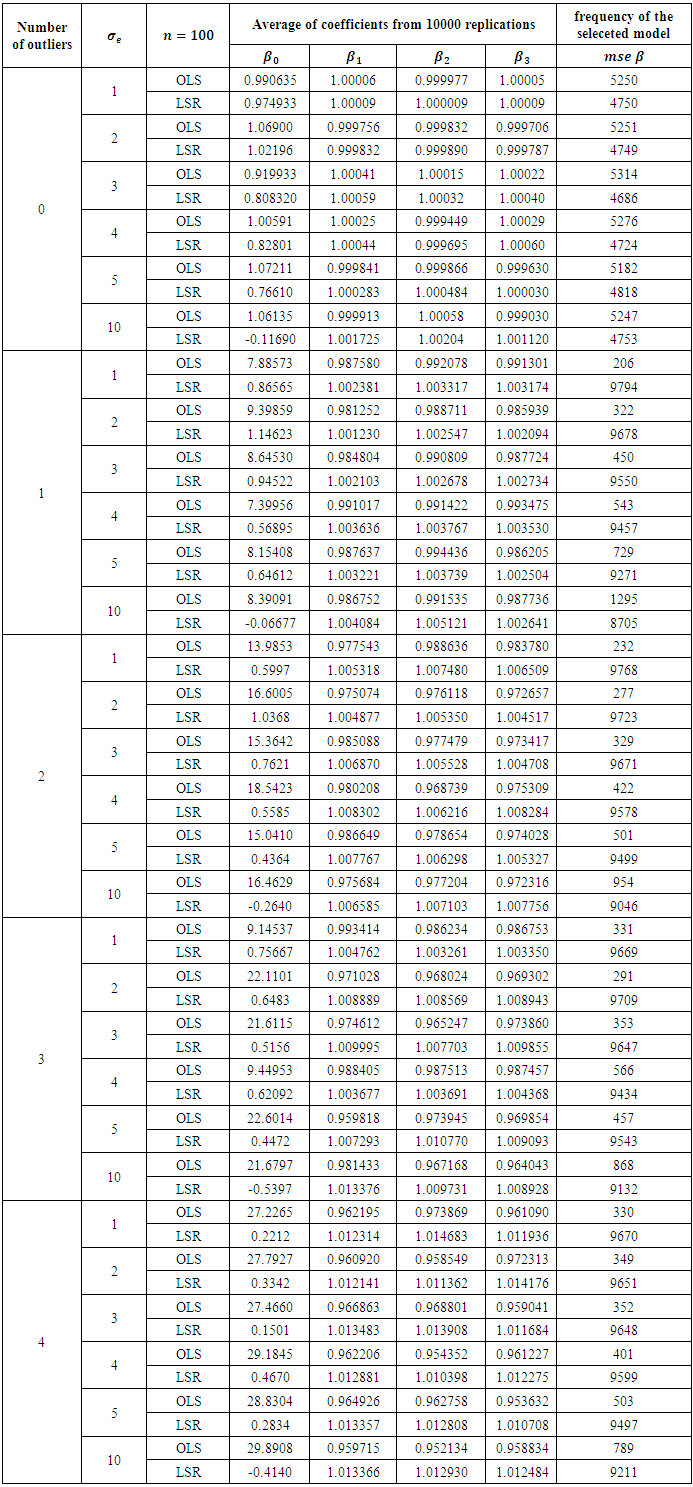
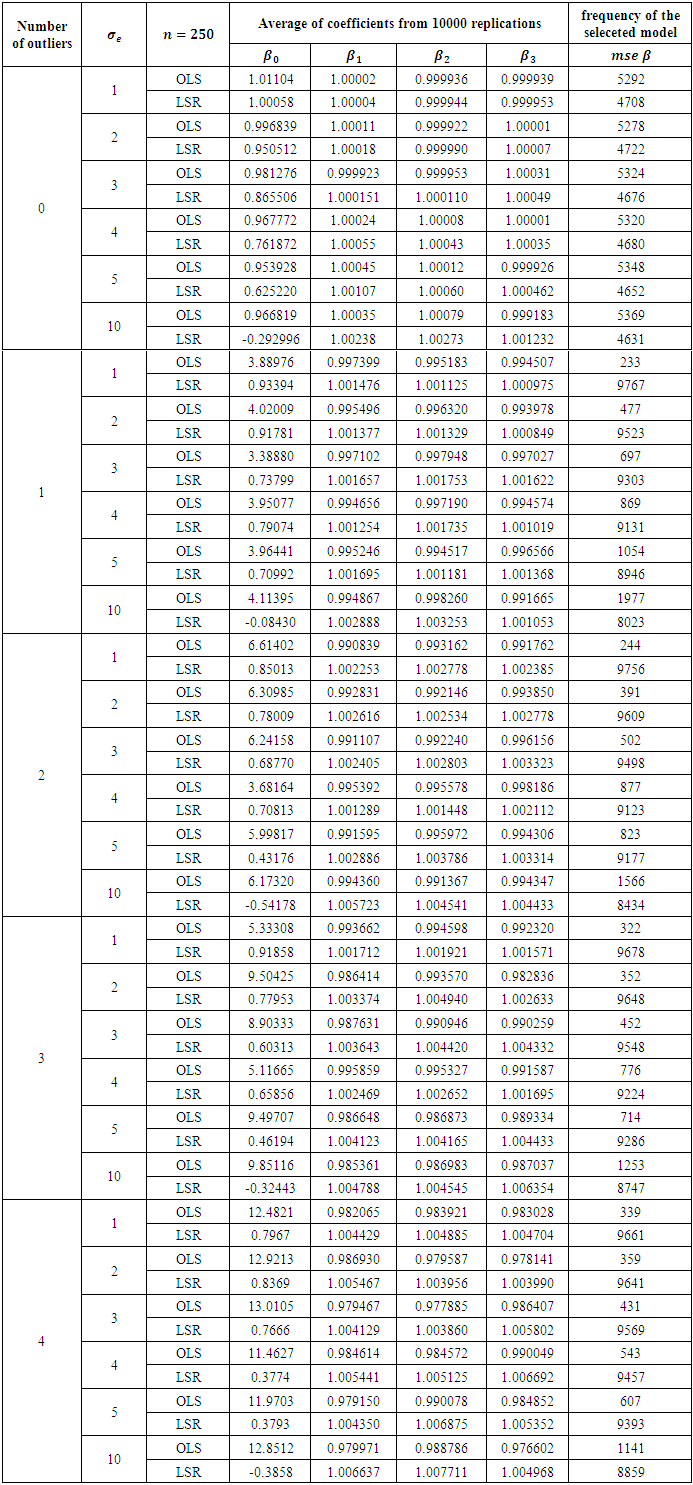
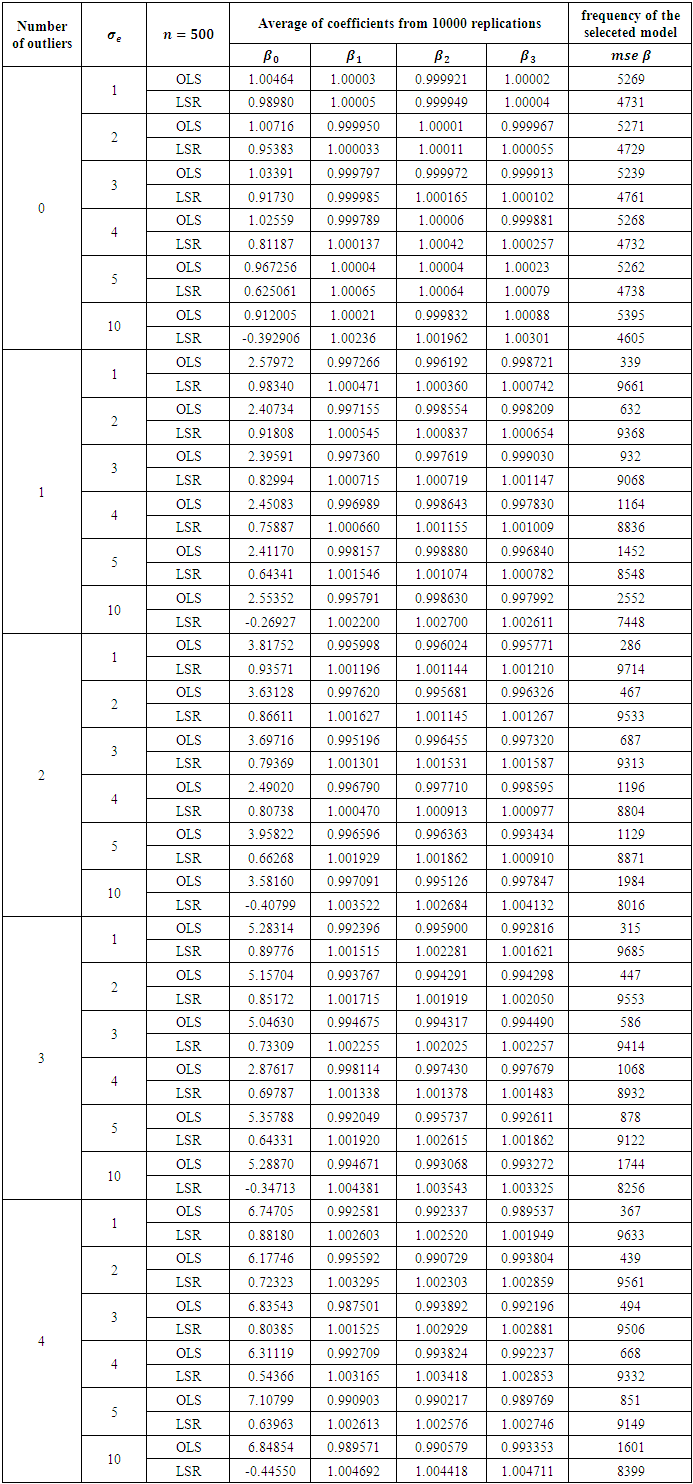
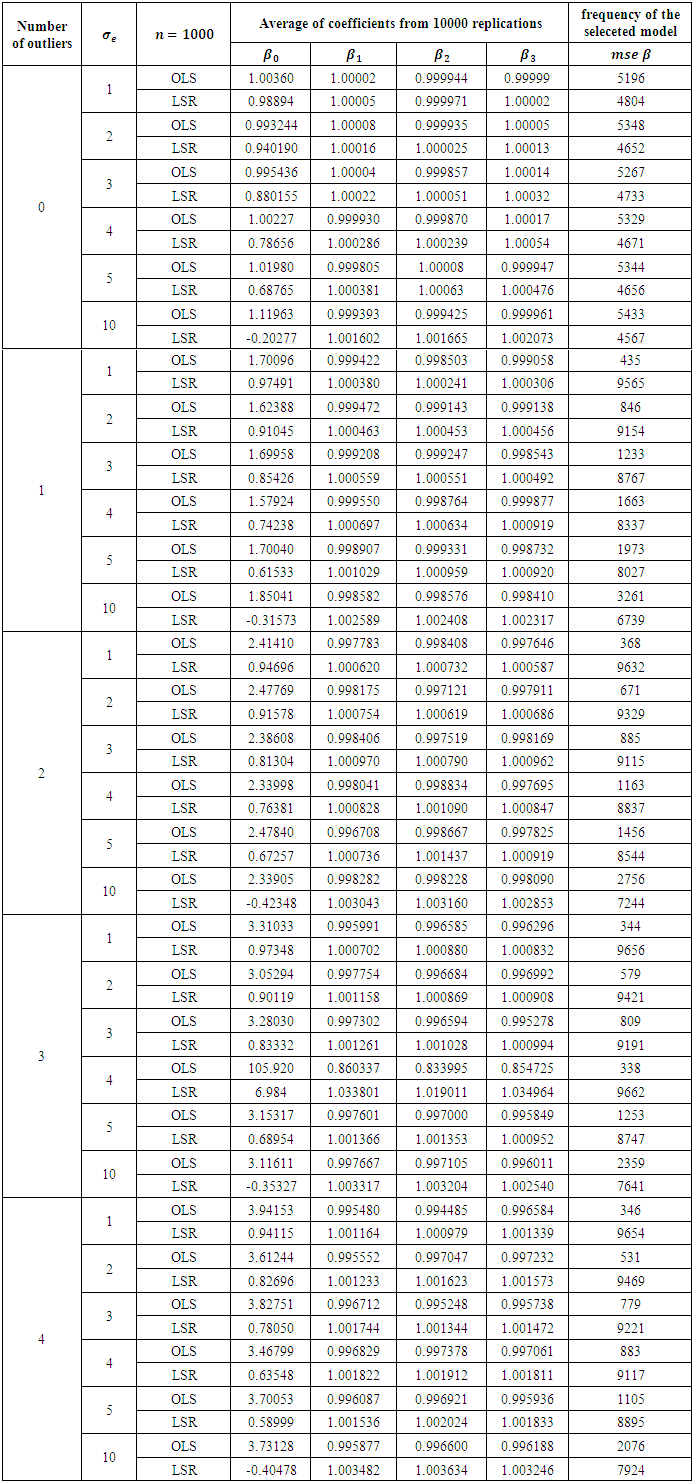
The results with average  values and the number of frequency of the selected model best according to the mean square errors for parameter estimation are presented from Tables 2 to Table 9. The second column of Table 1, labeled
  presents different values of the error variance. The columns
  represent the mean estimation of
  for the 10 000 replications, respectively.
 Table 2. Comparison of OLS and LSR for sample size 20
 |
| |
|
Table 3. Comparison of OLS and LSR for sample size 30
 |
| |
|
Table 4. Comparison of OLS and LSR for sample size 50
 |
| |
|
Table 5. Comparison of OLS and LSR for sample size 80
 |
| |
|
Table 6. Comparison of OLS and LSR for sample size 100
 |
| |
|
Table 7. Comparison of OLS and LSR for sample size 250
 |
| |
|
Table 8. Comparison of OLS and LSR for sample size 500
 |
| |
|
Table 9. Comparison of OLS and LSR for sample size 1000
 |
| |
|
The results in Table 2 is a representation of the smallest sample size 20. From Table 2 it is clearly observed that when there no outlier is presented OLS method is always a little better, but the priority is not that high for any error variance. This can be viewed from the frequency that is higher for the selected method. Addition of any outlier makes LSR always superior no matter what the degree of the error variance. Increasing the sample size from 20 to 30, we obtain the results presented in Table 3. Reading the results from that table, we end up with same conclusion of the previous table. In fact no matter what the sample size is, existence of an outlier makes LSR always superior. This can be observed starting from Table 4 to Table 9. OLS is getting better for large sample sizes but that does never let OLS be better according to the criteria of MSE of the coefficients. This study may be performed in terms of other criteria as well, for instance AIC or BIC. However we do not think that for the presence of an outlier, OLS will get the priority from LSR. This judgement can be justified from the study of (Deniz, Akbilgiç, and Howe, 2011).
5. Discussion and Results
In this study we introduce one of the robust regression approaches, called Least Squares Ratio (LSR), and make a comparison of OLS and LSR according to mean square errors of regression parameter estimations. For a linear model having three regressors, we generate data for different sample sizes, error variances and number of outliers. It is found that no matter what the sample size is LSR always performs well when there is 1, 2, 3 or 4 outliers.  and multiple error variances as
 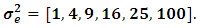 We performed our simulations with 10 000 replications using 8 different sample sizes as
 and 6 different error variances as
  For each generation, the dependent and independent variables are computed by the specified protocol. Estimation of regression parameters is then performed by both OLS and LSR. The two methods are compared by the mean square errors for parameter estimation.According to the simulation results obtained it is found that when no effect of an outlier is presented the classical OLS performs well. However the proposed LSR robust regression method always has the priority against OLS in MSE point of view. Even if there is no outlier it has been proven that LSR is not much worse for any sample sizes and error variances. The study may be extended for more number of explanatory variables. But it is already an extention of (Akbilgic and Deniz, 2009) study in terms of regressors. So no different results is expected. In the meantime since the LSR method is a robust method we suggest that it may be applied for nonlinear regression models using some other criteria.When there is an outlier in the data set we definetely propose LSR method to be used in place of OLS method no matter what the number of regressors or what the sample size is. However one should be careful that LSR can not be used for any zero value of the dependent variable.
References
| [1] | Akbilgiç, O. and Deniz, E. (2009). A novel regression approach: Least squares ratio. Communication in Statistics: Theory Methods 38(9), pp. 1539–1545. |
| [2] | Agresti, A. (2010). Categorical Data Analysis. New York: John Wiley. |
| [3] | Bilodeau, M. and Brenner, D. (1999). Theory of Multivariate Statistics. New York: Springer. |
| [4] | Deniz, E., Akbilgiç, O. and Howe, J.A. (2011). Model selection using information criteria under a new estimation method: least squares ratio. Journal of Applied Statistics. 38:9. 2043-2050. |
| [5] | Mendenhall, W. and Sincich, T. (1994). Statistics for Engineering and the Sciences. Englewood Cliffs, NJ: Prentice Hall. |
| [6] | Minitab. (2010). Minitab 16 statistical software. Minitab Inc., State College, Pennsylvania, USA. |
| [7] | Timm, N.H. (2002). Applied Multivariate Statistics. New York: Springer. |
| [8] | Wonnacott, T.H. and Wonnacott, R.J. (1990). Introductory Statistics for Business and Economics. Ontario, Canada: Wiley. |

 Abstract
 Reference
 Full-Text PDF
 Full-text HTML