-
Paper Information
- Paper Submission
-
Journal Information
- About This Journal
- Editorial Board
- Current Issue
- Archive
- Author Guidelines
- Contact Us
American Journal of Mathematics and Statistics
p-ISSN: 2162-948X e-ISSN: 2162-8475
2016; 6(4): 190-195
doi:10.5923/j.ajms.20160604.08

Modeling and Forecasting Population Growth of Bangladesh
 Abstract
 Reference
 Full-Text PDF
 Full-text HTML
A. B. M. Rabiul Alam Beg1, Md. Rafiqul Islam2
1James Cook University, Australia
2Department of Population Science and Human Resource Development, University of Rajshahi, Bangladesh
Correspondence to: Md. Rafiqul Islam, Department of Population Science and Human Resource Development, University of Rajshahi, Bangladesh.
| Email: |  |
Copyright © 2016 Scientific & Academic Publishing. All Rights Reserved.
This work is licensed under the Creative Commons Attribution International License (CC BY).
http://creativecommons.org/licenses/by/4.0/

Information about the population growth of a country is an important issue that helps keeping the gross domestic product at a standard level without accelerating inflation rate. This is the condition demanded by the International Monetary Fund (IMF) and World Bank (WB) for allocating funds for the development of the underdeveloped countries like Bangladesh. The population growth is the main target of Bangladesh government to keep the level of growth at a manageable level. This paper proposes an autoregressive time trend (ARt) model for forecasting population growth of Bangladesh. Using data from 1965 to 2003 and using the proposed ARt model this paper finds a downward population growth for Bangladesh for the extended period up to 2043.
Keywords: Population growth, Autoregressive time trend (ARt) model, Ordinary least squares (OLS) estimation, Dickey-Fuller unit root test, Cross validity predictive power (CVPP), R2, Shrinkage
Cite this paper: A. B. M. Rabiul Alam Beg, Md. Rafiqul Islam, Modeling and Forecasting Population Growth of Bangladesh, American Journal of Mathematics and Statistics, Vol. 6 No. 4, 2016, pp. 190-195. doi: 10.5923/j.ajms.20160604.08.
Article Outline
1. Introduction
- In the past it is recorded that the population of Bangladesh has had grown at an increasing rate up until 1975. Since then the Government of Bangladesh adopted various policies to control its fast growing population. Policies for example, family planning, educating people, participation of females in the payroll, and a condition on the age at first marriage (year 18 for female and 20 for mate) are in action at present. Bangladesh is a poor country it always depends on foreign aid and donation form received from donor agencies, e.g., IMF, WB, Asian Development Bank (ADB), United Nation Fund for Population Association (UNFPA) and many other smaller donors. These donor countries always put condition to increase the gross domestic product (GDP) per head keeping the inflation at a tolerable level. The government has no option other than those stated above to control its population growth at a manageable level to maintain a healthy per capita GDP. There is another alternative to increase the GDP per person by increasing the domestic product keeping the population at a low level.Islam and Ali (2004a) reported that natural increase of population of Bangladesh is decreasing from 1974 to 1998. In Bangladesh, Islam and Ali (2004b) showed that intrinsic growth rate for female population is starting to reduce from the period 1961-1974. Islam (2012a) observed that intrinsic growth rate for male population is starting to reduce from the period of 1961-1974 up to the period of 1991-2001.To reduce the population growth for Bangladesh a forecast model is proposed in this paper. The proposed autoregressive time trend forecast model predicts the population growth from 2004 to through 2043. This paper is organized as follows. In section 2 data and sources of data and variables of interest are discussed. Section 3 presents the model and the methodology. Empirical results of the forecasts and the forecast model adequacy are given in section 4. Section 5 concludes the paper.
2. Data, Sources of Data and the Variable
- Annual data on Bangladesh population from 1965 to 2003 has been taken from the DX-Data base available in the Computer Lab of the School of Business of James Cook University, Australia (provided by Dr. A. B. M. Rabiul Alam Beg while he was visiting the department of Statistics of Rajshahi University, Bangladesh for his sabbatical assignment). The population is measured in thousands. To find out the population growth rate this paper considers the continuously compounded rule as
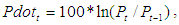 where
where  and
and  are the population at time t and time t - 1 respectively.
3. The Model and the Methodology
- Initially a linear time trend model
 for
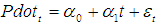
for  was fitted with a little success. This linear time trend model is then updated by including autoregressive terms up to lag 2. The following autoregressive time trend model for forecasting population growth is considered in this paper.
 | (1) |
 is defined as above,
  is a random error term with mean zero and constant (unknown) variance.
  is the linear time trend term,
 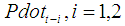 are the lag dependent variables included in (1).
 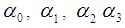 , are the parameters to be estimated along with the unknown error variance.Since this is an autoregressive model we require the condition on the estimated parameters should be

 for stability of the model.For model validation, the cross validation predictive power (CVPP) denoted,
  is computed by
 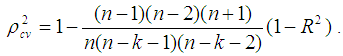 Where n is the number of cases, k is the number of regressors in the model, and R2 is the coefficient of determination of the model. The shrinkage of the model is equal to the absolute value of
 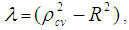 (Steven, 1996). Closer the value of λ to zero, better is the prediction. It is noted that this technique was also used as model validation technique (Islam, 2005; 2007a; 2007b; 2008; 2011; 2012b; 2012c; 2013; 2014; Islam and Beg, 2009; 2010; Islam & Hossain, 2013a; 2013b; 2014a; 2014b; Hossain & Islam, 2013; Islam et al., 2013; 2014; Hossain et al., 2015; Islam & Hossain, 2015; Islam & Hoque, 2015).Model (1) is estimated by the ordinary least squares (OLS) method using SHAZAM. The empirical results with discussion are given in section 4.
4. Empirical Results and Discussion of the Results
- The OLS estimated parameters of the model (1) are reported in the following Table-1.
|
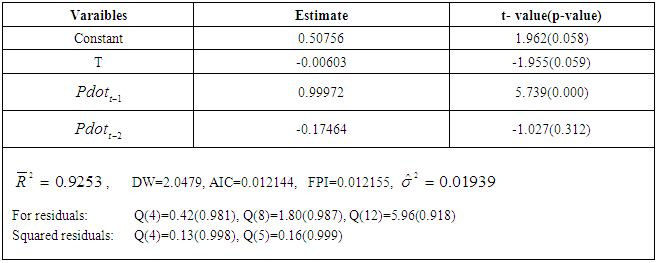
 The
The  indicates that approximately 93% of the total variation in is explained by the explanatory variables of the model. Akaike’s information criterion (AIC), Akaike’s final prediction error (FPE) and estimated error variance are all small. These values are useful for model’s prediction performance.Although the estimate
  is statistically significant at the conventional level, its value is close to one. In that case Dickey-Fuller unit root test (Dickey & Fuller, 1978, 1981) could not distinguish between the unit root and near unit root. Eventually Dickey-Fuller test concludes that the series is nonstationary. However, the Ljung-Box (1978) Q-statistics pass the model adequacy test. Moreover, the condition of the stability of the AR(2)t process is satisfied. Furthermore, the low values of
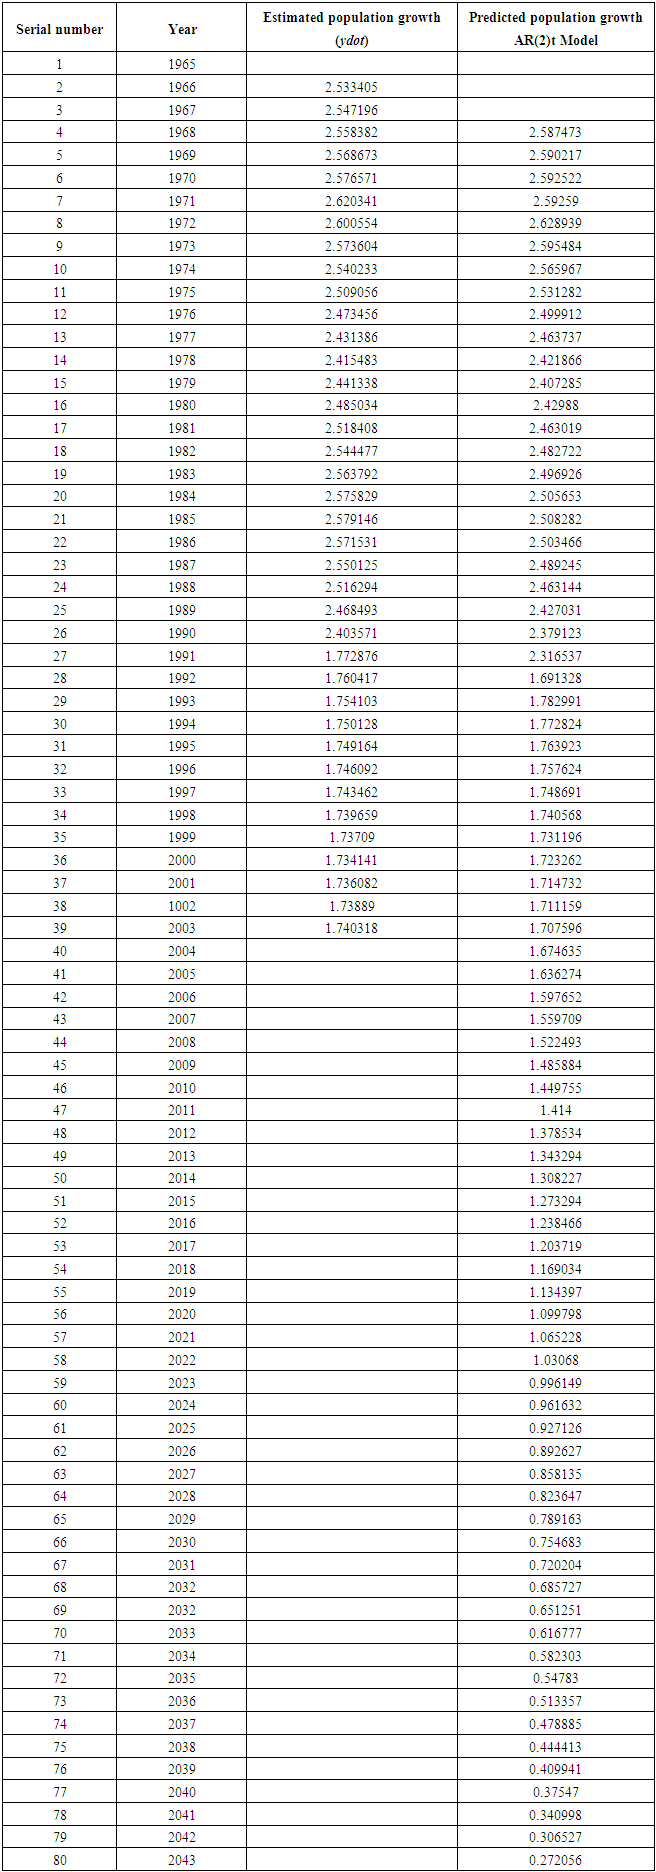
  indicates that the fitted model provides better predictions for the future years. Consequently, one can adopt this model for forecasting purpose. The forecasts based on the estimated model (1) and the observed population growth values are given in table 2. A graph shows the downward movement of the population growth for the years 1965 to 2043.
|
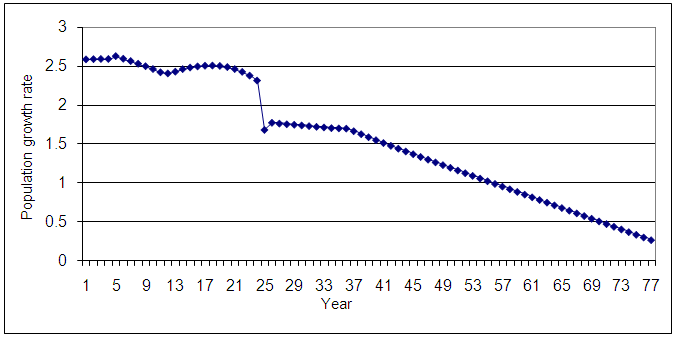 | Figure 1. Predicted population growth rate of Bangladesh for the years 1968-2043 indexed by 1, 2……,77 |
5. Conclusions
- In predicting the population growth of Bangladesh for the years 1965 to 2043 we have adopted an autoregressive with time trend model for the observed growth rate. The estimated autoregressive parameters satisfy the stability conditions. Furthermore, based on the Q statistics,
 and t-test values this model is found to be adequate for forecasting the population growth of Bangladesh. The shrinkage parameter λ also produces a small value indicating that the performance of the prediction model is reliable. This model can be used for various policy decisions purpose.