-
Paper Information
- Previous Paper
- Paper Submission
-
Journal Information
- About This Journal
- Editorial Board
- Current Issue
- Archive
- Author Guidelines
- Contact Us
American Journal of Mathematics and Statistics
p-ISSN: 2162-948X e-ISSN: 2162-8475
2016; 6(4): 170-174
doi:10.5923/j.ajms.20160604.05

Determination of the Best Fit Probability Distribution for Monthly Rainfall Data in Bangladesh
 Abstract
 Reference
 Full-Text PDF
 Full-text HTML
Sanjib Ghosh1, Manindra Kumar Roy2, Soma Chowdhury Biswas3
1Department of Statistics, University of Chittagong, Bangladesh
2Ranada Prasad Shaha University, Narayangaj, Bangladesh
3University of Chittagong, Bangladesh
Correspondence to: Sanjib Ghosh, Department of Statistics, University of Chittagong, Bangladesh.
| Email: |  |
Copyright © 2016 Scientific & Academic Publishing. All Rights Reserved.
This work is licensed under the Creative Commons Attribution International License (CC BY).
http://creativecommons.org/licenses/by/4.0/

An attempt has been made to determine the best fitted distribution to describe the monthly rainfall data for the period of 1979 to 2013 of distantly located stations in Bangladesh such as Chittagong, Dhaka, Rajshahi and Sylhet. The Normal, Lognormal, Gamma, Weibull, Inverse Gaussain and Generalized Extreme Value distributions are fitted for these purposes using the method of L-moment. The performances of the distributions are evaluated using three goodness-of-tests namely Kolmogorov-Smirnov, Anderson-Darling and Chi-Square test. Finally, goodness of fit test result are compared and generalized extreme value distribution is empirically proved to be the most appropriate distribution of the monthly rainfall data for the three selected station only Dhaka station provides good fit gamma distribution.
Keywords: Rainfall, Probability distribution and Goodness-of-fit tests
Cite this paper: Sanjib Ghosh, Manindra Kumar Roy, Soma Chowdhury Biswas, Determination of the Best Fit Probability Distribution for Monthly Rainfall Data in Bangladesh, American Journal of Mathematics and Statistics, Vol. 6 No. 4, 2016, pp. 170-174. doi: 10.5923/j.ajms.20160604.05.
Article Outline
1. Introduction
- Analysis of rainfall data strongly depends on its distribution pattern. It has long been a topic of interest in the fields of meteorology in establishing a probability distribution that provides a good fit to monthly rainfall. Several studies have been conducted in Bangladesh and aboard on rainfall analysis and best fit probability distribution functions.In the advent of global warming, there are increased concerns regarding extreme weather events. As elsewhere across the globe, South Asian countries have been observing an increase in occurrence of extreme climate events in recent decades. Many researchers have found evidence of increasing extreme weather events such as heat waves, cold waves, floods, droughts and severe cyclones over the past few decades. Extreme rainfall events can have severe impacts on human life. An investigation of extreme rainfalls by the scientific community in any country serves several purposes such as: the estimation of extreme rainfalls for design purposes; the assessment of rarity of observed rainfall; and comparison of methods to estimate design rainfalls. This study also focuses the last purpose and a detailed regionalized study is practically useful for the planners and other users.The selection of an appropriate model depends mainly on these evaluations that yield very different conclusions than that of previous researches on this subject. Application of probability distributions to rainfall data have been investigated by several researchers from different regions of the world. Hirose (1994) have found that the weibull distribution is the best fit for the annual maximum of daily rainfall in Japan. Nadarajah and Withers (2001) and Nadarajah (2005) provided the application of extreme value distributions to rainfall data over sixteen locations spread throughout New Zealand and fourteen locations in West Florida, respectively. Further, Nadarajahand Choi (2007) have studied annual maxima of daily rainfall for the years 1961-2001 for five locations in South Korea, and the generalized extreme value distribution is fitted to data from each location to describe the extreme rainfall and to predict its future behavior. They suggested that the Gumbel distribution provides the most reasonable model for four of the five locations considered. Sharma and Singh (2010) analyzed the daily maximum rainfall data of Pantnagar, India for a period of 37 years annually, seasonally, monthly and weakly, and the best fitted probability distribution identified using the least square method among the 16 compared distributions. Deka and Borah (2009) have derived the best fitted probability distribution to describe the annual series of maximum rainfall data for the period 1966 to 2007 of nine distantly located stations in north east India, and they considered only five extreme distributions.The main objective of the study is to determine the best fit probability distribution for monthly rainfall data of some selected stations in Bangladesh and best fit probability distribution was evaluated on the bases of several goodness of fit test. The resulting information is essential for several research programmers, agricultural and hydrological studies in Bangladesh.
2. Study Area
- The daily rainfall data for the period 1979 to 2013 collected by the Department of Meteorology Government of People’s Republic of Bangladesh have been employed in this study. We used long duration data to take appropriate statistical decision. In this study, the period between the months of May to October has been considered as the rainy season or monsoon period but in this period its rains irregularly. Because of this irregular variation we used monthly amount of rainfall data rather than daily or weekly rainfall data. The whole Bangladesh has divided into four regions according to the amount of monthly rainfall. Thus four important meteorological stations names Chittagong, Dhaka, Rajshahi and Sylhet have been selected from the four zones to analysis the rainfall data.Chittagong: The port city Chittagong is the second largest city in Bangladesh. It is situated in the south-eastern portion of the country and was built on the bank of the Kornofulli River. Its graphical coordinates are 22°21′49″North, 91°48′12″East. The total area of the district 5282.98 square kilometer. The average monthly rainfall is 441.58 mm of the rainy season considering the data set 1979 to 2013.Dhaka: Dhaka is the capital of Bangladesh. It’s located at 23°42′0″North, 90°22′30″ East on the eastern banks of the Buriganga River. The geographical area of Dhaka is 815.85 square kilometers. The average monthly rainfall is 310.24 mm during the period 1979 to 2013.Rajshahi: Rajshahi is famous for its silk industries. Rajshahi is also well known for its fruits, especially for Mango and Lychee. It’s located at 24°22′26.54″ North, 88°36′34.23″ East in the north eastern region of Bangladesh. The average monthly rainfall of Rajshahi during the period 1979 to 2013 is 231.38 mm.Sylhet: Sylhet is a major city in north-eastern Bangladesh. It’s located on the banks of the surma River and is surrounded by the Jaintia, Khasi and Tripura hills. The Sylhet region is well known for its tea gardens and tropical forests. It’s located at 24°53′30″ North, 91°53′00″ East in the north eastern region of Bangladesh. The average monthly rainfall of Sylhet during the period 1979 to 2013 is 585.58mm.
3. Methodology
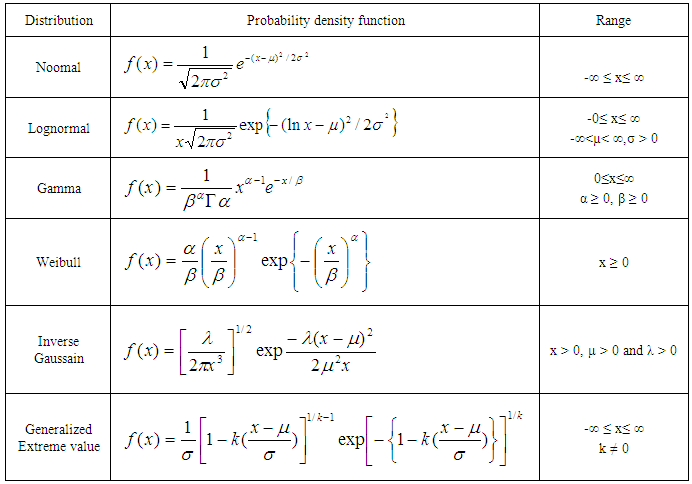
- In order to describe the amount of monthly rainfall data, it is necessary to identify the distributions, which best fit to the data. In this study, six continuous probability distribution viz. Normal, Lognormal, Gamma, Weibull, Inverse Gaussain and Generalized Extreme value distribution are considered to test the goodness of fit. The analysis of rainfall data is prepared with the help of EASY FIT and MICROSOFT EXCEL software’s. The probability density function of above distribution are exhibited in the following table 1.
|
3.1. Method of L-moment
- The L-moments (LMOM) were introduced by Sillitto (1951) and comprehensively reviewed by Hosking (1986, 1990) for estimating the parameters of certain statistical distributions. The L-moments are linear functions of the expectations of order statistics and they can be viewed as an alternative system of describing shapes of probability distributions. The main advantage of using the method of LMOM are that the parameter estimates are more reliable (i,e smaller mean-squared error estimation) and are most robust, and usually computationally more tractable than the conventional moments and maximum likelihood.Let X1:n, X2:n, X3:n,…………Xn:n be a sample from a continuous distribution function F(.) with quantile function Q(F) and let X1:n, ≤ X2:n ≤X3:n ≤…………≤ Xn:n denotes the order statistics. Then rth L-moment
 is given by
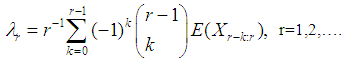 The details on the estimation of parameters for each of the aforesaid distributions can be found in Hosking and Wallis (1997).
3.2. Goodness-of-Fit Tests (GOF)
- GOF is used to determine the best model among the distributions tested in rain characteristic. The goodness-of-fit test is performed in order to test the following hypothesis:H0 : The amount of monthly rainfall data follow the specified distributionH1 : The amount of monthly rainfall data do not follow the specified distributionA couple of goodness-of-fit test have been conducted such as Kolmogorov-Smirnov test, Anderson-Darling test along with the chi-square test at significance level (α=0.05) for choosing the best probability distribution (Sharma and Singh, 2010).
3.2.1. Kolmogorov-Smirnov Test
- The Kolmogorov-Smirnov test (Chakravart, Laha, and Roy, 1967) is used to decide if a sample comes from a population with a specific distribution. The Kolmogorov-Smirnov (K-S) test is based on the empirical distribution function (ECDF). Given N ordered data points Y1, Y2, ..., YN, the ECDF is defined as
 Where n(i) is the number of points less than Yi and the Yi are ordered from smallest to largest value. This is a step function that increases by 1/N at the value of each ordered data point.Test Statistic: The Kolmogorov-Smirnov test statistic is defined as
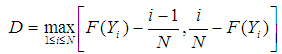 Where F is the theoretical cumulative distribution of the distribution being tested which must be a continuous distribution (i.e., no discrete distributions such as the binomial or Poisson), and it must be fully specified (i.e., the location, scale, and shape parameters cannot be estimated from the data).The hypothesis regarding the distributional form is rejected if the test statistic, D, is greater than the critical value obtained from a table.
3.2.2. Anderson –Darling Test
- The Anderson-Darling test (Stephens, 1974) is used to test if a sample of data comes from a population with a specific distribution. It is a modification of the Kolmogorov-Smirnov (K-S) test and gives more weight to the tails than does the K-S test. The K-S test is distribution free in the sense that the critical values do not depend on the specific distribution being tested. The Anderson-Darling test makes use of the specific distribution in calculating critical values. This has the advantage of allowing a more sensitive test and the disadvantage that critical values must be calculated for each distribution. Currently, tables of critical values are available for the normal, lognormal, exponential, Weibull, extreme value type I, and logistic distributions.The Anderson-Darling test statistic is defined as
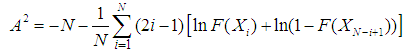 F is the cumulative distribution function of the specified distribution. Note that the Yi are the ordered data.The critical values for the Anderson-Darling test are dependent on the specific distribution that is being tested. Tabulated values and formulas have been published (Stephens, 1974) for a few specific distributions (normal, lognormal, exponential, Weibull, logistic, extreme value type 1). The test is a one-sided test and the hypothesis that the distribution is of a specific form is rejected if the test statistic, A, is greater than the critical value.
3.2.3. Chi-square Test
- The Chi-square test assumes that the number of observations is large enough so that the chi-square distribution provides a good approximation as the distribution of test statistic. The Chi-squared statistic is defined as
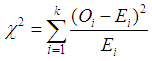 WhereOi = observed frequencyEi = expected frequency‘i’= number observations (1, 2, ……k)Calculated by Ei = F(X2) – F(X1)F = the CDF of the probability distribution being testedThe observed number of observation (k) in interval ‘i’ is computed from equation given belowK = 1+log2nn = sample sizeThis equation is for continuous sample data only and is used to determine if a sample comes from a population with a specific distribution (Sharma and Sing, 2010).
4. Result and Discussion
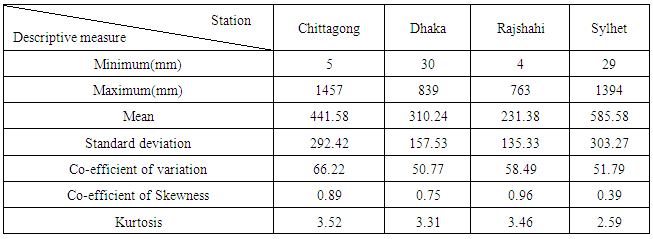
- The statistical parameters for the amount of monthly rainfall data of four selected stations are summarized in Table 2. Where the minimum, maximum, mean, standard deviation (SD), coefficient of variation (CV), skewness and kurtosis are given.
|
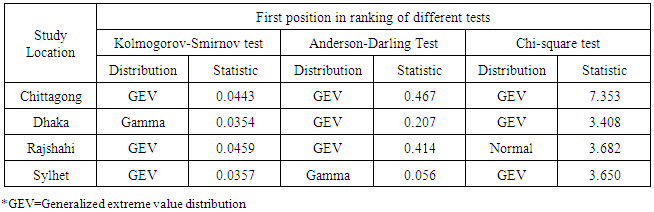
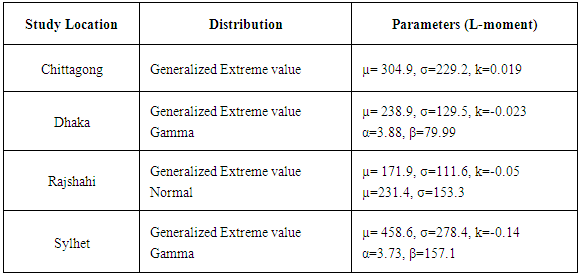
 for monthly rainfall data were computed for six probability distributions. The probability distribution having the first rank along with their test statistic is presented in Table 3.
|
|
|
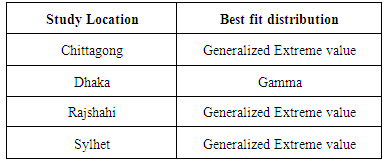
5. Conclusions
- A systematic assessment procedure was applied to evaluate the performance of different probability distribution with view to identifying the best fit probability distribution for monthly rainfall data at four selected stations of Bangladesh. The data showed that the monthly minimum and maximum rainfall at any time at any station ranged from 4 mm (Rajshahi) to 1457 mm (Chittagong) which is obviously indicating a huge range of fluctuation during the period of the study. It was observed that the Generalized Extreme Value distribution provides a good fit of the three selected station only Dhaka station provides good fit Gamma distribution to the monthly rainfall data of during rainy season in Bangladesh. Identifying the distribution amount of monthly rainfall data could have a wide range of applications in agriculture, hydrology, engineering design and climate research.