-
Paper Information
- Next Paper
- Paper Submission
-
Journal Information
- About This Journal
- Editorial Board
- Current Issue
- Archive
- Author Guidelines
- Contact Us
American Journal of Mathematics and Statistics
p-ISSN: 2162-948X e-ISSN: 2162-8475
2016; 6(4): 155-161
doi:10.5923/j.ajms.20160604.03

Statistical Modelling of Distance Associated Marriage Migration with Special Reference to Western Uttar Pradesh (India)
 Abstract
 Reference
 Full-Text PDF
 Full-text HTML
C. B. Gupta1, Brijesh P. Singh2, Sachin Kumar1
1Department of Mathematics, Birla Institute of Technology and Science Pilani-Pilani Campus, India
2Faculty of Commerce, Banaras Hindu University, Varanasi, India
Correspondence to: Sachin Kumar, Department of Mathematics, Birla Institute of Technology and Science Pilani-Pilani Campus, India.
| Email: |  |
Copyright © 2016 Scientific & Academic Publishing. All Rights Reserved.
This work is licensed under the Creative Commons Attribution International License (CC BY).
http://creativecommons.org/licenses/by/4.0/

In the present study, the marriage distance pattern of females from western Uttar Pradesh (U.P.), India is analysed. The suitability of Pareto-exponential function in the study region is tested and two other models viz; Gamma and Weibull distribution with two parameters are proposed. The performance of all the three above models across different categories is compared, and then to observe the effect of various covariates on marriage distance Gamma regression is applied. Based on the study, interesting pattern and relationship through the models applied to the data are found.
Keywords: Marriage, Migration, Regression, M.S.E., Caste and religion etc
Cite this paper: C. B. Gupta, Brijesh P. Singh, Sachin Kumar, Statistical Modelling of Distance Associated Marriage Migration with Special Reference to Western Uttar Pradesh (India), American Journal of Mathematics and Statistics, Vol. 6 No. 4, 2016, pp. 155-161. doi: 10.5923/j.ajms.20160604.03.
Article Outline
1. Introduction
- In any society, migrations are caused by many factors including social, economic and political. Among these, marriage is an important source of this movement in India, particularly, north India. It is by far the largest form of migration in India and is close to universal for every female in rural areas. It is observed that it is, predominantly, the females who migrate. Every girl has to move to her in-law’s place of residence after marriage. 91.2% females reported marriage as the cause of dislocation of their residence in rural areas ([9]). Among all forms of migration, female marriage centric migration alone constitutes 64.9% share ([2]).All the studies based on developing countries considered the female migrants passive and tied movers, means they have to move as a result of marriage and social customs prevailed in the region ([5] [14], [1], [3]). Though, net migration is zero, as the out-migrants females are balanced by in-migrant females, but, it leaves a significant socio-economic impact on both the origin and destination place by bringing about social and cultural change. Despite such a high magnitude and growing significance, female marriage migration has been little explored in migration studies. It is to be noted that pattern of female marriage migration has been much skewed depending on the social norms and customs prevailed in a particular society.During the past few decades, many attempts have been made to understand the relationship between marriages and distance ([8], [10], [11], [7], [16], [21], [15], [4], [20]). In Indian context, [16] first, proposed a probability model to explain the distribution of distance associated with marriage migration, under the assumptions (i) the number of marriages are proportional to the area of the distance interval d1 to d2 i.e. number of marriages with distance interval (d1<d2<D) are proportional to
 (ii) after the distance D in a particular direction, the distribution of distance follows an exponential form i.e. the number of marriages in distance interval d1 to d2 (D< d1< d2) is;
 [21], again, modified the above discussed model as;If M is the number of marriages at distance r, then;
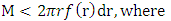
 [4] proposed the Pareto-exponential function developed by [8] to the data taken from Bangladesh and found it suitable than the models proposed by [16] and [21]. [13] applied Exponential, Pareto and Pareto-Exponential function to Bangladesh data and tested the suitability of three models. Recently, [18] proposed a three parameter Weibull distribution and applied it satisfactorily to the data collected from Bihar. But all the above models suffered from certain drawbacks. Secondly, all the above discussed models were tested on the data taken from eastern Utter Pradesh, Bihar and Bangladesh, while, our study is based on the data collected from western Utter Pradesh. This part of the state is quite different from the other parts, in terms of geographical, economic and social aspects. Higher per capita income, availability of fertile agriculture land, growth of industrial units, well developed road and transport facilities and proximity to national capital region set this region apart from the other regions and generated an interest to the researcher to study the marriage-distance pattern of the region. To the best of our knowledge, no study has been undertaken in this region to study the distribution of marriage-distance pattern.In the present work, we applied the Pareto-Exponential function to test its suitability in the region and proposed two other probability distributions to describe the behaviour pattern of marriage-distance relationship. The purpose of this work is, therefore, to compare the applicability of basic distribution to the data and to provide a set of logical basis to understand the marriage-distance relationship clearly. Therefore, our proposed work has four objectives to (a) use of Pareto-Exponential function, Gamma distribution and Weibull distribution with two parameters (b) apply these models and to investigate how well these models fit the data (c) comparison of the models (d) to investigate the relationship between distance and various covariates through a Gamma regression model.
2. Description of Data
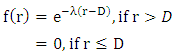
- The data used in the present study have been collected from the rural area of district Meerut (U.P.). There has been a rapid spurt of industrial development in and around the city during the past decades and it has become a major hub for various economic, cultural, educational and developmental activities over the years. The baseline survey of nearly 3600 households was undertaken to get the reliable and relevant data pertaining to the problem under study. Following the guidelines from [17] data were collected from three types of villages through a stratified clustered sampling method. These three types of village have been identified as semi-urban, remote and growth centres.The villages from district Meerut are divided into two groups as per their distance from the boundary of Meerut Nagar Nigam, to constitute two strata. The first stratums consists of the villages less than 8 km. of distance, and are termed as semi-urban villages, while the rest are called as remote villages and belonged to second stratum. For the selection of growth centres, villages, which are located nearby industrial areas and sugar mills, are taken into consideration.Table 1 displays the frequency distribution of four sets of data, classified according to their religion/category, and shows the number of marriages along with their mean and variances. Distance interval is kept at 15 km due to well-developed road and transport facilities and improved communication system. Another reason for this is attributed to the fact that village and gotra (clan) endogamy is strictly prohibited in this region. Boys and girls from the same village and gotra (clan) are considered to be brothers and sisters. In majority of cases, villages from same gotra (clan) are situated nearby.
|
3. Description of Models
- (a). Pareto-Exponential function: Morril and Pitts (1967) proposed a function as
 | (1) |
 | (2) |
 | (3) |
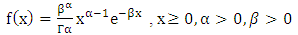 where α is the shape parameter and determines the shape of distribution curve, and β denotes the rate parameter. Mean and variance of the distribution is given as follows;
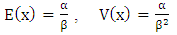 (c). Weibull distribution: The probability density function of a Weibull distribution is;
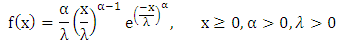 Where α and λ are shape and scale parameter respectively. The mean and variance are given as follows;
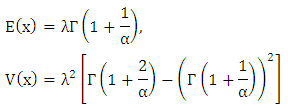
3.1. Parameter Estimates
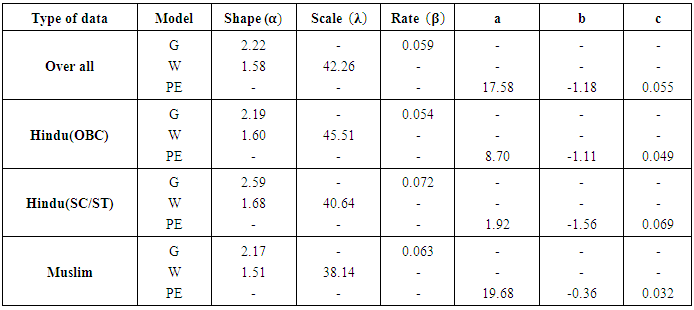
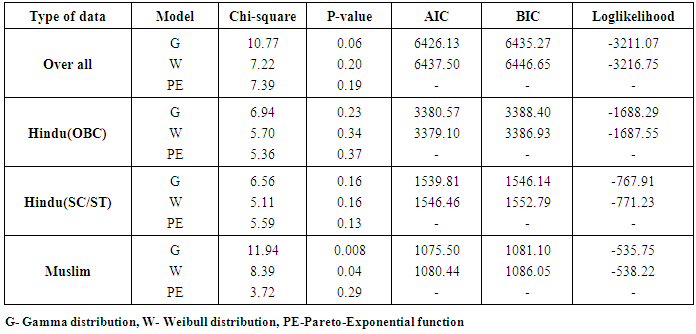
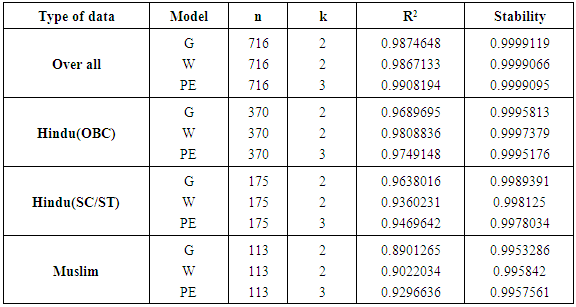
- The principle of least squares is employed to estimate the parameter of Pareto-Exponential function by taking the logarithmic on both sides. The parameter of Gamma and Weibull distribution are estimated by maximum likelihood estimation method, since this method possesses several desirable properties and advantage over other method of estimation. It is more robust in the sense that it possesses the properties of invariant, asymptotic normality, consistency, sufficiency and minimum variance for large samples. The values of various estimated parameters are shown in table 2. The p-values from table 3 also demonstrate that Gamma distribution and Pareto-Exponential function provides a good fit as compared to other model across all the categories.
|
|
3.2. Model Accuracy Results
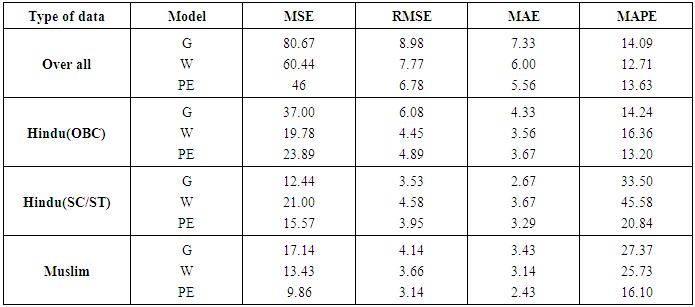
- Table 4 displays model accuracy results for all the four models. It is the most popular method of observing the efficiency of model, when several models are in fray. [6] have described several measures of accuracy. Some measures are scale dependent and some are scale independent. Scale independent measures should not be used across different data sets which are not on the same scale. We have used four following measures of accuracy.(a) Mean square error (MSE): It is a scale dependent measure of error.MSE = mean (Zi –Ži)2, where Zi is the observed value and Ži is the fitted value.(b) Root mean square error (RMSE): RMSE = √MSE. It has the advantage of being on the same scale as the data, but both MSE and RMSE have the demerit of being more sensitive to the outliers.(c) Mean absolute error (MAE): MAE=mean (ǀ (Zi –Ži) ǀ).(d) Mean absolute percentage error (MAPE): MAPE has the advantage of being scale dependent, reliable and easy to calculate. It can be used across different data sets, which are on different scale. The formula for MAPE is given as follows;
 In table 4, accuracy results of all the four measures are given for each data set. The model with the least error is preferred. It is evident from the table that Weibull model and Pareto-Exponential model fit the data with minimum error for majority of data sets. Though, Gamma is also very close. Both these models display substantial degree of improvement over the Gamma model.
|
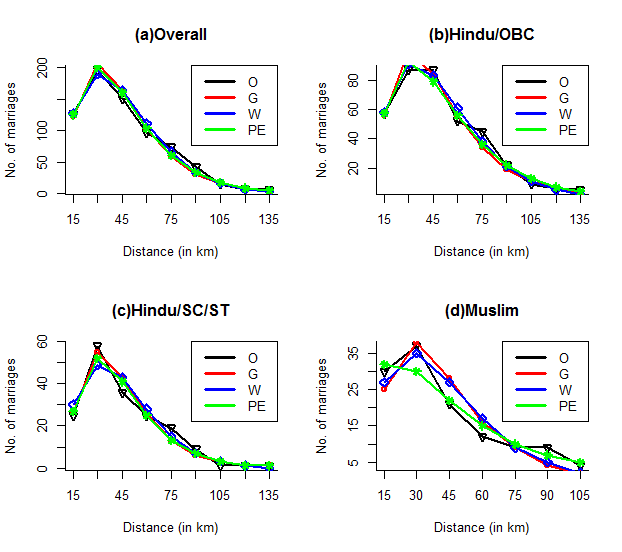 | Figure 1. Observed (O) and expected fitted frequencies graph from models selected |
3.3. Model Validation
- Cross validity prediction power (CVPP) is employed to check the stability of model over the population. CVPP is given as;
 where n denotes the number of cases, k is the number of parameters in the model and R is correlation coefficient between observed and expected frequencies. The absolute value of difference between
  and
and  of the model is equal to (1-shrinkage) ([19]). From table 5, it is clear that all the fitted models are nearly 100% stable over the population with high coefficient of determination (R2).
|
4. Determinants of Distance through a Gamma Regression Model
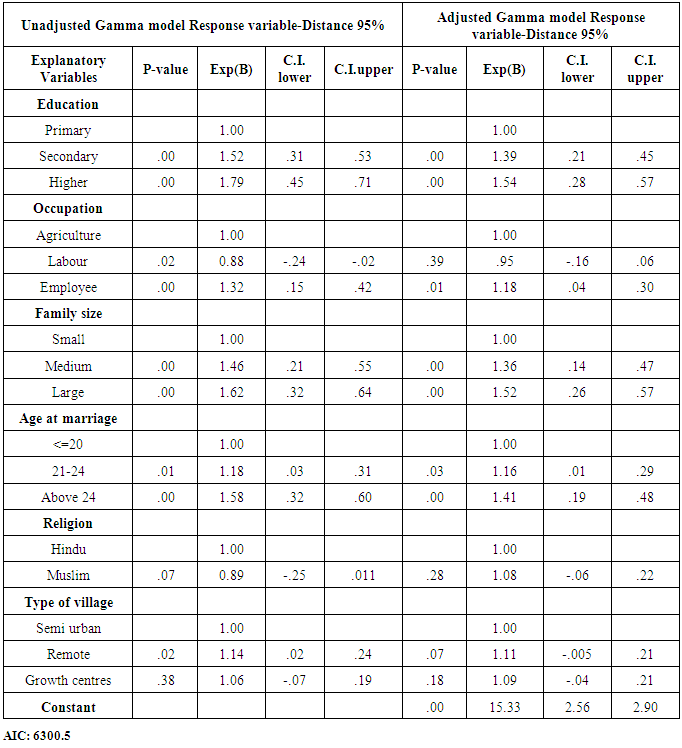
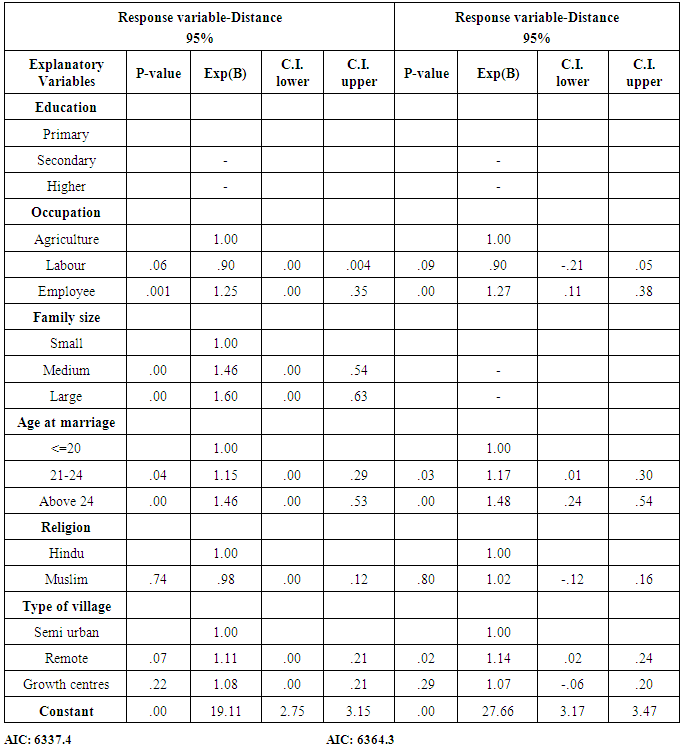
- Table 6 depicts the regression estimates of relative risk of distance associated with marriage migration. The outcome of multivariate analysis shows that majority of the predictor variables are statistically significant at 5% level of significance both in unadjusted and adjusted models, among those female education, family size and age at marriage are most prominent. The secondary and higher educated females are at greater risk (54% and 39% respectively) of marrying at larger distance, as compared to lower educated females. The females, whose fathers are engaged in labour work, are at lesser risk, while the females whose fathers are employed somewhere are at greater risk relative to females belonging to peasantry family. Another significant covariate is family size of females. Analysis results show that females from medium and large family are at greater risk of finding their mate in long distance relative to their small family counterpart. Surprisingly, Hindu females have lesser probability of finding their grooms in shorter distance than Muslim females. Residents of remote villages and growth centres have higher risk of migration at longer distance. It is also found that higher the age at marriage, higher is the chance of finding the suitable mate in longer distance. To investigate the effect of education and family size on the marriage distance two additional models are constructed in table 7 (model 2 & 3). In model 2, female education and in model 3 both female education and family size were dropped to observe the effect of these two covariates. Table 7 results indicate the prominence of both variables in determining the marriage distance. All these calculations were done with the help of R-3.2.2 version ([12]) on a Window 10 platform.
|
|
5. Conclusions
- In this paper, we studied the distribution pattern of distance associated with marriage migration of western U.P. by using the Pareto-Exponential, Gamma and Weibull models. From the above discussion and analysis, it can be concluded that Pareto-exponential and Gamma models fit the data satisfactorily across all categories. Though, Pareto-Exponential seems to give much better fit, but Weibull model, with two parameters, also gives quite a better approximation. We have also found a larger marriage field in this region relative to previous studies of eastern U.P., Bihar and Bangladesh. Rigorous developmental activities in this region might be the reason for the larger marriage field. Gamma regression analysis provides an insight of how the various covariates affect the decision of finding a suitable mate. Dominance of Hindu population and scattered Muslim population might be the reason for Hindu females to migrate at short distance as compared to Muslim females. All the variables selected affect the distance associated with marriage migration.
ACKNOWLEDGEMENTS
- One of the authors (Sachin Kumar) is highly indebted to UGC (BSR), who provided us with the financial assistance through their reference letter number F.7-293/2010(BSR) as dated on November 2013 for carrying out this work.