-
Paper Information
- Next Paper
- Previous Paper
- Paper Submission
-
Journal Information
- About This Journal
- Editorial Board
- Current Issue
- Archive
- Author Guidelines
- Contact Us
American Journal of Mathematics and Statistics
p-ISSN: 2162-948X e-ISSN: 2162-8475
2016; 6(3): 94-102
doi:10.5923/j.ajms.20160603.02

Age Specific Employment and Unemployment Rates of Curacao in 2011: Approaching of Polynomial Model
Md. Rafiqul Islam1, Md. Sabbir Hossain1, M. Korban Ali2
1Department of Population Science and Human Resource Development, University of Rajshahi, Bangladesh
2Manarat International University, Gulshan, Dhaka, Bangladesh
Correspondence to: Md. Rafiqul Islam, Department of Population Science and Human Resource Development, University of Rajshahi, Bangladesh.
| Email: |  |
Copyright © 2016 Scientific & Academic Publishing. All Rights Reserved.
This work is licensed under the Creative Commons Attribution International License (CC BY).
http://creativecommons.org/licenses/by/4.0/

The purpose of this study is to fit some models to age specific employment rates (ASERs) and age specific unemployment rates (ASURs) for male, female and both sexes population of Curacao in 2011. The data is taken from Census 2011 of Curacao to fulfill the objectives of this research. Quasi Newton Method is employed to fit these models using the software STATISTICA. Moreover, t-test, F-test and cross validity prediction power (CVPP) are used to check the accuracy as well as validation of the model. In this study, it is found that the pattern of ASERs for male, female and both sexes population of Curacao are exhibiting reciprocal of U-shape pattern and all the curves of ASURs for male, female, both sexes population are showing decreasing with increase of ages. It is also investigated that ASERs for male, female and both sexes population of Curacao follow quadratic polynomial models and ASURs for male, female, both sexes population follow cubic polynomial models. These models are well fitted in accordance with t-test, F-test and CVPP. The coefficients of determination of these models are more than 98%.
Keywords: Age specific employment rates (ASERs), Age specific unemployment rates (ASURs), Polynomial model, T-test, F-test, Cross validity prediction power (CVPP)
Cite this paper: Md. Rafiqul Islam, Md. Sabbir Hossain, M. Korban Ali, Age Specific Employment and Unemployment Rates of Curacao in 2011: Approaching of Polynomial Model, American Journal of Mathematics and Statistics, Vol. 6 No. 3, 2016, pp. 94-102. doi: 10.5923/j.ajms.20160603.02.
Article Outline
1. Introduction
- Curacao is an island located in the southwestern Caribbean Sea of total area 444 square kilometer with 150,563 populations in which 68,848 male and 81,715 female populations [2]. The density of population per square kilometer is 339 and about 30% of the island has been occupied by housing and industry. The Dutch Caribbean island of Curacao is now an autonomous country within the Kingdom of Netherlands as of October 10, 2010. Curacao is a UNESCO World Heritage Site has an eclectic mix of history and culture that welcomes visitors to this unique island. Tourism is one of the most important economic sectors in Curacao. It has contributed significantly to economic growth and employment. Now, greater resources are available on-island for develop new port facilities and hotels, positioning Curacao for significant growth in its tourism industry. With its pristine dive sites, secluded beaches, championship golf and local food, Curacao is ready to serve the adventure travelers who simply want to enjoy its perfect climate. Curacao enjoys an ideal locale, situated in between Aruba and Bonaire, just 35 miles north of Venezuela. It has other important sectors including an oil refinery, a free zone, and international financial services. Youth unemployment rate especially up to age 29 is very high in Curacao. It has a well-earned reputation for religious and ethnic harmony. While 80% of the population is Catholic, many religions have their own houses of worship including Protestants, Jews, Muslims, Baptists, Adventists, Jehovah’s Witnesses, Mormon’s and Methodist. It has one of the highest standards of living with a GDP per capita of US $ 20,500 [5]. The education system in Curacao is highly developed. The education system starts from Kindergarten through primary, secondary and tertiary level. The unemployed rate in Curacao for no education population is 0.86%, for elementary education is 7.29%, for secondary level 1st stage is 45.20%, for secondary level 2nd stage is 28.94%, for higher education is 6.34% [3]. According to the Labor Force Survey, Curaçao’s unemployment rate was higher among females (17.7%) than males (11.4%) in the year 2006. Approximately 70% of the unemployed had a low education level [4]. The skills of job seekers do not match the characteristics of the job vacancies [1]. Employers complain about the lack of qualified people. However, according to the recent job vacancy survey by the Central Bureau of Statistics, 52% of the job openings require individuals with a low level of education [32]. After observing the unemployment rates, it is seen that employment opportunity in Curacao is available for no education and higher education population. In this study, it is investigated employment and unemployment rate for male, female and both sexes’ populations of Curacao in 2011 through mathematical modeling. For doing so, polynomial model is selected. It is mentioned that a number of studies has been done using polynomial model [7-8, 10, 15-16, 31]. Therefore, the specific objectives of this study are addressed below:i) To study the level and pattern of ASERs as well as ASURs for male, female and both sexes population of Curacao in 2011,ii) To fit some models to ASERs and ASURs for male, female and both sexes populations,iii) To check the validity of these fitted models using cross validity prediction power (CVPP).
2. Data and Data Source
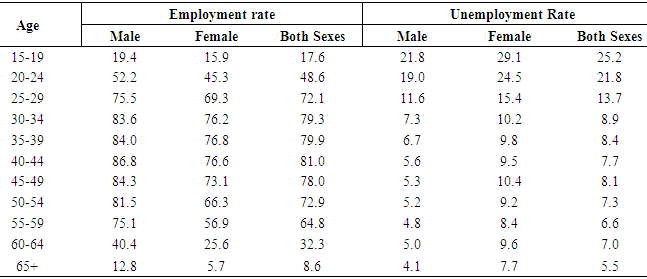
- The secondary data on ASERs and ASURs for male, female and both sexes population in Curacao have been taken from Census of 2011 [2] which is shown in Table 1.
|
3. Methods and Methodological Issues
3.1. Smoothing of ASERs and ASURs
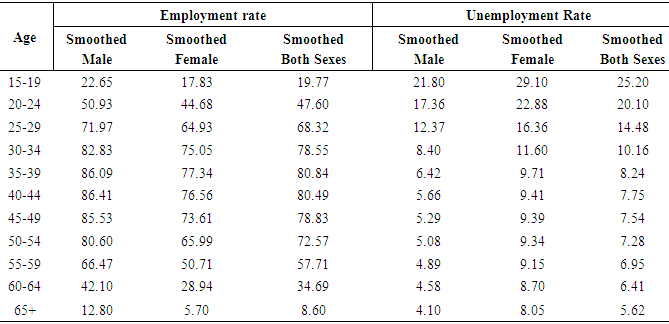
- It is observed that there is some kind of unexpected distortions in the data aggregate when the data on ASERs and ASURs for male, female and both sexes population in Curacao by age group is put on graph paper. Therefore, an adjustment is needed to abate these unpredicted distortions before going to fit the models to these data. As a consequence, a modification is made here using the Package Minitab Release 12.1 by the smoothing technique “4253H, twice” [34]. It is noted that this method requires at least seven observations. Thereafter, the smoothed data are used to fit model for male, female and both sexes population in Curacao and these smoothed data are launched in Table 2. This method was also used as smoothing technique [9].
|
3.2. Model Fitting to ASERs and ASURs
- A) Using the scattered plot (Fig.1-Fig.3) of ASERs by age group in years for male, female and both sexes population in Curacao, it seems that ASERs for male, female and both sexes population in Curacao can be fitted by polynomial model with respect to different ages in year. Therefore, an nth degree polynomial model is considered in case of Curacao and the formation of the model is
 where, x is the mean value of the age group; y is ASERs;
  is the constant;
  is the coefficient of
  (i =1, 2, 3, ..., n) and u is the disturbance term of the model. Here, a suitable n is found for which the error sum of square is minimum.
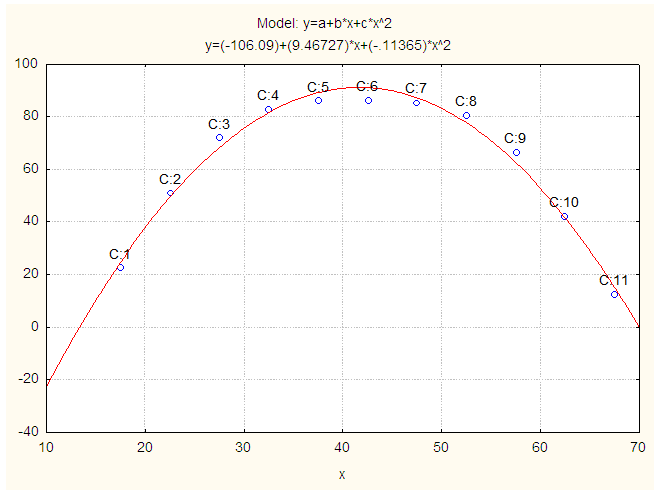 | Figure 1. Smoothed and Fitted ASERs for Male in 2011. X: Age in Years and Y: Smoothed ASERs for Male |
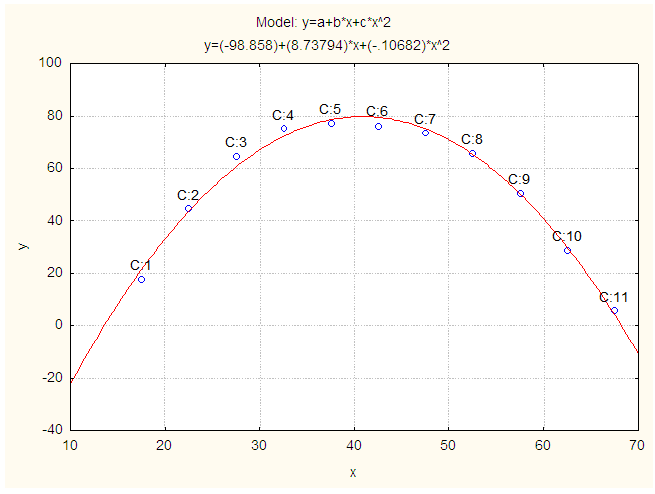 | Figure 2. Smoothed and Fitted ASERs for Female in 2011. X: Age in Years and Y: Smoothed ASERs for Female |
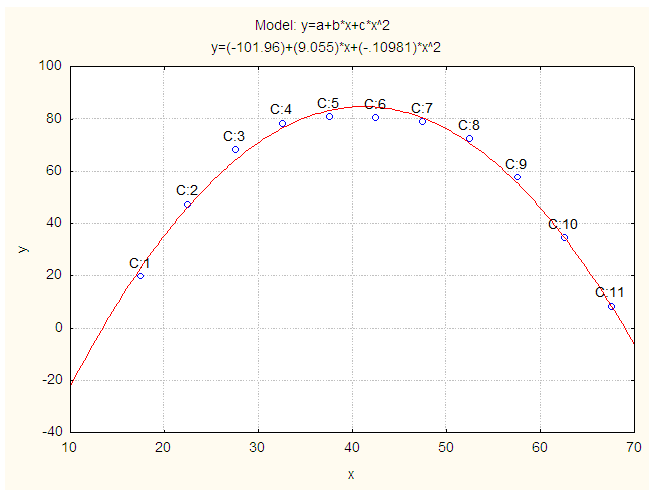 | Figure 3. Smoothed and Fitted ASERs for Both Sexes in 2011. X: Age in Years and Y: Smoothed ASERs for Both Sexes |
 where, x is the average value of the age group; y is forward cumulative ASURs;
  is the constant;
  is the coefficient of
  (i =1, 2, 3, ..., n) and u is the disturbance term of the model. A suitable n is selected such that the error sum of square is lowest.The software STATISTICA was used to fit these models to ASERs and ASURs.
 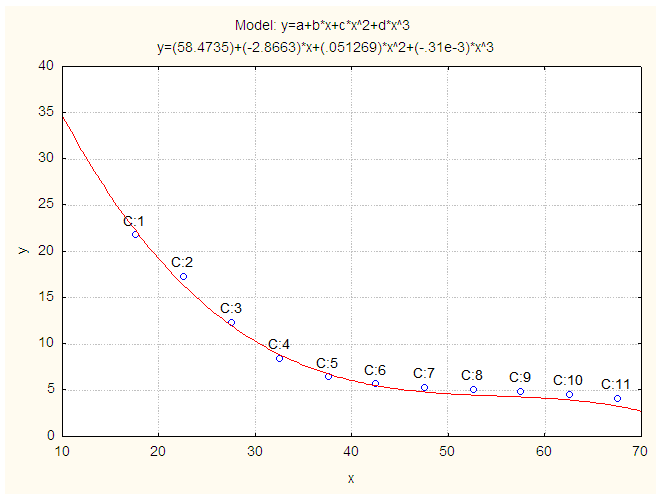 | Figure 4. Smoothed and Fitted ASURs for Male in 2011. X: Age in Years and Y: Smoothed ASURs for Male |
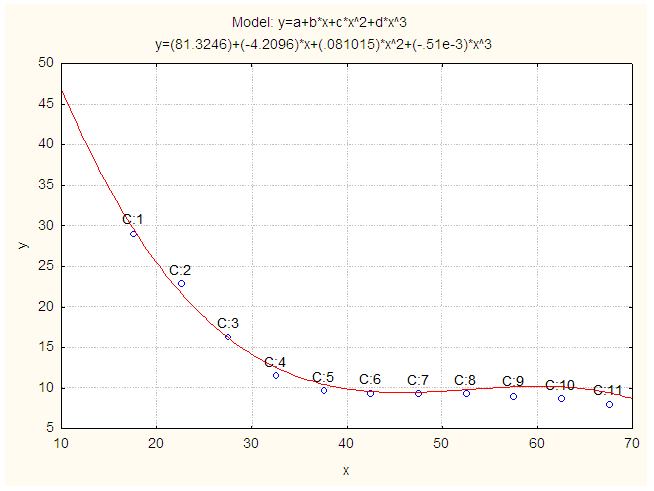 | Figure 5. Smoothed and Fitted ASURs for Female in 2011. X: Age in Years and Y: FCD of Smoothed ASURs for Female |
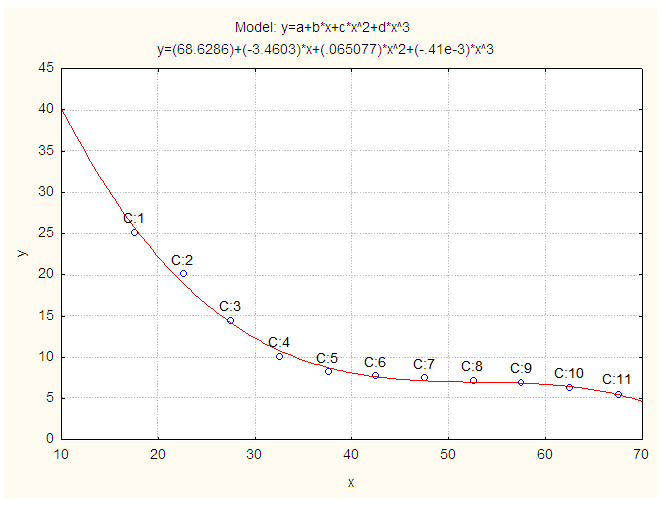 | Figure 6. Smoothed and Fitted ASURs for Both Sexes in 2011. X: Age in Years and Y: Smoothed ASURs for Both Sexes |
3.3. Model Validation Technique
- To check how much these models are stable over the population in case of Curacao, the cross validity prediction power (CVPP),
 is applied in this paper. Here
  where, n is the number of cases, k is the number of predictors in the model and the cross validated R is the correlation between observed and predicted values of the dependent variable [33]. The shrinkage coefficient of the model is the positive value of
  where
where  is CVPP and R2 is the coefficient of determination of the model. 1-shrinkage is the stability of R2 of the model. The information on model fitting and estimated CVPP have been demonstrated in Table 3. It is noted that CVPP was also employed as model validation technique [11-13, 20-21, 23, 26-30].
|
3.4. F-test
- To verify the measure of the overall significance of the model as well as the significance of R2, the F-test is employed in this paper. The formula for F-test is given below:
 with (k-1, n-k) degrees of freedom,where k = the number of parameters is to be estimated, n = the number of cases and R2 is the coefficient of determination of the fitted model [6]. These estimates are shown in Table 4. It is to be mentioned that F-test was also used as overall significance of a model [14, 17-19, 22, 24-25].
|
4. Results and Discussion
- Table 1 represents the ASERs and ASURs for male, female and both sexes population of Curacao in 2011. To see the level and pattern of ASERs and ASURs for male, female and both sexes population of Curacao, the data have been presented in graph paper shown in Fig. 7 and Fig. 8 respectively. It is found that the pattern of ASERs for male, female and both sexes population of Curacao are showing reciprocal of U-shape pattern. It is seen that highest ASERs for male, female and both sexes in the age group 35-49. It is also observed that highest ASURs for male, female and both sexes in the age group 15-24. From the above observation and Fig. 7and Fig. 8, it is found that employment rate for female is low in all age group compared to male and unemployment rate for male is low in all age group compared to female in Curacao.
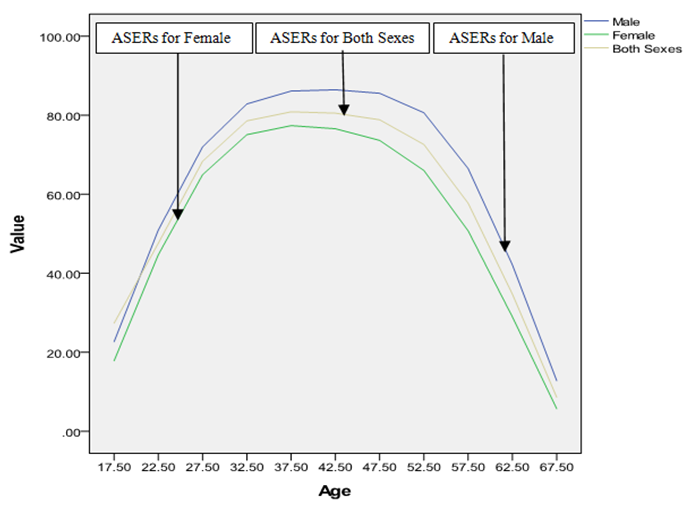 | Figure 7. Smoothed ASERs for male, female and both sexes population of Curacao in 2011 |
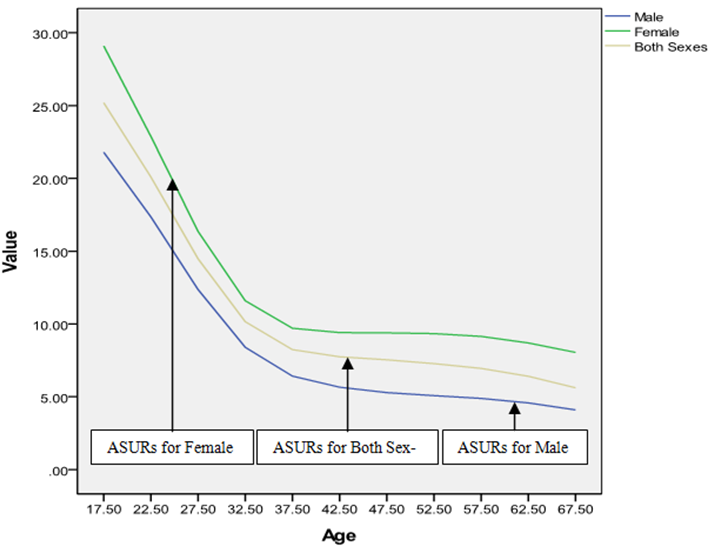 | Figure 8. Smoothed ASURs for male, female and both sexes population of Curacao in 2011 |
 | (1) |
 | (2) |
 | (3) |
 | (4) |
 | (5) |
 | (6) |
 corresponding to their
  are shown in Table 3. The smoothed and fitted values are depicted in Figure 1 to Figure 6. In this table, all fitted models from equation (1) to equation (6) are cross validated and their shrinkage’s are small. Moreover, it is observed that all the parameters of the fitted models are statistically significant with large proportion of variation explained. Indeed, the proportions of variation of these models are more than 98%. The stability of the models 1 to 6 is more than 97%.From the Table 4, it is found that the calculated values of F-statistic of the models (1) to (6) are 1582.877 with (2, 8) degrees of freedom (d.f.), 1773.484 with (2, 8) d.f., 1689.288 with (2, 8) d.f., 1101.406 with (3, 7) d.f., 1381.492 with (3, 7) d.f., 1182.161 with (3, 7) d.f. respectively where as the corresponding tabulated values are 8.65, 8.65, 8.65, 8.45, 8.45 and 8.45 respectively at 1% level of significance. Therefore, from these statistics it is also concluded that all these constructed models are highly statistically significant. Hence, the fits of these models are well.
5. Conclusions
- In this study, ASERs for female population of Curacao is lower in every age group than male population as well as ASURs for female population is higher in every age group than male. The shapes of ASERs for three cases are showing reciprocal of U-shape pattern and ASURs are showing decreasing curves. The ASERs for male, female and both sexes population follow quadratic polynomial models, ASURs for male, female and both sexes populations follow 3rd degree polynomial models. The proportions of variation of these models are more than 98%. It is found that the overall significance of these models is highly significant due to F-statistics. Hence, these models are better fit.
 Abstract
 Reference
 Full-Text PDF
 Full-text HTML