Benedicta B. Owolabi1, Oyindamola B. Yusuf1, Chinenye Afonne2, Nathanael B. Afolabi1, IkeOluwapo O. Ajayi2
1Department of Epidemiology and Medical Statistics, College of Medicine, University of Ibadan, Nigeria
2Institute of Advanced Medical Research and Training, College of Medicine, University of Ibadan, Nigeria
Correspondence to: Oyindamola B. Yusuf, Department of Epidemiology and Medical Statistics, College of Medicine, University of Ibadan, Nigeria.
| Email: |  |
Copyright © 2016 Scientific & Academic Publishing. All Rights Reserved.
This work is licensed under the Creative Commons Attribution International License (CC BY).
http://creativecommons.org/licenses/by/4.0/

Abstract
Malaria in children remains a major public health problem particularly in the tropics. Fever is one of the major symptoms of malaria; however, not all fever cases is as a result of malaria. Therefore this study estimated the proportion of fever cases that can be attributed to malaria among children in south west Nigeria. Records of all children (≤ 12yrs) eligible for the study were used for the analysis. Malaria attributable fraction (MAF) was estimated using 3 approaches: Classical method, parametric (logistic regression model) and non parametric regression methods (local linear smoothing). The proportion of children with fever increased during the first 3 years of life and thereafter decreased but was not significant with age. The prevalence of parasitemia decreased with increasing age. The MAF obtained from the classical method was 0.27 (95% CI, 0.1784-0.3520). The parasite density specific attributable fraction estimates from logistic regression analysis were 0.0385 (95% CI, 0.0105- 0.0665) and 0.3215 (95% CI, 0.2738- 0.3691) for ≤999µl and ≥1000µl categories respectively. The nonparametric estimate of the MAF obtained was 0.24 (95% CI, 0.1785- 0.3119). The prevalence of malaria disease and fever during childhood remained high. The results suggest a monotone increasing function and shows that the logistic regression method is a better method in determining malaria attributable fractions.
Keywords:
Malaria Attributable Fraction, Fever, Logistic regression, Local Smoothing
Cite this paper: Benedicta B. Owolabi, Oyindamola B. Yusuf, Chinenye Afonne, Nathanael B. Afolabi, IkeOluwapo O. Ajayi, Parametric and Non Parametric Estimates of Malaria Attributable Fractions among Children in South West Nigeria, American Journal of Mathematics and Statistics, Vol. 6 No. 2, 2016, pp. 79-85. doi: 10.5923/j.ajms.20160602.02.
1. Introduction
Malaria in children remains a major public health problem particularly in the tropics. Early diagnosis with prompt and appropriate treatment is essential as malaria can be fatal particularly in children. In Nigeria, malaria accounts for 25% of infant mortality, and 30% of under-5 mortality. Between 2000 and 2010, at least 50% of the population had one episode of malaria per year, while children below 5 years had two to four attacks [1]. The most prominent clinical feature of malaria is fever. Usually clinical immunity is acquired after several exposures as age of child increases and so it is possible for parasitemia to be present in blood without a child having fever. Studies have shown that a child has capacity to tolerate malaria parasites as age increases [2]. Therefore clinical malaria is age, region and season specific. In endemic areas such as Nigeria, the populations including children are asymptomatic and detection of parasitemia does not necessarily indicate presence of clinical malaria. There could be other causes of fever in children that is not due to malaria in the presence of parasitemia; and this will lead to over diagnosis. In order to contain or minimize the problem of over diagnosis, estimation of the proportion of fever cases attributable to malaria infection is crucial to the establishment of a more concise or precise definition of clinical malaria. Malaria attributable fraction (MAF) is the proportion of fevers in a particular group of people that are associated with a parasite density above the threshold (or excess risk of fever associated with a parasite density above that level). The attributable fraction of a disease due to an exposure is the proportion of disease cases which would be eliminated if everybody’s exposure was set to zero. Malaria Attributable Fraction will vary according to the prevalence of parasitemia in a population and with associated degree of immunity in that population, factors that are affected by transmission intensity which varies with location [3, 4], season [5, 6], altitude [7], age [8, 9] and also by factors such as use of bed nets, drugs and environmental control. All these factors have made researchers to argue that threshold parasite densities and malaria attributable fractions should be determined locally and on currently derived data. [3]. In arriving at proper diagnosis of malaria, malaria attributable fractions remain important epidemiologic tools as accurate estimates of the burden of malaria are needed to help policy makers plan appropriate interventions. Malaria attributable fractions could play an important role in strengthening diagnosis and as a good indicator that is predictive of malaria illness both at the individual and at the population levels. Few studies have reported the proportion of fever attributable to malaria [2, 10, 11]. To our knowledge, there is no report of malaria attributable fractions in Nigerian children. Therefore we compared the performance of three methods (classical, logistic and local linear smoothing) in estimating attributable fractions for fever due to malaria parasites among children in south western Nigeria.
2. Methodology
The study was conducted in Ona Ara Local Government Area (LGA), Oyo state which lies southeast of Ibadan, the capital of Oyo state Nigeria. Malaria is holo-endemic in the LGA with perennial transmission. The climate is that of tropical rainforest zone. Its wet season runs from March through October, November to February forms the dry season. There are about 56,406 children under the age of five years and 12,515 infants. Older children are about 124,999 and adults are 100,630. The LGA is divided into 11 wards - 3 urban, 2 peri-urban and 6 rural wards. The rural wards were selected purposefully for this study, considering possibility of greater prevalence of malaria in rural environments. Six communities were selected (one from each of the six rural wards) based on largest population size, accessibility of road and the informed consent and assistance of the village heads.The study period was from February 2011 to June 2011. Children between the ages of 6 months and 12 years who have been residing in the community for up to six months or more with no symptoms of malaria or any apparent illness as at the time of recruitment and whose caregiver provided written or verbal informed consent were enrolled into the study.Research assistants visited all households with eligible children in the six rural communities selected. In case no one was available for the survey or no one was at home when a research assistant visited, or there was no eligible child or the household head refused to give consent, the research assistant proceeded to the next household.For each child recruited, firstly, data such as age, sex and axillary temperature were obtained from the head of household/caregiver of the child and recorded in a structured questionnaire. Then, capillary blood from a finger prick was used for the preparation of thick blood films. The thick blood films were stained with 10% Giemsa and examined for malaria parasites by two experienced microscopists and results were provided to caregivers the following morning. A sample was considered negative if no asexual blood stage parasite either ring forms or gametocytes was seen in 100 oil-immersion fields (x1000 magnification) after reading through 200 fields. In case of discrepancies, the slides were re-read again by a senior investigator.The data were entered in EPI data 3.1 [12] and analysed using SPSS 16.0 [13]. Descriptive statistics such as frequencies, proportions, means and confidence intervals were used to summarize the quantitative data while categorical variables were presented with proportions and percentages. The Chi square test was used to compare proportions and to investigate associations between parasite density and other variables such as presence of fever, headache, chills and other reported signs and symptoms. Logistic regression as a parametric estimate of attributable fraction was used to model parasitemia as a continuous function of fever. The model used was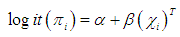 | (2.1) |
which represents a logistic regression model where πI is the probability that observation i with parasite density Xi is a fever case. The relationship between P. falciparum parasite density and clinical signs and symptoms of malaria was determined. Parasitemia densities were grouped into three categories. (no parasitemia, <1000, ≥1000 μl). The proportion of malarial signs and symptoms within the parasite density strata was calculated. Binary logistic regression was used to estimate the associations between parasite density and various signs and symptoms of malaria that achieved significance in the bivariate analysis. Fever was defined as temperature >37.5°C. Non parametric modeling of P (Disease|Exposure) was also used to estimate the attributable fractions. It is known that malaria in children is a monotone increasing function of the exposure level i.e. higher levels of malaria parasite density leads to an increase in risk of fever. According to Wang [11], non parametric regression method has not being used to estimate the attributable fraction previously but has been used to analyse medical or health related data. It improves efficiency to incorporate any known shape constraints (i.e. the monotonicity constraints) on the regression function. Our data shows that malaria in children exhibits a semi continuous exposure and so the non parametric regression is adequate i.e. an exposure to which a group of people have zero exposure and the rest have positive exposures. Wang [11].
2.1. Estimation of Attributable Fractions
The conditional probability of disease at exposure level X is P(Y = 1|X = x). Where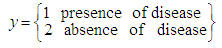 | (2.2) |
Estimation of the attributable fraction involves estimating the conditional probability of having the disease given the exposure. We assume that there are no confounders of the disease-exposure relationship or that we are considering the AF within a stratum of confounders.Under the assumption of no confounders, the AF is: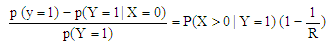 | (2.3) |
Where R is the relative risk of disease with exposure greater than zero compared to zero exposure. The classical estimate of the attributable fraction is to plug the sample proportions  and
and 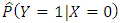 into the left hand side of the equation (2.3).To estimate the attributable fraction using regression methods, the above equation can be written as:
 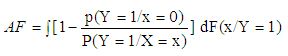 | (2.4) |
Where F(x/Y=1) is the conditional distribution of the exposure in the subpopulation of children with the disease.Based on equation (2.4) from a random sample of size N from the population, one can estimate AF as: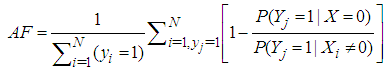 | (2.5) |
Where  i=1,…N are estimates from a regression model of the conditional probability of disease at exposure levels. The approaches that would be used in estimating the probability functions are:1. Classical method2. Parametric regression method; the logistic regression model3. Non parametric regression method; local linear smoothing
2.2. Determination of Attributable Fraction Estimates Using Classical Methods
This approach estimates the frequency of clinical malaria by using information on parasite levels in children with individual symptoms and signs and those without symptoms and signs to estimate the proportion of individual symptoms and signs that are attributable to malaria. The overall estimate (λ) of the fraction of episodes attributable to a given exposure is given byλ = P(R-1)/Rwhere P is the proportion of parasitemic individuals who presented with symptom/sign in question and R is the relative risk of the sign or symptom associated with the exposure.The overall estimate of λ was calculated using only two categories (with/without parasitemia). R was estimated by the adjusted odds ratio of the symptom/sign in question for the parasitemic group (relative to the baseline aparasitemic group) derived from the fitted logistic regression.
2.3. Determination of Attributable Fraction Estimates Using the Logistic Regression Method
Separate logistic models were constructed to examine the parasite density-specific malaria attributable fraction (λj) = Pj(Rj – 1)/Rj associated with each of the parasite density categories where Rj is the adjusted OR of the various symptoms/signs for the jth category, relative to the baseline category j = 1, and Pj is the proportion of patients with the symptom/sign in question with parasites in the jth category (j=1, 2 and 3; those without the parasite, those with < 1000μl and those with ≥1000μl).
2.4. Determination of Attributable Fraction Estimates Using Local Linear Smoothing Method
Local linear smoothing is an approach to fitting curves and surfaces to data by smoothing. The underlying model for local regression is 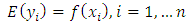 Where the
  are observations of a response variable (parasite density) and
  are observations of the independent variable that form the design space for the model (i.e. the signs and symptoms).Loess (locally weighted scatter plot smoothing) is a method that is usually used for local linear smoothing. It is a non parametric regression method that combines multiple regression models in a k-nearest neighbor-based meta-model. Loess fits simple models to localized subsets of data to build up a function that describes the deterministic part of the variation in the data point by point.For each data point, the regression weights are computed and are given a tricube function given below:
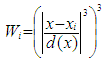 | (2.6) |
Where x is the predictor value associated with the response value to be smoothed,  s are the nearest neighbors of x as defined by the span and
  is the distance along the abscissa from x to the most distant predictor value within the span. A weighted linear least squares regression is performed and a second degree polynomial is used for the regression; then the smoothed value is given by the weighted regression at the predictor value of interest. Stata 12.0 software was used for analysis [14].
3. Results
3.1. Socio Demographic Characteristics
Symptoms reported include body ache (53.0%), loss of appetite (44.0%), high temperature (67.8%) and only 65% had temperature ≥ 37°C.
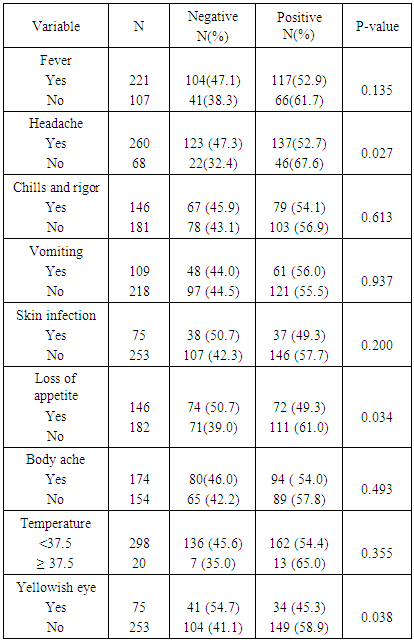
3.2. Relationship between Parasitemia and Clinical Signs and Symptoms
The percentage of children that were aparasitemic was 47.2%. Eighteen percent had < 1000μl and 34.8% had ≥ 1000 μl. Of the children presenting with headache, 47.3% were aparasitemic while 52.7% were parasitemic. Malaria parasite was also detected in children who reported loss of appetite (49.3%), chills and rigor (54.1%), vomiting (56.0%), skin infection (49.3%) and yellowish eyes (45.3%). There was no significant association between parasitemia and the symptoms: history of fever, vomiting, chills & rigors, skin infection and body ache. (Table 1).Table 1. Malaria parasitemia by presenting signs and symptoms
 |
| |
|
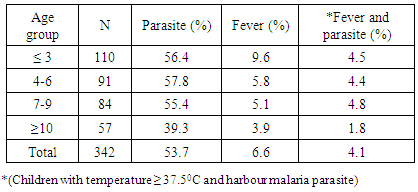
3.3. Prevalence of Fever and Malaria
Overall, fever prevalence (Auxiliary temperature > 37.5°C) among children was 6.6%. The prevalence of fever decreased with increasing age with children less than three years having the highest fever prevalence of 9.6%. The lowest fever prevalence of 3.9% was recorded among children ten years and above. The prevalence of parasitemia also decreased with increasing age, however, children between 4-6 years of age had the highest parasitemia and those ≥ 10 years had the lowest (39.3%). (Table 2).Table 2. Prevalence of fever and parasiteamia across different age groups
 |
| |
|
3.4. Association between Fever and Parasite Density Categories
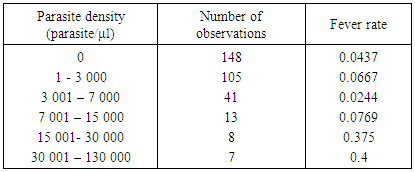
The risk of having fever increased with increasing parasite density; 9.5% in the ≥ 1000/µl, 5.2% in the <1000/µl and 4.7% in the children with no parasite. However these differences were not statistically significant. Using a different parasite categorization, the fever rates continued to increase as the parasite density increased up till the third interval of 3 001–7 000/μl (Table 3). Figure 1 shows the fever rate against each interval of the parasite density. It suggests the fever rates increases sharply for low exposures and also approaches 1 for high exposures. The plot also suggests a monotone pattern of the conditional probability of 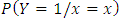 .
.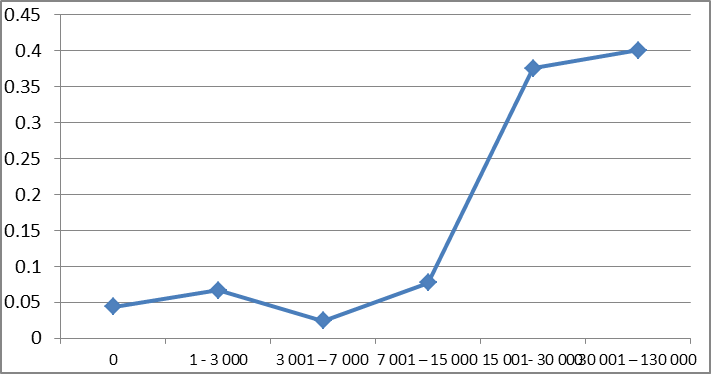 | Figure 1. Fever rates for the parasite density intervals |
Table 3. Distribution of malaria parasite densities and fever rates in children
 |
| |
|
3.5. Relationship between Parasitaemia and Clinical Signs and Symptoms
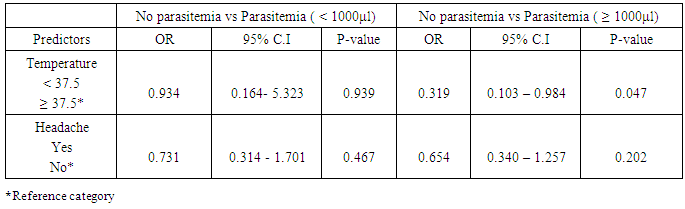
A multivariable logistic regression analysis was conducted to examine the extent to which common signs and symptoms such as headache and temperature are associated with the presence of parasitaemia (Table 4). There was no significant association between signs and symptoms and parasite count <1000/μl. Temperature was significantly associated with parasite count ≥1000/μl. Children with temperature < 37.5°C were about 3 times less likely to have malaraia parasite count ≥1000 μl compared to those with temperature ≥ 37.5°C. (OR=0.319, 95% C.I= 0.103 – 0.984).Table 4. Results of logistic regression analysis
 |
| |
|
3.6. Attributable Fraction Estimates for Malaria: The Classical Method
Using the classical method of estimation, the estimated overall attributable fraction for temperature ≥ 37.5°C was 26.52% (95% CI=17.84%-35.20%). The Logistic regression method for estimating MAF.Using the logistic regression method, the density-specific MAF for temperature ≥37.5°C was 3.85% (95CI: 1.05% -6.65%) in the category ≤999µl and 32.15% (27.38% - 36.91%) in the category ≥1000µl. (Table 5). 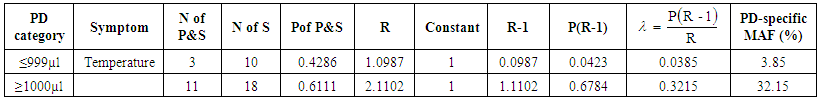 | Table 5. Parasite density-specific attributable fraction estimates from Logistic regression analysis |
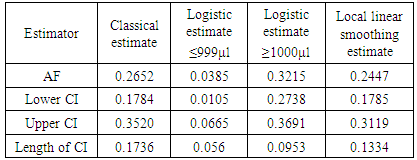
Where: No of P&S = number of parasitaemic children who presented with a particular sign/symptom.No of S = number of those that present with the sign/symptom whether parasitaemic or non-parasitaemic.P of P&S = Proportion of children who are parasitaemic and presented with the sign/symptom in question.R = odds ratio of a particular sign/symptom relative to the baseline (non – parasitaemic children) Λ = malaria attributable fraction estimate. Local linear smoothing method for estimating MAFThe attributable fraction using the local linear smoothing method was given as 0.2447 (95% CI, 0.1775 - 0.3119) i.e. the proportion of fever cases that can be attributed to malaria was 24.47%. The line fitted to the graph in figure 2 is a locally weighted regression fitted by loess. In table 6, different estimators were displayed with their confidence intervals. The MAF range from 0.0385 to 0.3215. The logistic regression estimator for parasite density ≤999μl gave the smallest confidence interval. The nonparametric regression estimator i.e. Local linear smoothing also had a smaller confidence interval than the classical nonparametric estimator.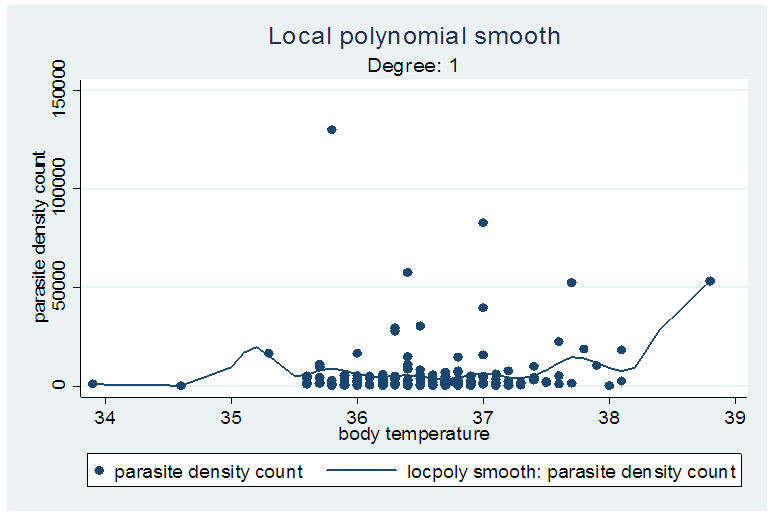 | Figure 2. Graph showing the locally weighted regression |
Table 6. Estimates of attributable fraction and 95% CI for different estimators
 |
| |
|
4. Discussion and Conclusions
Three different methods were used in obtaining the estimates of malaria attributable fraction: the classical method, the logistic regression and the local linear smoothing. The logistic regression estimates had the smallest confidence intervals followed by the local linear estimate. The classical estimate exhibited the worst performance as it had the largest confidence interval. The logistic estimate for parasite density category of ≥1000μl gave the highest malaria attributable fraction and had the smallest confidence interval followed by the local linear estimate. These results suggest that that estimates from the logistic regression method (parametric) are better than the classical and local linear smoothing (non parametric) methods. The estimate from the classical method was slightly lower than that obtained by Wang [11] in Tanzania. In a Kenya study, overall malaria attributable fractions were quite higher. The two areas in the Kenya study (Ngerenya was located north of the Kilifi Creek and Chonyi was located south of the Kilifi Creek Kenya) that were considered were referred to as areas of low and low-moderate transmission of malaria and this might just explain the reason for the high MAF.Our results showed that MAF increased for the higher parasitemia compared to the lower parasitemia. This finding is consistent with the work of Prybylski [15]. In another paper Koram [16] reported that in a population of whom a large proportion are parasitemic but not ill, it is usually found that the likelihood of being ill increases with the density of parasitemia and this observation has led to many attempts to identify a threshold level of density of peripheral parasitemia that makes it likely that malaria is the cause of a fever.In this analysis, the highest proportion of fever cases attributable to malaria was about 32%. This shows the proportion of febrile morbidity that would have been removed if malaria infections were eliminated among children in this environment. In areas where malaria is endemic e.g. in Nigeria, the presence of fever in a child is normally diagnosed as malaria which usually leads to over diagnosis. In this analysis, among those who had fever about one third had no malaria parasite and this finding has significant implications on the treatment policy, particularly in rural areas where in the absence of laboratory diagnosis, all fever cases would be considered as clinical malaria episodes. Moreover, among children with the malaria parasite and presence of fever, the highest attributable fraction was less than 40%.The different proportion of fever cases that were attributed to fever was not as high as the given prevalence of malaria. So it is still important to have a clinical diagnosis before any fever case is reported as malaria. Our results also showed an increase in fever rate as parasite density increased. This finding is consistent with that done in Mozambique [10] which also reported that the risk of fever was age dependent. The relationship between malaria parasite and fever (measured with temperature) varies among individuals in endemic settings, even though clinical malaria has been related with presence of parasites in the blood and fever, the volume or density of parasite that will lead to fever will vary among individuals [9]. Our findings are also consistent with other studies in terms of the risk of fever which decreased with increasing age. [10, 17 and 18].For children with parasite count <1000µl, the proportion of fever cases that can be attributed to malaria was 3.85% which is lower, compared to children with parasite count ≥1000µl. For those with parasite density <1000µl, it showed that the proportion of fever cases that we can attribute to malaria is small. Only about 4% of fever cases for those in this category can be safely attributed to malaria. We observed that fever rates increases sharply for low exposures and also approaches 1 for high exposures, which suggests a monotone pattern of the conditional probability of P(Y=1|X=x). The logistic estimate for parasite density category of ≥1000μl gave the highest malaria attributable fraction and had the smallest confidence interval followed by the local linear estimate. It can therefore be concluded that the logistic regression method gives a better estimate while classical method exhibited poor performance. This study also confirms that malaria infection remains a major cause of febrile illness during childhood. However, other causes of fever should be considered in the case management of febrile illnesses during childhood.
References
| [1] | Odey Friday, Ekpereonne Esu, Effa Emmanuel,Ekong Udoh, Olabisi Oduwole, Moriam Chibuzor, Angela Oyo-Ita and Martin Meremikwu (2013) management of severe malaria in children under 5 years of age in private and public health facilities in Cross River State, southeastern Nigeria: an audit of current practices. Dove press, Clinical Audit 2013:5 Pp.43–48. |
| [2] | Smith T, Charlwood JD, Kitua AY, Masanja H, Mwankusye S, Alonso PL, Tanner M: Relationships of malaria morbidity with exposure to Plasmodium falciparum in young children in a highly endemic area. Am J Trop Med Hyg 1998, 59: 252-257. |
| [3] | Drakely CJ, Reyburn H, Carneiro I. The effect of altitude in parasite density case definitions for malaria in northeastern Tanzania. Trop Med Int Health 2006, 11: 1178-1184. |
| [4] | Boisier P, Jambou R, Raharimalala L, Roux J. Relationship between parasite density and fever risk in a community exposed to a low level of malaria transmission in Madagascar highlands. A. J Trop Med Hyg 67, 2002: 137-140. |
| [5] | Vounatsou P, Smith T, Kitua AY, Alonso PL, Tanner M. Apparent tolerance of plasmodium falciparum in infants in a highly endemic area. Parsitology 2000.120: 1-9. |
| [6] | Dicko A, Mantel C, Kouriba B, Sagara I, Thera MA, Doumbia S, Diallo M, Poudiougou B, Diakite M, Doumbo Ok. Season, fever prevalence and pyrogenic threshold for malaria disease definition in an endemic area of Mali. Trop Med Int health. 102005: 550-556. |
| [7] | Reyburn H, Ruanda J, Mwerinde O, Drakeley C. The contribution of microscopy to targeting antimalarial treatment in a low transmission area of Tanzania. Malaria J 2006, 5:4. |
| [8] | Taylor TE, Fu WJ, Carr RA, Whitten RO, Mueller JS, Fosiko NG, Liomba NG, Molyneux ME. Differentiating the pathologies of cerebral malaria by postmortem parasite counts. Nat Med 2004, 10:143-145. |
| [9] | Rogier C, Commenges D, Trape JP: Evidence for an age-dependent pyrogenic threshold of Plasmodium falciparum parasitaemia in highly endemic populations. Am J Trop Med Hyg1996, 54:613-619. |
| [10] | Mabunda S, John J.A, Armindo Tiago and Alonso P. (2009). A country wide malaria survey in Mozambique. II. Malaria attributable proportion of fever and establishment of malaria case definition in children across different epidemiological settings. Malaria journal 2009. |
| [11] | Wang W and Dylan S.S (2012). A comparative study of parametric and non parametric estimates of attributable fraction for a semi-continuous exposure. The international journal of biostatistics. |
| [12] | Lauritsen JM.(Ed.) EpiData Data Entry, Data Management and basic Statistical Analysis System. Odense Denmark, EpiData Association,2000-2008. http://epidata.dk. |
| [13] | SPSS Inc. SPSS for windows, version 16.0. Chicago. |
| [14] | Stata12.0,college station, Texas 77845 USA. |
| [15] | Prybylski Dimitri, Khaliq Amir, Fox Emile, Arif R.S and Strickland Thomas. (1999). Parasite density and malaria morbidity in Pakistan Punjab. Am J. Trop Med. Hyg, 61(5). |
| [16] | Koram K.A and Molyneux M.E. (2007). When is ‘malaria’ malaria? The different burdens of malaria infection, malaria disease and malaria-like illnesses. Am. J. Trop. Med. Hyg. 77 (suppl 6), 2007, Pp.1-5. |
| [17] | Griffin J. T., Ferguson N.M., Ghani A. C. Estimates of the changing age-burden of Plasmoduim falciparum malaria disease in sub-Saharan Africa. Nat. Commun. 5: 3136 doi: 10.1038/ncomms4136 (2014). |
| [18] | Nwaorgu O.C and Orajaka B.N. (2011). Prevalence of malaria among children 1-10 years old in communities in Akwa North local government area, Anambra state, SouthEast, Nigeria. International Multi disciplinary Journal, Ethiopia Vol.5 (5), serial No. 22, Pp. 264-281. |

 Abstract
 Reference
 Full-Text PDF
 Full-text HTML