-
Paper Information
- Paper Submission
-
Journal Information
- About This Journal
- Editorial Board
- Current Issue
- Archive
- Author Guidelines
- Contact Us
American Journal of Mathematics and Statistics
p-ISSN: 2162-948X e-ISSN: 2162-8475
2015; 5(6): 329-353
doi:10.5923/j.ajms.20150506.02

Estimating Length of Stay and Duration of Illness for Psychiatric Inpatients using Multivariate Modelling
 Abstract
 Reference
 Full-Text PDF
 Full-text HTML
Gurprit Grover 1, Alka Sabharwal 2, Sakshi Kaushik 1
1Department of Statistics, University of Delhi, Delhi, India
2Department of Statistics, Kirori Mal College, University of Delhi, Delhi, India
Correspondence to: Alka Sabharwal , Department of Statistics, Kirori Mal College, University of Delhi, Delhi, India.
| Email: |  |
Copyright © 2015 Scientific & Academic Publishing. All Rights Reserved.
This work is licensed under the Creative Commons Attribution International License (CC BY).
http://creativecommons.org/licenses/by/4.0/

Mental and behavioural disorders is a significant contributor of global burden of disease. As per WHO estimates, this burden is likely to increase by 15 percent by 2020, significantly impacting health and major social, human rights and economic consequences in all countries of the world. This paper provides a procedure for estimation of length of stay (LOS) in the hospital, total duration of illness (TDI) and recent duration of illness (RDI) using multivariate normal (MVN) and bivariate (BVN) normal distributions. To accomplish this, a retrospective data of 146 patients with complete record history, diagnosed with mental and behavioural disorders (as per APA’s DSM-V as well as the WHO’s ICD-10) is collected from the Department of Psychiatry, Lady Hardinge Medical College & Smt. S.K, Hospital, New Delhi, India for the calendar year 2013-2014. The estimated values of the above mentioned variables are found to be consistent with the observed values. Finally MVN distribution is applied to estimate the variables LOS and TDI for the patients for whom the information on these variables is not known. The model derived in this paper will facilitate the medical fraternity to not only guide the patients about their approximate length of stay in the hospital at the time of admission, but also assist them in development and management of appropriate interventions for patients.
Keywords: Duration of illness, Length of stay, Mardia test, Mental disorder, Multivariate normal distribution, Psychiatric rating scale
Cite this paper: Gurprit Grover , Alka Sabharwal , Sakshi Kaushik , Estimating Length of Stay and Duration of Illness for Psychiatric Inpatients using Multivariate Modelling, American Journal of Mathematics and Statistics, Vol. 5 No. 6, 2015, pp. 329-353. doi: 10.5923/j.ajms.20150506.02.
Article Outline
1. Introduction
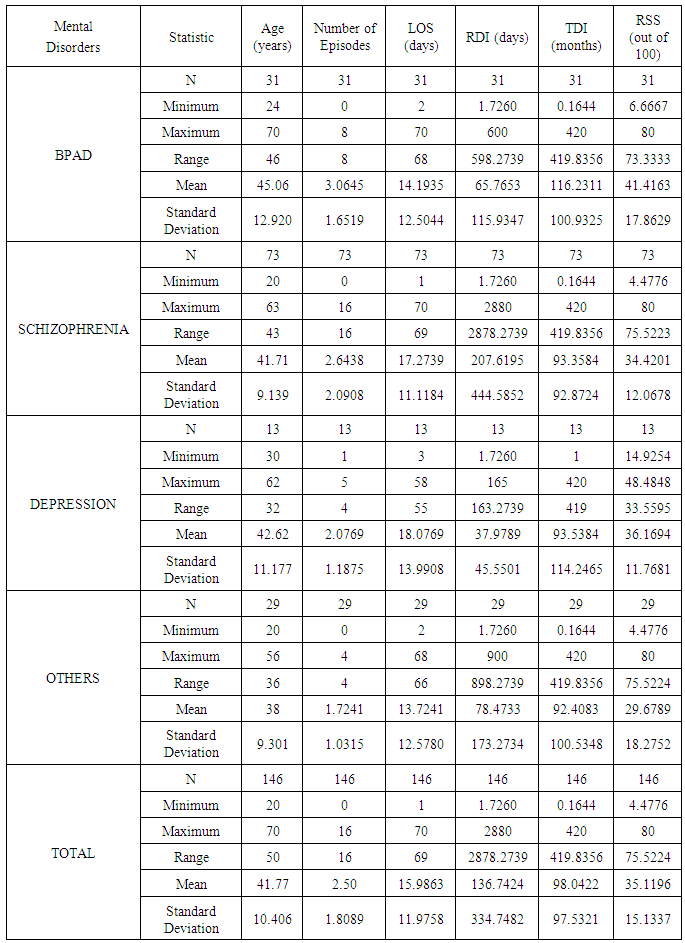
- Mental disorders are common non-communicable diseases rising with epidemic rates globally with over one third of people in most countries reporting sufficient criteria to be diagnosed at some point in their life [1]. Mental illness is associated with a significant burden of morbidity and disability. According to DSM-IV each mental disorder can be conceptualized as “a clinically significant behavioural or psychological syndrome or pattern that occurs in a person and that is associated with present distress (a painful symptom) or disability (impairment in one or more important areas of functioning) or with a significantly increased risk of suffering death, pain, disability, or an important loss of freedom”. Diagnostic and Statistical Manual of Mental Disorders (DSM), a publication of American Psychiatric Association (APA), is a standard classification of mental disorders used by mental health professionals worldwide for diagnosing mental disorders. Another widely used diagnostic manual for mental disorders is chapter V of International Classification of Diseases (ICD), a publication of World Health Organization (WHO). Mental and behavioural disorders account for 12% of the global burden of disease. According to WHO 2001 report, nearly 450 million of world population is suffering from mental disorders [2]. In 2005, the National Commission on Macroeconomics and Health, India reported that 10-20 million (1-2 per cent) of population suffered from severe mental disorders such as schizophrenia and bipolar disorder and nearly 50 million (5 per cent of population) suffered from common mental disorders like depression and anxiety, yielding an overall estimate of 6.5 per cent [4]. The burden of these disorders is likely to increase by 15 percent by 2020 according to WHO estimates [2]. The burden of mental disorders continues to grow with significant impacts on health and major social, human rights and economic consequences in all countries of the world [5]. Severe mental illness is often defined by its duration and the disability it produces. These illnesses include disorders that produce psychotic symptoms, such as schizophrenia and schizoaffective disorder, and severe forms of other disorders, such as major depression and bipolar disorder [6]. Schizophrenia is often described in terms of positive and negative (or deficit) symptoms [7]. Positive symptoms are those that most individuals do not normally experience but are present in people with schizophrenia. Negative symptoms are deficits of normal emotional responses or of other thought processes, and are less responsive to medication [9]. Bipolar disorder causes extreme mood swings ranging from mania or extreme happiness, grandiosity, euphoria or irritability, or decreased need for sleep. Typically a person with bipolar disorder cycles from one extreme to the other while experiencing periods with few or no symptoms in between [10]. Acute and transient psychotic disorder (ATPD) has certain key features, such as acute onset (within 2 weeks) and rapidly changing, variable polymorphic picture, which are accepted as required criteria for diagnosis [12]. Depression is a common mental disorder, characterized by sadness, loss of interest or pleasure, feelings of guilt or low self-worth, disturbed sleep or appetite, feelings of tiredness and poor concentration. It is associated with poorer lifelong health outcomes for the individual which may, in part, be related to suboptimal brain maturational processes [13]. Previous studies suggest that duration of illness, length of stay in the hospital and severity measured by psychiatric rating scales are the three major contributors of mental health of a patient [14]. The duration of mental illness not only reflects the chronic condition of the disorder but also plays a vital role for its diagnosis. According to ICD-10, the diagnosis of schizophrenia depends upon the presence of typical delusions, hallucinations or other symptoms, clearly present for a minimum duration of one month while the duration requirement for the diagnosis of delusional disorder is at least three months. Clearly the efficiency of diagnosis of a mental disorder is dependent on its duration indicating that the initiation of effective treatment is also contingent on the duration of the disease. Length of stay (LOS) in hospital is generally used as an indirect indicator of effectiveness and efficiency of treatment programs [15]. While LOS is not only a final indicator of effective and efficient care, it is a variable of considerable interest in hospital psychiatry as an indicator of resource utilization [16]. Many different questionnaires, interviews, checklists, outcome assessments and other instruments are used by psychiatrists and mental health professionals to aid in treatment planning by helping to establish a diagnosis, identify co morbid conditions, and assess levels of functioning. These are collectively called psychiatric rating scales or rating instruments [17]. The decision whether to hospitalize a patient, and, if so, in what type of setting is one of the most basic, yet, tricky decisions about level of care. Thus, various psychiatric rating scales are used to differentiate among psychiatric patients who require hospitalization from those who are suitable for outpatient care [18]. Previous work reveals that a lot of research has been done for predicting LOS. Huntley ET. al (1998) [19] and Ithman et al (2014) [21] applied regression modelling to predict LOS in hospital with independent predictors: a primary diagnosis of schizophrenia, the number of previous admissions, a primary diagnosis of mood disorder, age and a secondary diagnosis of alcohol- or other drug related disorder; and age, marital status, involuntary admission and diagnosis of an affective disorder or a psychotic disorder, respectively. Anderson et. al (2004) examined whether assessment data from administration of the extended version of the Brief Psychiatric Rating Scale (BPRS-E) to state hospital patients within 72 hours of their admission could be used to predict LOS. Factor analysis extracted the four factors: patient’s resistance to treatment, positive symptoms, mood, and negative symptoms while Discriminant analysis showed that the negative symptoms factor correctly predicted that LOS for 94 percent of cases exceeded the mean LOS. These findings suggest that the severity of negative symptoms can be a useful predictor of LOS among patients with severe and persistent mental illness [20]. Multivariate normal (MVN) distribution is one of the most frequently made distributional assumptions for the analysis of multivariate data. The assumption of multivariate normality is often checked by individually examining the univariate normality through various P-P plots or some other plots but it can be very subjective at times. Further, the marginal normality of each random variable does not guarantee the multivariate normality. Thus, one of the relatively simpler and mathematically tractable ways to find a support for the assumption of multivariate normality is by using the tests based on Mardia’s multivariate skewness and kurtosis measures [25, 26].Grover et. al (2014) applied MVN distribution to a dataset of type-2 diabetic patients for estimating the duration of diabetes on the basis of their latest renal health status. They fitted the MVN distribution model on a dataset of diabetic nephropathy patients with complete information (from the time of diagnosis till termination of study), validated the model by using simulation and then used it for estimating the duration of diabetes for patients with incomplete record history. The results are also derived for bivariate normal (BVN) distribution, as a special case of MVN distribution. Their work has proved that MVN and BVN distributions can contribute meaningfully to approximate the duration of disease and hence evaluate the severity of disease [27]. Despite the massive toll and the powerful impact mental disorders can have on individual and society at large, they do not receive nearly the amount of attention paid to other diseases. While many communicable diseases have been shrinking in terms of the number of people they affect over the last two decades, the global burden of mental illness has largely remained the same. Not much statistical modeling has been applied to mental disorder data. This motivates us to build a model and test its validity for the same. Previous studies reveal that the variables LOS and duration of illness are important contributors for progression of disease while the psychiatric rating scale quantifies the intensity and severity of mental disorder. The information on above mentioned variables is generally available, if not for all, at least for some. Previous studies have presented the important predictors on the basis of qualitative information available, for e.g. Ithman et. al (2014) [21] showed marital status, age, involuntary admission and diagnosis of an affective disorder or a psychotic disorder to be independent variables that predicted length of stay, while in this study we have attempted to use the maximum available quantitative information on variables LOS and duration of illness to estimate the unknown variable. This builds the background of our study. The aim of present study is to derive a model which could be implemented immediately for estimating the duration of illness and LOS in hospital for patients with complete information and also for whom the information on all variables of interest is not known. This model not only estimates the current values of these variables but can also predict the future values for the same.The four variables considered appropriate for this study are length of stay (LOS) in the hospital, recent duration of illness (RDI), rating scale score (RSS) and total duration of illness (TDI). LOS is defined as the duration for which a patient is admitted to a hospital following an episode. TDI is the total length of duration when the patient was symptomatic (as per ICD-10 and DSM-5) for the first time till the current episode whereas RDI is the recent duration for which the patient is symptomatic for the latest (recorded) episode as observed by the patient and/or his acquaintances. RSS (scaled down to 100) is the score of the psychiatric rating scales depicting the status of illness of the patient. This paper attempts to provide a procedure for estimation of LOS in the hospital, TDI and RDI using multivariate and bivariate normal distributions. The joint distribution of four variables: LOS, RDI, RSS and TDI have been analyzed to estimate the LOS, RDI and TDI for patients with mental illness. Prerequisites for application of MVN distribution are checked as follows: Firstly various distributions are fitted to the four variables LOS, RDI, TDI and RSS, and appropriate distributions are selected on the basis of Akaike Information Criterion (AIC) for each random variable [28]. Secondly, univariate normality is checked for each distribution. It is observed that except RSS, univariate distributions of other variables are Gamma and lognormal, on applying log and square root transformations, all the four variables tend to normal distribution. Lastly, multivariate normality has been verified for the variables LOS, RDI, TDI and RSS by applying Mardia’s test [26]. It is observed that the above mentioned four variables are marginally as well as jointly normally distributed after transformation. This supported the usage of four dimensional MVN distribution model to the data.The first dataset used for conducting this study is retrospective data of 146 patients with complete record history, diagnosed with mental and behavioural disorders (as per American Psychiatric Association’s Diagnostic and Statistical Manual of Mental Disorders, Fifth Edition (DSM-V) as well as the World Health Organization (WHO) International Classification of Diseases (ICD-10)), collected from the Department of Psychiatry, Lady Hardinge Medical College & Smt. S.K, Hospital, New Delhi, India for the calendar year 2013-2014. Data set 2 consists of incomplete data of 21 patients with mental disorders, collected from the same hospital. On the basis of the known variables, the unknown variables are estimated using the validated model derived in this paper. Using dataset 1, LOS is estimated by applying the knowledge of conditional expectation under MVN distribution for given values of RDI, RSS and TDI. Further, LOS is obtained by applying conditional expectation under MVN distribution for given values of RDI and RSS. In the similar manner, RDI is obtained conditionally for given values of LOS and RSS. The above procedure is firstly applied to estimate variables for the first dataset for which these variables are already known. The estimated values of the above mentioned variables are found to be very close to their observed values, which validates the above mentioned procedure to be an appropriate method of estimation. Further, the validity of the model is confirmed by using simulation. Finally, MVN distribution is applied to estimate the variables LOS and TDI for the patients belonging to dataset 2 for whom information on these variables is not known. Three dimensional MVN and BVN distributions are also applied as special cases of four dimensional MVN distribution. Not much statistical and clinical work has been done for estimation of total as well as recent duration of mental illness. Also, the application of four dimensional MVN distribution to mental disorders is a novel concept, which, to the best of our knowledge has not been explored previously. This paper not only exhibits a practical approach towards estimation of variables LOS and duration of mental illness but also imparts a theoretically plausible derivation of conditional expectation under four dimensional MVN distribution. The model derived in this paper will facilitate the medical fraternity to not only guide the patients about their approximate length of stay in the hospital at the time of admission, but also assist them in development and management of appropriate interventions for patients. This will further aid in monitoring and evaluating the severity of mental disorders. The course of this paper along with introduction is as follows. In section 2, development of model is discussed. In Section 3, the model is applied to the data. Section 4 discusses the results with previous studies and the paper is concluded in section 5.
2. Methodology
2.1. Multivariate Normal (MVN) Distribution
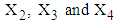
- The random vector
 is said to have a p-dimensional multivariate normal distribution (MVN) with a mean vector
  and variance-covariance matrix
  if it has the joint probability density function of the form [29],
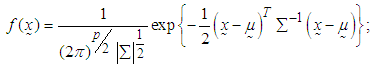
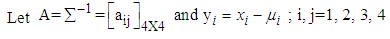
2.1.1. Conditional Density of a 4-Dimensional Random Vector with MVN Distribution
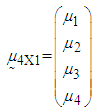
- The 4-dimensional random vector with MVN distribution is a special case of MVN distribution with p=4. Assume a 4-dimensional random vector
 has multivariate normal distribution (MVN) with mean vector
  and variance-covariance matrix
  , i.e.,
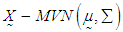 , where
 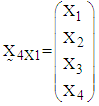 ,
,  and
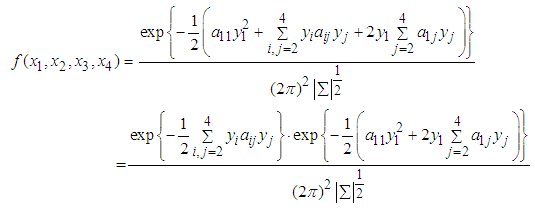
and 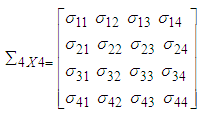 with the joint probability density function [29],
 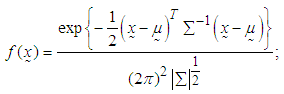 | (1) |
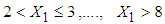
 Since
Since  are jointly normal, the conditional density of
  given
given  is
is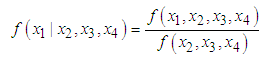 | (2) |
 | (3) |
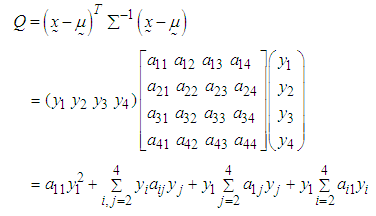 Since
Since  is a symmetric matrix,
 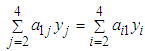 . Thus,
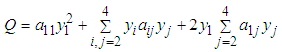 | (4) |
 | (5) |
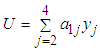 , then
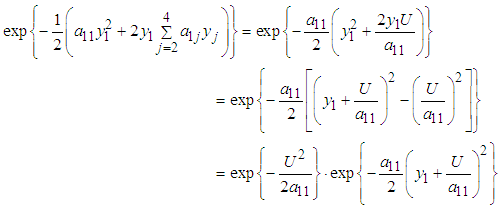 Thus,
Thus, 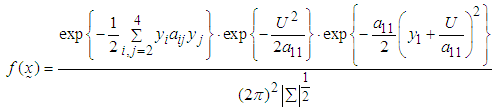
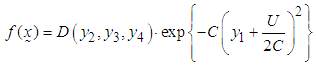 | (6) |
 and,
and,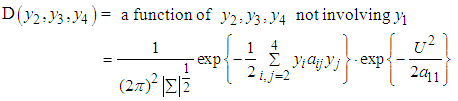 Further,
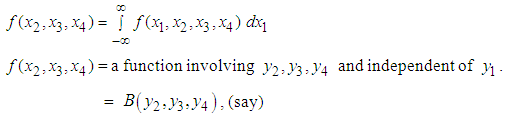 Then the conditional density of
  given
given  has the form:
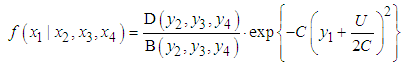 | (7) |
 is normal.The conditional variance of
  (same as the conditional variance of
  is
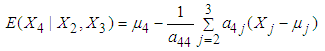
is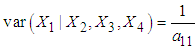 and the conditional mean of
  is
is  Thus, the conditional mean and variance of
  are [37]
 | (8) |
2.1.2. Conditional Density of a 3-Dimensional Random Vector with MVN Distribution
- The 3-dimensional random vector with MVN distribution is a special case of MVN distribution with p=3. Assume a 3-dimensional random vector
 has multivariate normal distribution (MVN) with mean vector
  and variance-covariance matrix
  , i.e.,
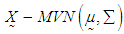 , where,
 ,
,  and
and 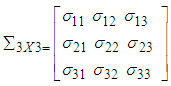 with the joint probability density function [29],
 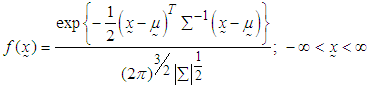 | (9) |
 Proceeding in the similar manner as mentioned in the previous section, the conditional mean and variance of
  can be obtained as
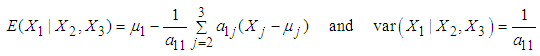 | (10) |
2.1.3. Conditional Density under Bivariate Normal (BVN) Distribution
- The bivariate normal distribution is a special case of MVN distribution with p=2. If
 are two related variables following normal distributions,
  and
and  with correlation coefficient
 , then the joint probability density function of
  is defined as [29],
  Then the conditional expectation under BVN distribution is given as
  | (11) |
2.2. Distribution of Variables
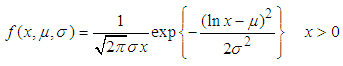
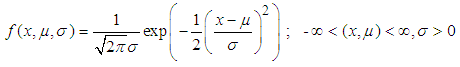
- The response variables under study are assumed to follow some statistical distributions. Among the different distributions applied to the variables under study, Gamma, lognormal and normal distribution fitted those best. Gamma distribution is one of the most widely used distributions in medical research. The lognormal distribution (with two parameters) may be defined as the distribution of a random variable whose logarithm is normally distributed. Thus a normal variate can be obtained from a lognormal variate by applying a logarithmic transformation on it. The resulting transformed variable will follow approximately normal distribution [33]. The normal distributions are a very important class of statistical distributions. They form the base for application of MVN distribution to the joint random variables under study.The probability density functions of aforementioned distributions are defined as follows:
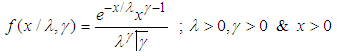
2.2.1. Gamma Distribution
2.2.2. Lognormal Distribution
2.2.3. Normal Distribution
2.3. Transformations
- Many statistical methods require the data to fit assumptions of normal distribution and uniform variance. When data do not fit these, one approach is to make them do so by a mathematical transformation. The most frequently used transformations are the square root, the logarithm, and the reciprocal. The square root can be used for variables which are greater than or equal to zero, the log and the reciprocal can only be used for variables which are strictly greater than zero [30]. In this article square root and logarithm transformations have been applied to the variables under study. Square root and logarithm transformations are a special case of Box-Cox or Power transforms. Box-Cox or Power transforms are a family of functions for transforming data. The various forms of the transforms utilize a single parameter, λ, which is either specified or is computed from the data using some form of optimization procedure on the assumption that the transformed sample is to be normally distributed. The simplest form of power transformation is [31]:
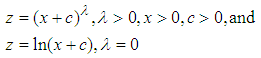 where c is an optional constant. Ahrens and Dieter showed that a suitable square root transformation of a gamma random variable with mean a ≥ 1 yields a probability density close to the standard normal density [32].
2.4. Mardia Test for Multivariate Normality
- Classical methods of multivariate analysis are mostly based on the assumption that the data are coming from a multivariate normal population. Thus, it becomes crucial to test the assumption of multivariate normality of the data at hand. Several statistical and graphical approaches, including the Q-Q plot, P-P plot, box-plot, stem and leaf plot, Shapiro-Wilk and Kolmogorov-Smirnov tests to evaluate the univariate normality, contour and perspective plots for assessing bivariate normality, and the chi-square Q-Q plot to check the multivariate normality, are available [34]. One of the relatively convenient, most widely used and accurate method for testing multivariate normality is by using the tests based on Mardia multivariate skewness and kurtosis measures. The sample measures of multivariate skewness and kurtosis are,
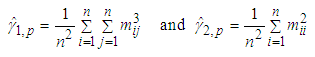 where,
 and, p is the number of variables. The test statistic for skewness,
  , is approximately
  distributed with p(p+1)(p+2)/6 degrees of freedom. The test statistic for kurtosis
  tends to standard normal distribution [26].
2.5. Criteria for Model Checking
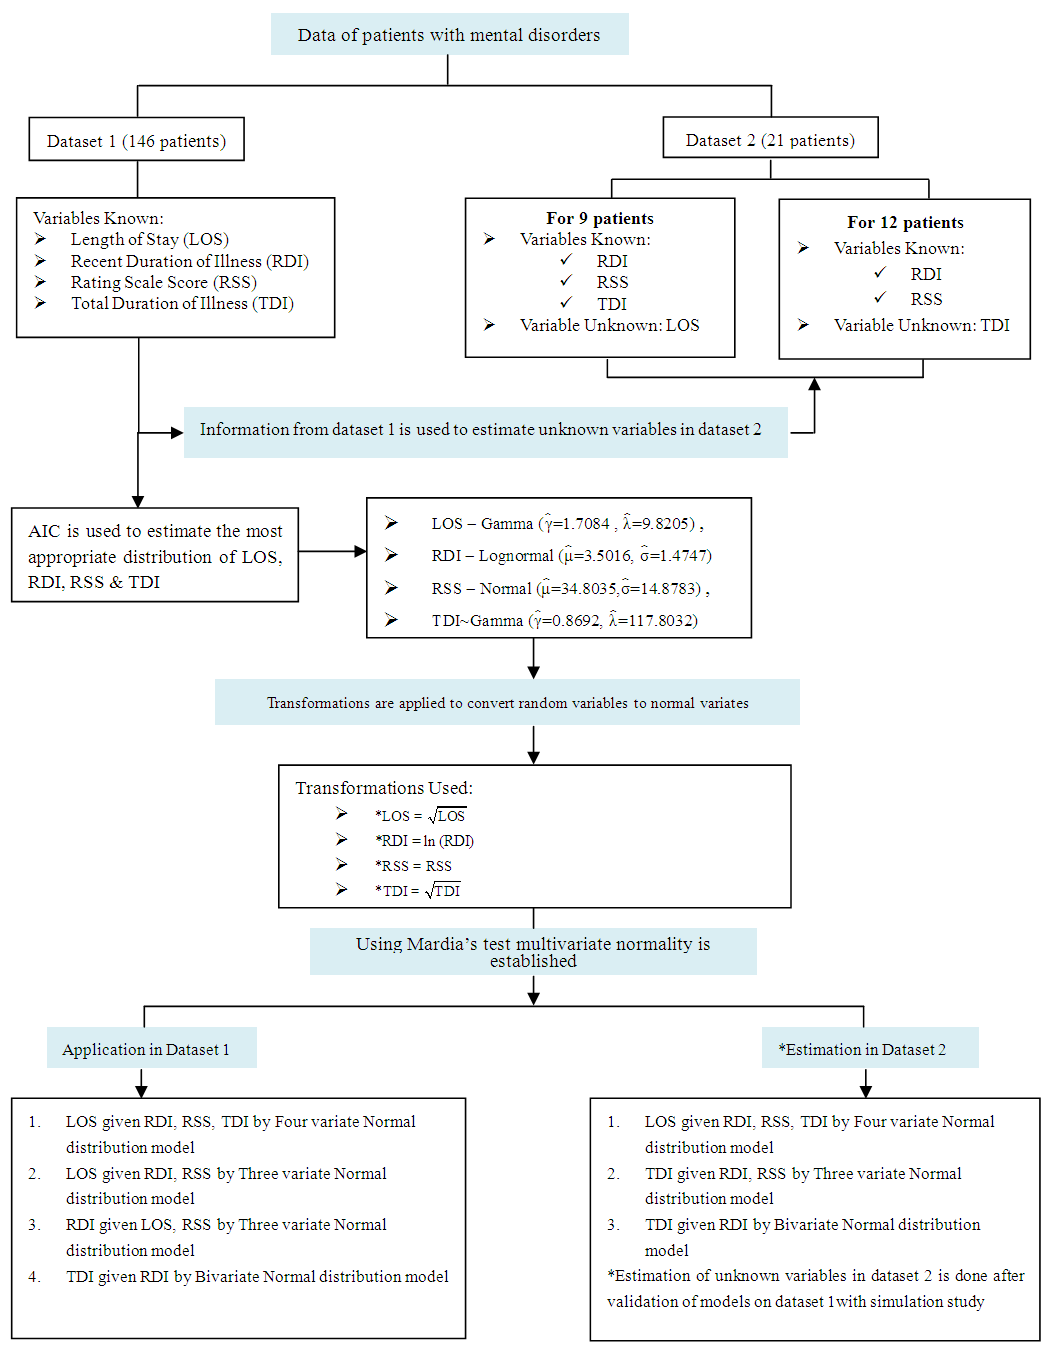
- The distributional assumptions made about the data are a matter of special relevance in medical studies as it critically influences the results obtained. The selection of an appropriate approximating model is critical to statistical inference from many types of empirical data. Application of Akaike Information Criterion (AIC) is one of the most used information criterion for model selection and is defined as:
 Where, L refers to the likelihood under the fitted model and p is the number of parameters in the model. One should select the model that yields the smallest value of AIC because this model is estimated to be “closest" to the unknown reality that generated the data, from among the candidate models considered [28].
3. Application
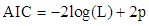
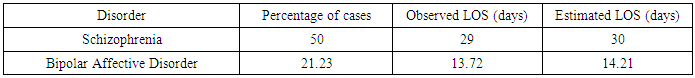
- The medical records for the datasets used in this study have been collected from the Department of Psychiatry, Lady Hardinge Medical College & Smt. S.K, Hospital, New Delhi, India for the calendar year 2013-2014. The patients enrolled in the study are diagnosed with mental and behavioural disorders as per American Psychiatric Association’s Diagnostic and Statistical Manual of Mental Disorders, Fifth Edition (DSM-V) as well as the World Health Organization (WHO) International Classification of Diseases (ICD-10). The patients included in the study belonged to the age group 20-60 years. An attempt is made to include almost equal number of patient from both the genders. The data consisted of patients diagnosed with Bipolar Affective Disorder (BPAD), Schizophrenia, Depression and other disorders. The others category includes disorders viz. Acute Transient Psychotic Disorder (ATPD), Dementia, Psychotic Disorder: Not otherwise Specified (NOS) and Dissociative Motor Disorder. The patients diagnosed with substance abuse, pregnant women and suffering from any other chronic medical illness along with mental and behavioural disorders are excluded from the study. Out of two datasets, the first dataset is a retrospective data of 146 patients diagnosed with mental and behavioural disorders with complete record history. It consisted of the admission and discharge records of all the patients along with the complete details of their recent and previous episode history. Complete demographic and clinical information regarding the subjects is available in their admission records. In the present data, Psychopathology is assessed by the Positive and Negative Syndrome Scale (PANSS), Bush-Francis Catatonia Rating Scale (BFCRS), Brief Psychiatric Rating Scale (BPRS), The Hamilton Rating Scale for Depression (HAMD), Young Mania Rating Scale (YMRS), Hamilton Anxiety Rating Scale (HAM-A) [35-40]. The Complete Blood Count (CBC), Electrocardiogram (ECG) and Magnetic Resonance Imaging (MRI) test reports of all patients are provided. All patients were receiving antipsychotic medications. The entire eating, sleeping and hygienic pattern of patients are noted. 46.58 percent males and 53.42 percent females are included in the study. The percentage of patients observed to be diagnosed with BPAD, Schizophrenia, Depression and others are 21.23, 50, 8.90 and 19.86 percent, respectively. Table 1 represents the descriptive statistics of 146 patients of data set 1 diagnosed with mental and behavioural disorders giving total number, minimum, maximum, range, mean and standard deviation of the variables: age, number of episodes, LOS, RDI, TDI and RSS.
|
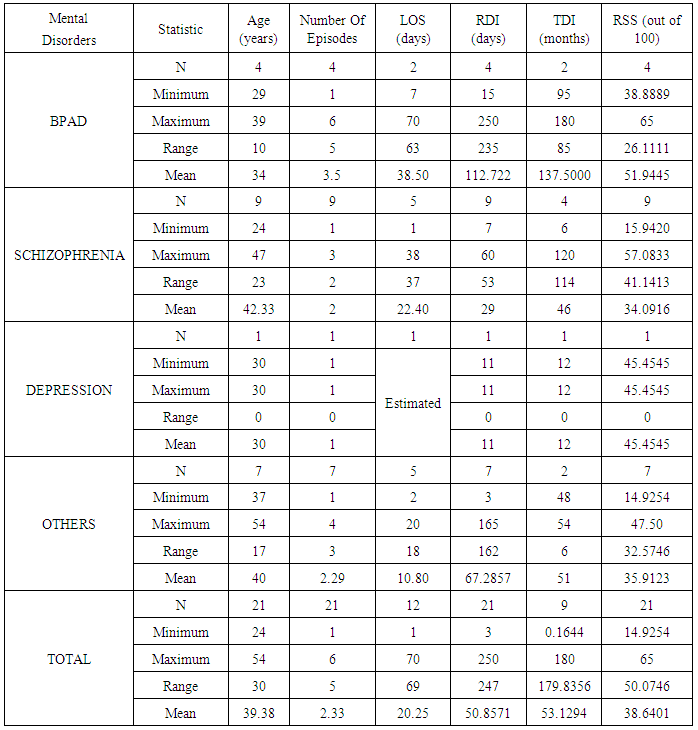
 | Figure 1. Algorithm depicting modelling and its application |
3.1. Distribution Selection for LOS, RDI, RSS and TDI
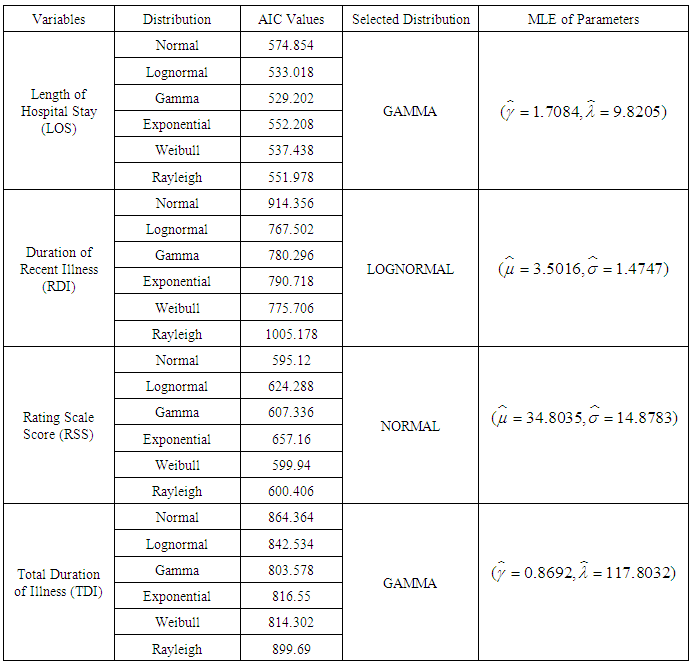
- For testing the assumption of underlying distribution of a random variable most commonly used techniques include use of P-P plots and AIC. While plots give a rough estimate of the distribution of random variable, AIC, on the other hand provides more specific comparative results for model selection. In this article we have utilized AIC to determine the most appropriate distribution for the random variable. From among the various distributions applied to the variable LOS, Gamma distribution is observed to have minimum AIC value of 529.202, suggesting that Gamma distribution with parameters
 is the most appropriate distribution for LOS. For RDI, lognormal distribution is found to have the minimum AIC value of 767.502. Thus, lognormal distribution with parameters
  and
and  is most suitable distribution for RDI. Since normal distribution gives minimum AIC value of 595.12 for the variable RSS, normal distribution with parameters
  is the most accurate distribution for RSS. And for TDI, Gamma distribution has minimum AIC value of 803.578, indicating that Gamma distribution with parameters
  and
and  is the most appropriate distribution for TDI. Table 3 presents the AIC values for different distribution tested for variables LOS, RDI, RSS and TDI along with the maximum likelihood estimations of distributions selected.
|
3.2. Transformations Applied on LOS, RDI and TDI
- Since the distributions selected for LOS, RDI and TDI are not normal, power transformations are applied to them to follow marginal normal distribution approximately. Square root transformation is applied on LOS and TDI as mean values of LOS and TDI are greater than 1 while RDI is transformed using logarithm transformation. The resulting transformed variables *LOS, *RDI and *TDI approximately follow normal distribution as is apparent from graphs of *LOS, *RDI, RSS and *TDI presented in Figure 2, 3, 4 and 5. Hence from Figure 2, 3, 4 and 5 it can be concluded that all the four random variables viz. *LOS, *RDI, RSS and *TDI marginally tend to normal distribution.
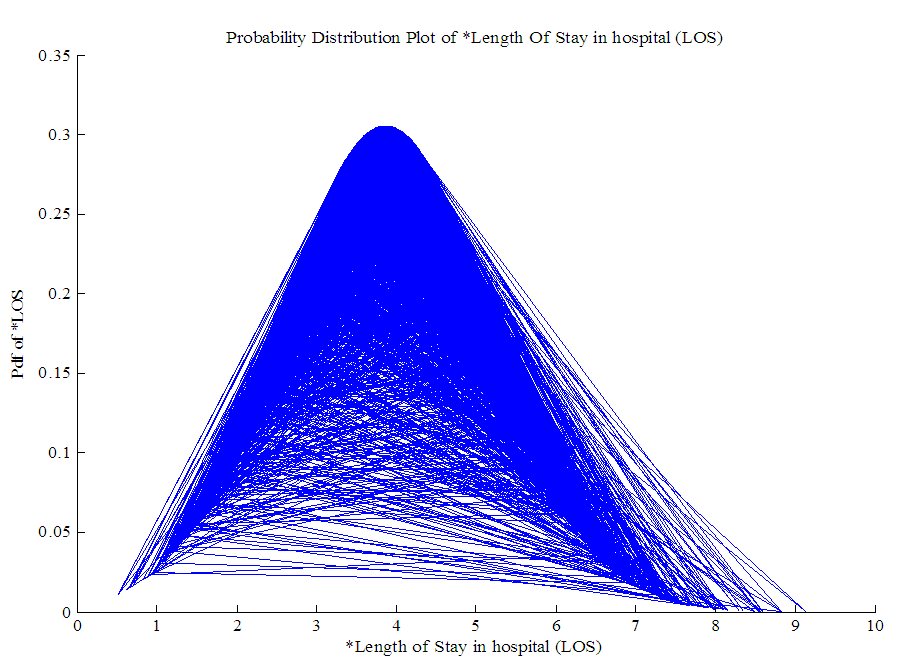 | Figure 2. Normal approximation of * Length of Stay in hospital (LOS) |
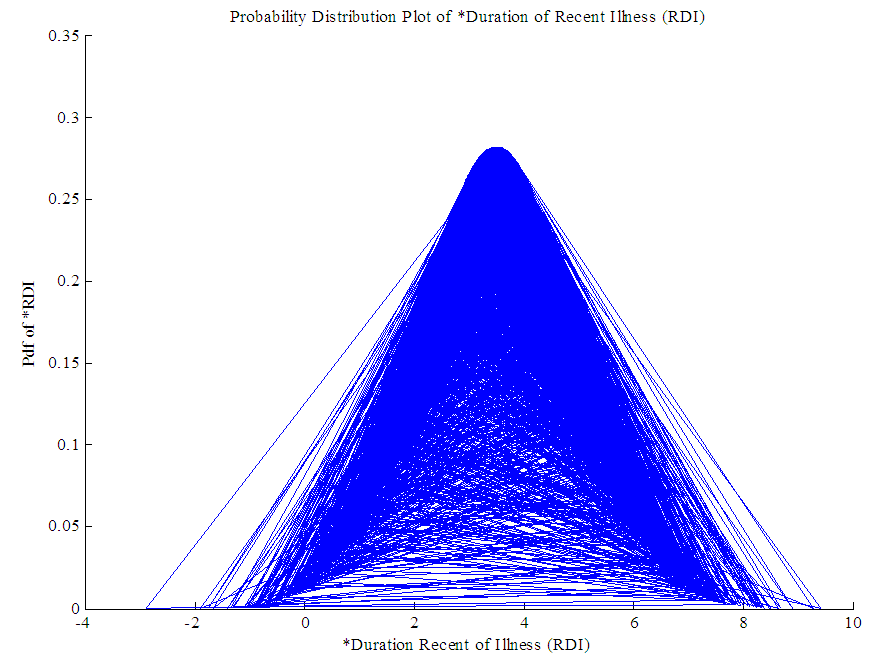 | Figure 3. Normal approximation of * Recent Duration of Illness (RDI) |
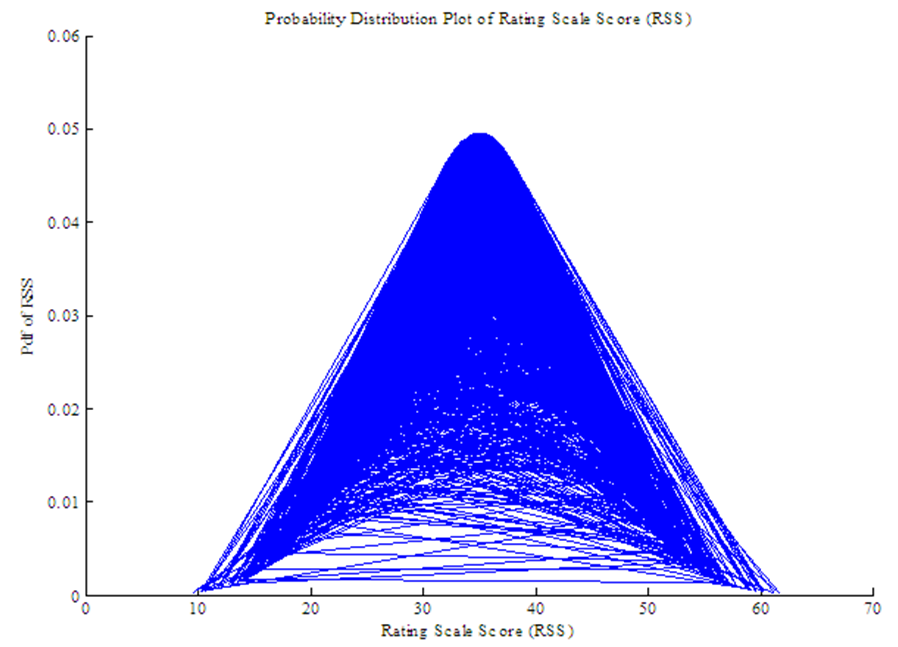 | Figure 4. Normal approximation of Rating Scale Score (RSS) |
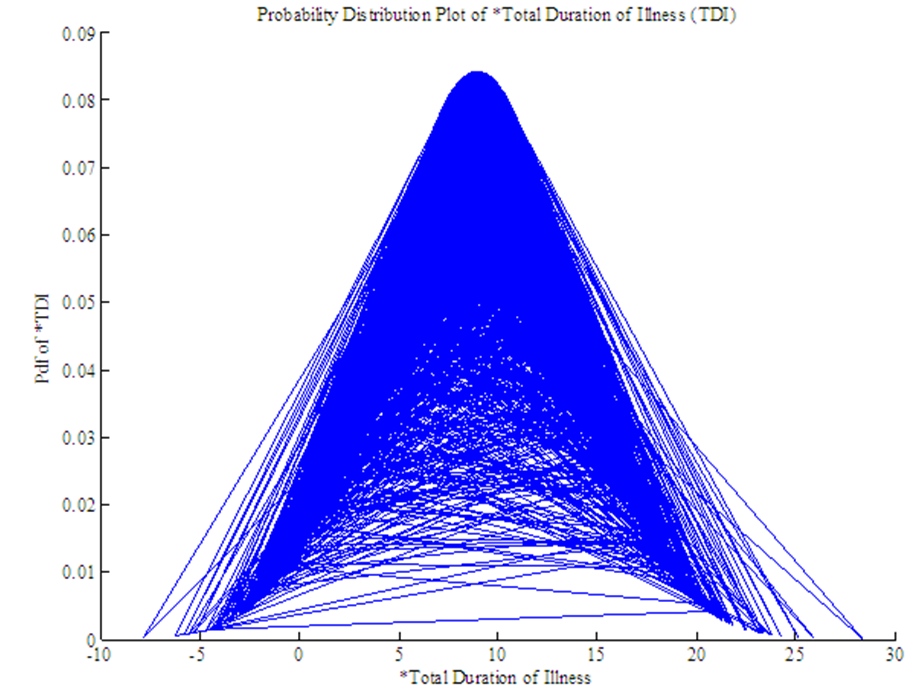 | Figure 5. Normal approximation of *Total Duration of Illness (TDI) |
3.3. Checking Multivariate Normality of *LOS, *RDI, RSS and *TDI
- Next, we have verified multivariate normality of *LOS, *RDI, RSS and *TDI by applying Mardia’s test. Mardia’s measure for skewness and kurtosis are calculated to be
 (at 20 degrees of freedom, p-value =
  ) and
) and  , respectively, connoting that *LOS, *RDI, RSS and *TDI are jointly normally distributed. Thus, MVN distribution can be applied to the variables *LOS, *RDI, RSS and *TDI since they satisfy the basic assumption of multivariate normality. The resulting transformed variables are denoted as
  .
.3.4. Application of Four Variate Normal Distribution
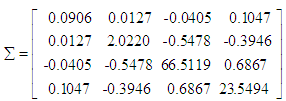
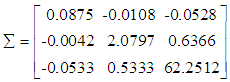
- This section highlights the application of MVN distribution. The joint distribution of variables
 is observed to be MVN distribution, defined as,
 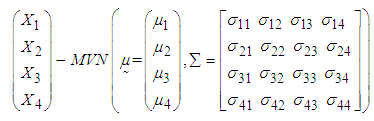 | (12) |

3.4.1. Estimation of Mean LOS for 146 Patients of Dataset 1
- In this section, we have estimated mean LOS for 146 Patients of dataset 1 by applying four variate normal distribution. The first dataset consists of complete data of 146 patients with mental disorders for whom the variables LOS, RDI, RSS and TDI are known. The primary objective of the study is to estimate the LOS, RDI and TDI for these patients by applying MVN distribution. To accomplish this, firstly a random sample of size 5000 is generated from MVN distribution defined in equation (12) and then used to estimate the LOS for different intervals of
 (transformed length of stay in the hospital) defined as
 . The mean LOS for each interval is estimated by applying the following equation (derived in methodology section):
 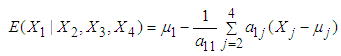 | (13) |
 represents the mean value of
  calculated from simulated data corresponding to a specific interval of
 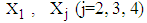 is the observed value of variables
  from the data obtained after applying the respective transformations on variables RDI, RSS and TDI, corresponding to a specific interval while
  is the mean value of
  calculated from the generated data corresponding to the specific interval.
  ,
,  are elements of first row of matrix
  calculated from the generated data corresponding to the specific interval, where,
  ,
,  being covariance between
  . The procedure of calculation for the first interval
  is illustrated below:1. Firstly, the observed data of 146 patients on variables LOS, RDI, RSS and TDI is transformed to
  , where
  ,
,  , and
, and  .2. The mean value of
  is calculated from the data of 146 patients for whom
  is less than or equal to 2 and is found to be 1.2866, while for the same range the mean value of
  computed from simulated data was found to be 1.6147.3. The values of variables
  for patients with
  lied in the ranges
  with mean value 2.0766,
  with mean value 25.2712 and
  with mean value 9.8211.4. The mean vector
  , variance-covariance matrix
  and matrix
  of
of  calculated from the simulated data corresponding to the ranges of observed
  are
are 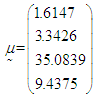
 and
and 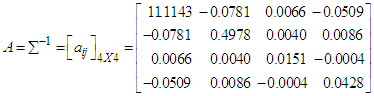 .5. Conditional expectation of
 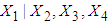 is obtained by substituting the above values in equation (13), which is calculated to be 1.5022. 6. The mean LOS (untransformed) in hospital for patients with
  is then obtained by squaring the value of
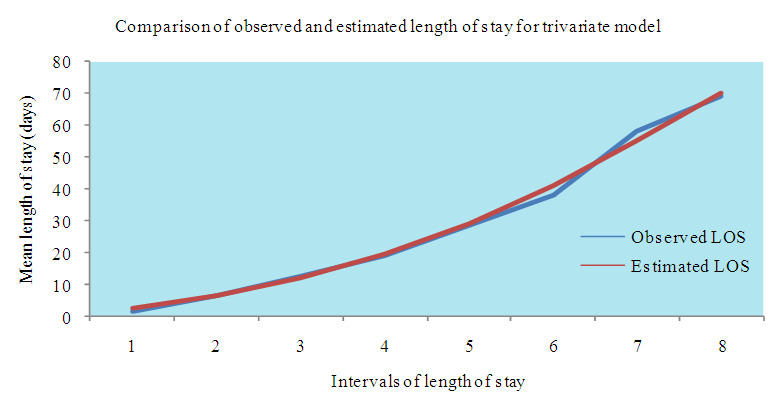
 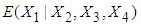 which comes out to be 2.2566 days.Following the above procedure, the mean LOS for all intervals are estimated and presented in Table 4. Figure 5 shows the comparison of observed and estimated LOS given RDI, RSS and TDI of 146 patients of dataset 1 for model derived in this section.
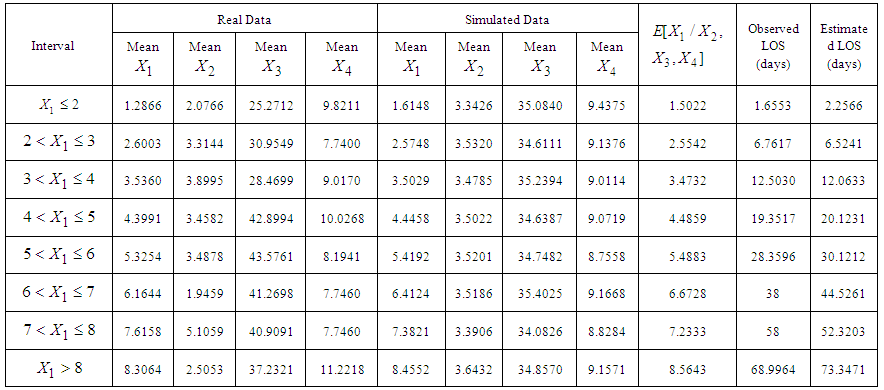 | Table 4. Estimated Mean Length of Stay (LOS) given Recent Duration of Illness (RDI), Rating Scale Score (RSS) & Total Duration of Illness (TDI) for 146 Patients with Mental Disorders for Different intervals of *LOS using simulated data of Size 5000 from MVN Distribution  |
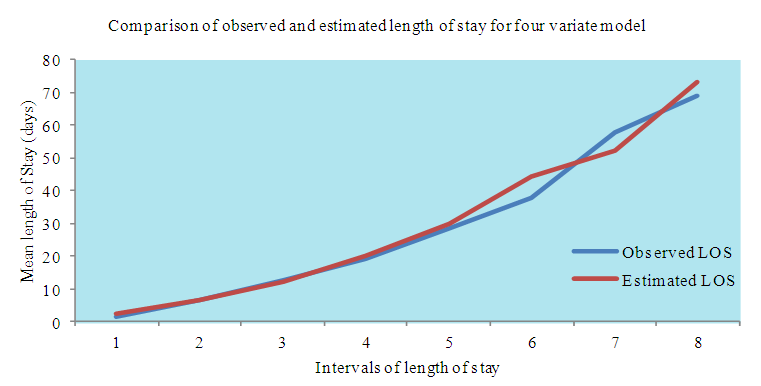 | Figure 6. Comparison of observed and estimated Length of Stay (LOS) of 146 patients of dataset 1 for Four Variate Multivariate Normal Distribution Model |
3.4.2. Estimation of Mean LOS for 9 Patients of Dataset 2
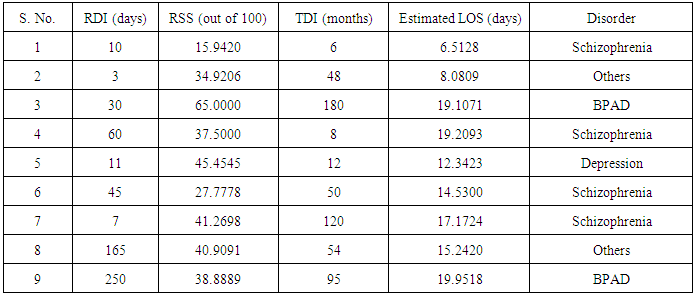
- The LOS in hospital for 9 patients (with missing LOS) with mental disorders of dataset 2 is estimated on the basis of known values of RDI, RSS and TDI. The procedure of calculation of mean LOS for first patient with given mean values of RDI, RSS and TDI is as follows:1. The observed values of RDI, RSS and TDI for first patient are 10 days, 15.9420 (out of 100) and 6 months, respectively, which are treated as mean values for the purpose of calculations.2. These values of RDI, RSS and TDI are transformed as
 ,
, and
and  for application of MVN distribution model. Thus, for first patient,
  ,
,  and
and  .3. The mean vector
  , variance-covariance matrix
  and matrix
  of
of  are calculated from the simulated data corresponding to the ranges of
  , i.e., from simulated data, we have taken means of those observations for which
  .4. Conditional expectation of
  is obtained by substituting the above values in equation (13). 5. The mean LOS in hospital for first patient is then obtained by squaring the value of
  which is found to be 6.5128 days. This gives the mean length of stay in the hospital for the first patient with known RDI, RSS and TDI.The mean LOS for all 9 patients with known RDI, RSS and TDI are estimated by applying the above procedure and are presented in Table 5.
|
3.5. Application of Three Variate Normal Distribution
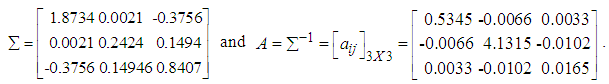
- In this section we have shown the application of MVN distribution with three random variables. The joint distribution of variables
 is observed to be MVN distribution, defined as,
 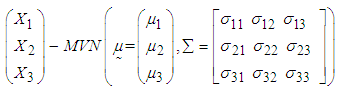 | (14) |
3.5.1. Estimation of Mean LOS for 146 Patients of Dataset 1
- In this section, only three variable viz. LOS, RDI and RSS have been considered. To estimate LOS, firstly a random sample of size 5000 is generated from three variate distribution defined in equation (14) and then used to estimate the LOS for different intervals of
 (transformed length of stay in the hospital) defined as
  ,
,  . The mean LOS for each interval is estimated by applying the following equation (derived in methodology section):
 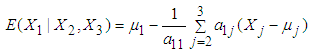 | (15) |
 represents the mean value of
  calculated from simulated data corresponding to a specific interval of
  ,
,  is the observed value of variables
  from the data obtained after applying the respective transformations on variables RDI and RSS, corresponding to a specific interval while
  is the mean value of
  calculated from the generated sample corresponding to the specific interval.
  ,
,  are elements of first row of matrix
  calculated from the generated sample corresponding to the specific interval, where,
  ,
,  being covariance between
  . The procedure for calculation is similar to the procedure followed for four variate case except that here three variables are considered. The steps for calculating mean LOS the interval
  are as follows:1. Firstly, the observed data of 146 patients on variables LOS, RDI and RSS is transformed to
  , where
 .2. The mean value of
  is calculated from the data of 146 patients for whom
  and is found to be 3.5359 while for the same range the mean value of
  computed from simulated data is found to be 3.5029.3. The values of variables
  for patients with
  lied in the ranges
  with mean value 3.8995 and
  with mean value 28.4699.4. The mean vector
  , variance-covariance matrix
  and matrix
  of
of  calculated from the simulated data corresponding to the ranges of observed
  are
are 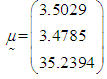
 and
and 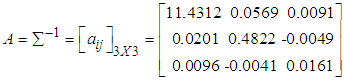 .5. Conditional expectation of
  is obtained by substituting the above values in equation (15) which is calculated to be 3.5080. 6. The mean LOS (untransformed) in hospital for patients with
  is then obtained by squaring the value of
  which comes out to be 12.3061 days.
 3.5.2. Estimation of Mean RDI for 146 Patients of Dataset 1
- For estimating mean RDI given LOS and RSS for 146 patients belonging to dataset 1, procedure similar to the estimation of mean LOS for 146 Patients of dataset 1, described in section 3.5.1 has been followed.Following the above procedure, the mean LOS for all intervals are estimated and presented in Table 6.
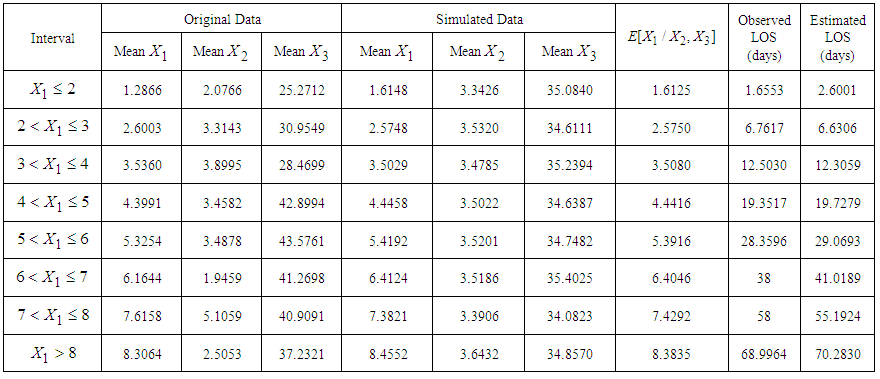 | Table 6. Estimated Mean Length of Stay (LOS) given Recent Duration of Illness (RDI) and Rating Scale Score (RSS) for 146 Patients with Mental Disorders for Different intervals of  using a Generated Sample of Size 5000 from MVN Distribution using a Generated Sample of Size 5000 from MVN Distribution  |
 (transformed recent duration of illness) defined as
  ,
,  . The mean RDI for each interval is estimated by applying the following equation (derived in methodology section):
 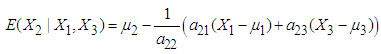 | (16) |
 represents the mean value of
  calculated from simulated data corresponding to a specific interval of
  is the observed value of variables
  from the data obtained after applying the respective transformations on variables LOS and RSS, corresponding to a specific interval while
  is the mean value of
  calculated from the generated sample corresponding to the specific interval.
  ,
,  are elements of second row of matrix
  calculated from the generated sample corresponding to the specific interval, where,
  ,
,  being covariance between
  . The procedure for calculation is similar to the procedure described in section 3.5.1 for estimation of mean LOS for 146 Patients of dataset 1. The steps for calculating mean RDI for the first interval
  are as follows:1. Firstly, the observed data of 146 patients on variables LOS, RDI and RSS is transformed to
  and
and  , where
  .2. The mean value of
  is calculated from the data of 146 patients for whom
  and is 0.7121 while for the same range the mean value of
  computed from simulated data is 0.4565.3. The values of variables
  for patients with
  lied in the ranges
  with mean value 3.9247 and
  with mean value 37.9625.4. The mean vector
  , variance-covariance matrix
 and matrix
  of
of  calculated from the simulated data corresponding to the ranges of observed
  are
are 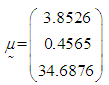
 .5. Conditional expectation of
  is obtained by substituting the above values in equation (16) which is calculated to be 0.4647. 6. The mean RDI (untransformed) for patients with
  is then obtained by squaring the value of
 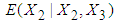 which comes out to be 0.2159 days.Following the above procedure, the mean RDI for all intervals are estimated and presented in Table 7.
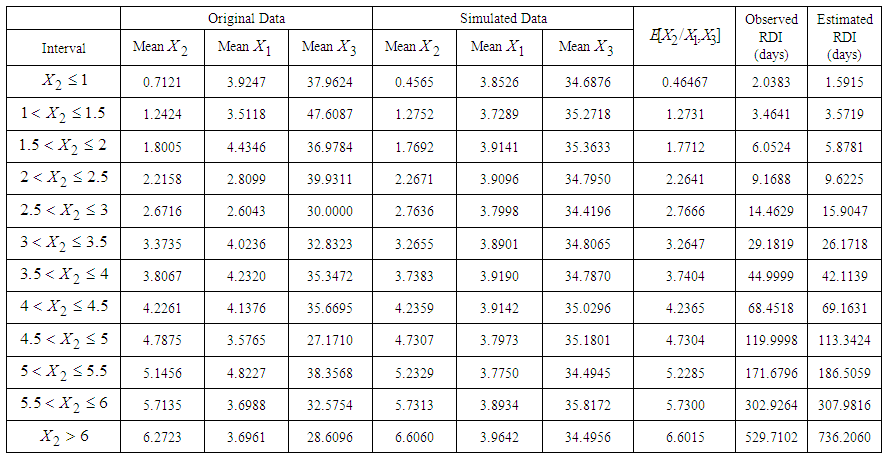 | Table 7. Estimated Mean Recent Duration of Illness (RDI) given Length of Stay (LOS) and Rating scale Score (RSS) for 146 Patients with Mental Disorders for Different intervals of  using a Generated Sample of Size 5000 from MVN Distribution using a Generated Sample of Size 5000 from MVN Distribution  |
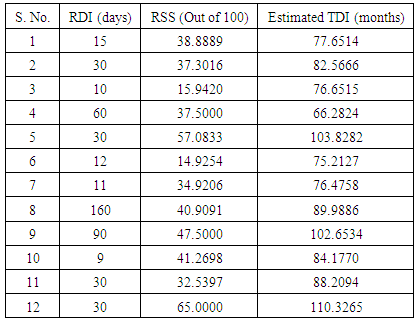
3.5.3. Estimation of Mean TDI for 12 Patients of Dataset 2
- Section 3.5.1 and 3.5.2 highlight the application of three variate normal distribution model and from Tables 6 and 7 and Figure 7 it has been verified that three variate normal distribution model provides estimates very close to the observed values. Thus, it can now be applied to estimate TDI in hospital for 12 patients (with unknown TDI) with mental disorders of dataset 2 on the basis of known values of RDI and RSS. The joint distribution of variables
 is observed to be MVN distribution, defined as,
 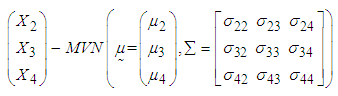 | (17) |
 | (18) |
 | Figure 7. Comparison of observed and estimated Length of Stay (LOS) of 146 patients of dataset 1 for Three Variate Normal Distribution Model |
 represents the mean value of
  calculated from simulated data corresponding to a specific interval of
  is the observed value of variables
  from the data obtained after applying the respective transformations on variables RDI, RSS and TDI, corresponding to a specific interval while
  is the mean value of
  calculated from the generated sample corresponding to the specific interval.
  ,
,  are elements of last row of matrix
  calculated from the generated sample corresponding to the specific interval, where,
  ,
,  being covariance between
  .The procedure of calculation of TDI for first patient with given mean values of RDI and RSS is as follows: 1. The observed mean values of RDI and RSS for first patient are 15 days and 38.8889 (out of 100) respectively, which are treated as mean values for the purpose of calculations.2. These values of RDI and RSS are transformed as
  and
and  for application of MVN distribution model, i.e., for first patient,
  and
and  .3. The mean vector
  , variance-covariance matrix
 and matrix
  of
of  are calculated from the simulated data corresponding to the ranges of observed
  , i.e., from simulated data, we have taken means of those observations for which
  and
and  .4. Conditional expectation of
  is obtained by substituting the above values in equation (18). The mean TDI in hospital for first patients is then obtained by squaring the value of
  which comes out to be 77.6514 months. This gives the mean total duration of illness for the first patient with known RDI and RSS. The mean TDI for 12 patients with known RDI and RSS are estimated by applying the above procedure and are presented in Table 8.
|

3.6. Application of BVN Distribution
- This section highlights the application of BVN distribution. In this section, the application of BVN distribution has been examined for two variables viz. TDI and RDI. The joint distribution of variables
 is observed to be BVN distribution, defined as,
 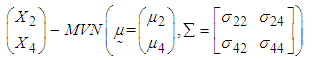 | (19) |
3.6.1. Estimation of Mean TDI for 146 Patients of Dataset 1
- In this section, only two variable viz. RDI and TDI have been considered. For estimating mean TDI, firstly a random sample of size 5000 is generated from BVN distribution defined in equation (19) and then used to estimate the TDI for different intervals of
 (transformed total duration of illness) defined as
  . The mean TDI for each interval is estimated by applying the following equation (derived in methodology section):
 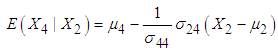 | (20) |
 is the observed value of variable
  from the data obtained after applying the respective transformations on variables RDI and TDI corresponding to a specific interval while
  , the mean value of
  ,
, , variance of
  and
and  , the covariance between
  are calculated from simulated data corresponding to a specific interval of
  . The method for calculating mean TDI for the last interval
  is as follows:1. Firstly, the observed data of 146 patients on variables RDI and TDI is transformed to
  , by using the transformation
 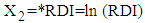 and
and 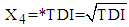 .2. The mean value of
  calculated from the data of 146 patients for whom
  is greater than 18.5 is found to be 20.4939. 3. The mean vector
  and variance-covariance matrix
  of
of  calculated from the simulated data corresponding to the ranges of observed
  are found to be
 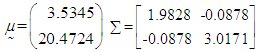 .4. Conditional expectation of
  obtained by substituting the above values in equation (20) is calculated as 20.5137. 5. The mean TDI (untransformed) for patients with
  obtained by squaring the value of
  is 420.8123 months.Following the above procedure, the mean TDI for all intervals are estimated and presented in Table 9.
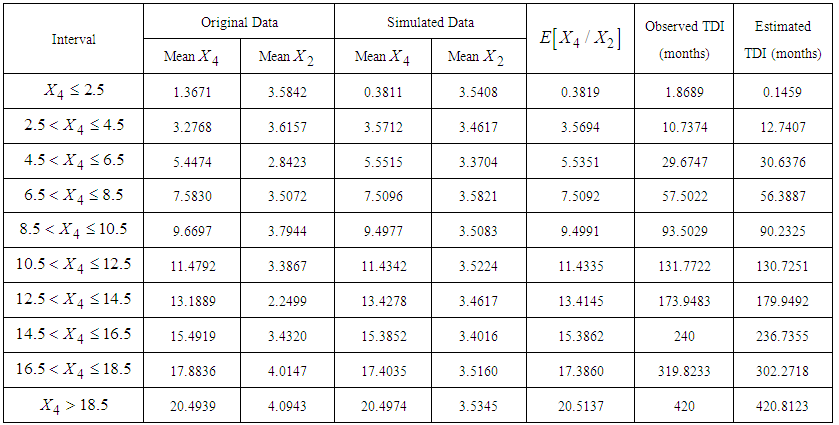 | Table 9. Estimated Mean Total Duration of Illness (TDI) given Recent Duration of Illness (RDI) for 146 Patients with Mental Disorders for Different intervals of  using a Generated Sample of Size 5000 from MVN Distribution using a Generated Sample of Size 5000 from MVN Distribution  |
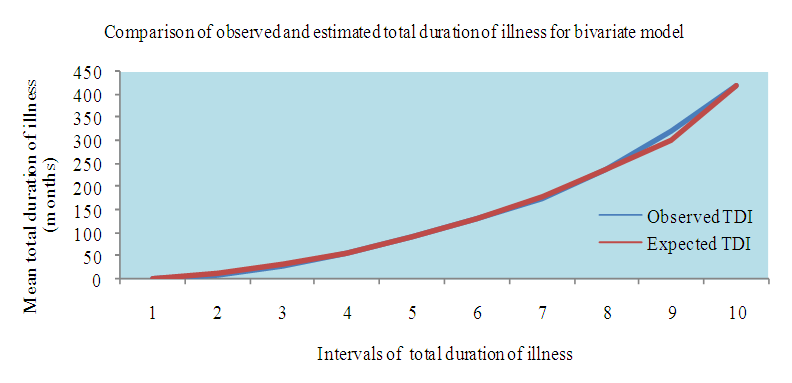 | Figure 8. Comparison of observed and estimated Total Duration of Illness (TDI) of 146 patients of dataset 1 for Bivariate Normal Distribution Model |
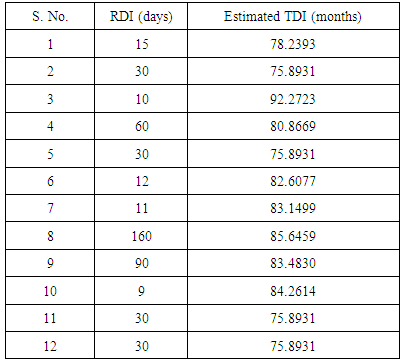
3.6.2. Estimation of Mean TDI for 12 Patients of Dataset 2
- In this section, we applied BVN distribution model to estimate TDI in hospital for 12 patients (with unknown TDI) with mental disorders of dataset 2 on the basis of known values of RDI. The procedure of calculation of TDI for fourth patient with given mean value of RDI is as follows: 1. The observed mean value of RDI for fourth patient is 60 days, which is treated as mean value for the purpose of calculation. 2. This value of RDI is transformed as
 for application of BVN distribution model, i.e., for fourth patient,
  .3. Mean and variance of
  and
and 
 and covariance
  between
  are calculated from the simulated sample corresponding to the ranges of
  , i.e., from simulated data, we have taken means of those observations for which
  .4. Conditional expectation of
  is obtained by substituting the above values in equation (20).The mean TDI given RDI for fourth patient is then obtained by squaring the value of
  which comes out to be 80.8669 months. The mean TDI for 12 patients with known RDI are estimated by applying the above procedure and are presented in Table 10.
|
4. Discussion
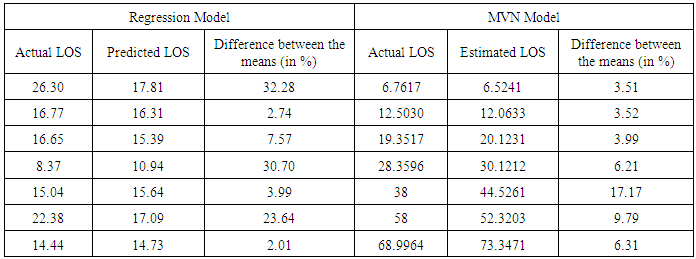
- Mental and behavioural disorders are a significant contributor of global burden of disease. The global prevalence of mental and behavioural disorders among the adult population is estimated to be 10% and contributed to four of the ten leading causes of disability, with one in four families suffering the burden [4]. Thus, the problems related to mental disorders require immediate attention as early intervention can help control mental illness. Previous studies focussed primarily on predicting LOS in hospital [41, 19, 20, 21] but not much statistical research has been done to estimate the duration of illness.The aim of this paper is to provide a model which will elevate the treatment procedure of the patients with mental disorders, further improving their quality of life. The four variables considered appropriate for the study were LOS, RDI, TDI and RSS. These variables are considered to be of utmost importance since they not only reflect the chronicity of the disease but also play a vital role in its diagnosis. These variables are a major determinant of mental health of a patient. They also account for the response of a patient towards the treatment. As per the previous studies, DSM and ICD are the standard tools used by mental health professionals’ world over for classifying and diagnosing patients with mental disorders. In this paper, the data of patients diagnosed with mental disorders is in accordance with DSM-V and ICD-10. According to ICD-10, the diagnostic criteria for different mental disorders change according to the different durations for which a patient was symptomatic, suggesting that the duration of illness plays a cardinal role in diagnosing a patient with a particular mental disorder. Previous studies also reveal the importance of duration of disease in disease progression [22, 23, 24]. In this paper, RDI as well as TDI have been estimated and are also employed for estimating other variable like LOS which is dependent on them. Further, TDI is also estimated for given RDI accentuating the relationship between the two variables. Various psychiatric rating scales have been developed to measure the intensity and severity of mental disorders. For example, the most commonly used rating scale for depression is Hamilton Rating Scale for Depression (HAM-D). In this paper, the various psychiatric rating scales employed are BPRS and PANSS for schizophrenia, HAM-D for depression, YMRS for bipolar disorder, Bush-Francis Catatonia Scale for catatonia and Hamilton Anxiety Rating Scale (HAM-A) for anxiety, which are scaled down to 100 for comparison. Currently, there is a growing interest in the LOS in psychiatric admissions as this may be used as an indicator of efficiency for inpatient care, quality of care and as an important factor in the planning and distribution of hospital resources. LOS is universally recorded with an admission and discharge date, thus making it an easily accessible quantitative measure for statistical purposes [42]. Various studies have been performed to estimate or predict LOS on the basis of some factors. Manuel Martin-Carrasco et. al (2012) predicted LOS on the basis of number of prior episodes and Montgomery-Asberg Depression Rating Scale (MADRS) score for patients with acute mania [43] while Andeson et. al (2004) predicted that extended version of Brief Psychiatric Rating Scale (BPRS-E) can be employed to predict the length of stay (LOS) [41]. In this article, we have predicted LOS on the basis of TDI, RDI and RSS. In this paper, we firstly obtained appropriate univariate distributions of random variables LOS, RDI, TDI and RSS using Akaike Information Criterion (AIC), transformed those variables which are not normally distributed using appropriate power transformations and then corroborated their joint normality using Mardia’s test. AIC is well known method for the identification of an optimum model in a class of competing models. It trades off model’s likelihood against its complexity and provides better criterion of model selection as compared to the conventional Chi-square goodness of fit test. The assumption of multivariate normality of variables forms the basis for the application of MVN distribution. To check this assumption various tests are available but out of them Mardia’s test is a relatively convenient, most widely used and accurate method for testing multivariate normality [27, 28, 44]. The Second step consists in application of MVN distribution to these variables. MVN distribution has been applied to solve various problems related to reliability analysis and hydrological engineering design problems [45, 46]. In medical research, Grover et al (2014) have already established the utility of MVN distribution for estimating the duration of diabetes of a patient with type-2 diabetes [27]. This encourages us for the implementation of MVN distribution to our present study. The Department of Psychiatry, Lady Hardinge Medical College & Smt. S.K, Hospital, New Delhi supported us by providing the data on variables of our interest. Thus, MVN distribution could be applied on variables LOS, RDI, RSS and TDI and the validity of the model could be established. Next, we validated our model by using simulation. Simulation is a procedure to test particular hypotheses and assess the appropriateness and accuracy of a variety of statistical methods in relation to the known truth. These techniques provide empirical estimation of the sampling distribution of the parameters of interest that could not be achieved from a single study and enable the estimation of accuracy measures as the truth is known. The comparison of the simulated results with the true values used to simulate the data provides a measure of the performance and associated precision of the simulation process [47]. Finally, we used our model for estimating the LOS and TDI for patients for whom information on these variables is not known.From our data we observed that the mean LOS in hospital is found to be more for women than for men. The maximum LOS in hospital for a women diagnosed with depression is 58 days while for men it is observed to be 20 days. Maximum mean LOS for patients with schizophrenia is observed to be 70 days. The average TDI is discerned to be 112.39 months for men while for women it is 85.53 months. According to our data, average total duration of Schizophrenia is found to be more for men as compared to women while for depression women are observed to have more total duration than men. Since information on all the variables is rarely available, thus application of multivariate normal (MVN) distribution for four, three and two variables has been demonstrated so that appropriate model can be chosen according to the information available. Previous studies suggest that when the assumptions are met, the statistical power of parametric distribution is higher than nonparametric and semi parametric models. We found in our study that results derived from these models did not vary significantly from each other. As per our study, expected values of the variables estimated did not deviate much from the observed values. Further, the results obtained are also consistent with simulated study. Thus, according to the availability of records, appropriate model could be directly employed for estimation of unknown variable. The findings of our study are not only consistent with previous studies but extend them further, thus, adding new evidence to literature on the estimation of length of stay and total as well as recent duration of illness for patients with mental disorders. Multivariate normal distribution model produces good results for our study but application of this model can be extended to other medical research as well.
5. Conclusions
- The work done in this paper points to the possibility of immediate implementation of a model which, at the time of admittance, could be used to predict the length of time which a given patient would be likely to stay in the hospital, the total duration of illness and the recent duration of illness for which the patient was symptomatic, further stimulating the treatment procedure. Although length of stay is considered to be one of the most important predictor of mental health of an inpatient, our work manifests recent and total duration of illness to be significant factors as well influencing disease progression.Multivariate normal distribution model is complicated, yet, powerful tool for estimating variable of interest if the underlying assumptions are met. In this study, strong transformations are applied to variables to follow marginal normal distribution. In this paper, we applied multivariate normal distribution to the four variables under study (after applying log and power transformations) and found that estimated values of these variables are consistent with the respective observed values. The following can be concluded from the study:Ø The expected length of stay (LOS) from our model (four variate normal distribution) is estimated to be 14.79 days while it is observed to be 15.99 days for the real data. Ø The expected recent duration of illness (RDI) from our model is estimated to be 18.07 weeks; whereas the RDI observed from the real data is 15.50 weeks. Ø The expected RSS estimated by our model is found to be 36.64 while from the real data it is observed to be 35.12. Ø TDI estimated on the basis of our model is 104.27 months whereas form the data it is observed to be 98.04 months. On the basis of these results, it can be concluded that estimated values of expected length of stay (LOS), expected recent duration of illness (RDI), expected rating scale score (RSS) and expected total duration of illness (TDI) are consistent with the observed values. The results depicted in Table 11, based on 146 patients (Lady Hardinge Medical College & Smt. S.K, Hospital, Delhi, India for the calendar year 2013-2014) and simulated data, are comparable to previous study in which the average hospital stay for patients with schizophrenia in the USA is found to be (20.92 +5.42) days and Germany are (37.29 +4.18) days while the average hospital stay for patients with bipolar disorder in the USA are (15.37+6.23) days and in Germany are (40.31 +7.71) days. The above study was given by Auffarth et. al (2008) [55] for large sample data.
|
|
ACKNOWLEDGEMENTS
- We thank Dr. K. E. S Unni, Professor, Department of Psychiatry & Drug De Addiction Center, Lady Hardinge Medical College & Smt. S.K, Hospital, New Delhi, India, for assisting us in gaining a deeper understanding of data concerning mental disorders.
References
| [1] | Cross-national comparisons of the prevalences and correlates of mental disorders. WHO International Consortium in Psychiatric Epidemiology. Bull. World Health Organ. 78 (4): 413–26. 2000. doi:10.1590/S0042-96862000000400003. PMC 2560724. PMID 10885160. |
| [2] | WHO, World Health Report 2001. |
| [3] | Mental Health conditions, https://www.nami.org/Learn-More/Mental-Health-conditions. |
| [4] | Burden of Disease in India, September 2005, National Commission on Macroeconomics and Health, Ministry of Health & Family Welfare, Government of India. |
| [5] | WHO Fact Sheets, October 2014, http://www.who.int/mediacentre/factsheets/fs396/en/. |
| [6] | Severe Mental Illness Defined by Duration and Disability: http://www.bhevolution.org/public/severe_mental_illness.page. |
| [7] | Sims, A. Symptoms in the mind: an introduction to descriptive psychopathology. Philadelphia: W. B. Saunders 2002. ISBN 0-7020-2627-1. |
| [8] | Kneisl, C. and Trigoboff, E. Contemporary Psychiatric-Mental Health Nursing. 2nd edition. London: Pearson Prentice Ltd. p. 371. 2009. |
| [9] | Carson, V.B. Mental health nursing: the nurse-patient journey W.B. Saunders. ISBN 978-0-7216-8053-8. p. 638. 2000. |
| [10] | Mood-related Disorders, http://www.bhevolution.org/public/mood_disorders.page. |
| [11] | World Health Organization. The ICD-10 classification of mental and behavioral disorders. Geneva: World Health Organization; 1992. |
| [12] | Mehta, S. Diagnostic Stability of Acute and Transient Psychotic Disorders in Developing Country Settings: An Overview. PMC, Ment Illn. 2015 Feb 24; 7(1): 5640. doi: 10.4081/mi.2015.5640. |
| [13] | Hagan, C. C., Graham, J. M. E., Tait, R., Widmer, B., van Nieuwenhuizen, A. O., Ooi, C., … Suckling, J. (2015). Adolescents with current major depressive disorder show dissimilar patterns of age-related differences in ACC and thalamus. NeuroImage: Clinical, 7, 391–399. http://doi.org/10.1016/j.nicl.2014.12.019. |
| [14] | Schinnar, A.P., Rothbard, A.B., Kanter, R., Jung, Y.S. An empirical literature review of definitions of severe and persistent mental illness. Am J Psychiatry. 1990; 147(12): 1602-8. |
| [15] | Ballesteros, R.J., Martínez, P.L., Martín, C.M., Ibarra G.N., Bulbena, V.A. Assessment of the Life Skills Profile and the Brief Psychiatric Rating Scale as predictors of the length of psychiatric hospitalization. Actas Esp Psiquiatr. NCBI. Pubmed 2002 Jul-Aug;30(4):225-32. |
| [16] | Kiesler, C.A., Simpkins, C., Morton, T. Predicting length of hospital stay for psychiatric inpatients. Hosp Community Psychiatry. 1990;41:149–54. |
| [17] | Kaplan & Sadock. Concise textbook of clinical psychiatry, 3rd edition. Wolters Kluwer Health, Lippincott Williams & Wilkins. |
| [18] | Roy-Byrne, P., Russo, J., Rabin, L., Fuller, K., Jaffe, C., Ries, R., Dagadakis, C., et al. (1998). A Brief medical necessity scale for mental disorders: Reliability, validity, and clinical utility. The Journal of Behavioral Health Services and Research, 25(4), 412-424. doi:10.1007/BF02287511. |
| [19] | Huntley, D.A., Cho, D.W., Christman, J., Csernansky, J.G. Predicting length of stay in an acute psychiatric hospital. Psychiatric Services 49:1049-1053,vol 8, 1998. |
| [20] | Shawanda, W., Anderson, A.J., Crist, and Nanetta, P. Predicting Inpatient Length of Stay With the Expanded Version of the Brief Psychiatric Rating Scale (Version 4.0), Psychiatric Services 2004 55:1, 77-79. |
| [21] | Ithman, M.H., Goplarkrishna G., Beck, N.C., Das, .J, Petroski, G. Predictors of Length of Stay in an Acute Psychiatric Hospital. J Biosafety Health Educ 2: 119. doi:10.4172/2332-0893.1000119. 2014. |
| [22] | Green, M., Marzo-Ortega,H., Mcgonagle, D., Wakefield, R., Proudman, S., Conaghan, P., Gooi, J. , and Emery, P. (1999). Persistence of mild, early inflammatory arthiritis, The Importance of Disease Duration, Rheumatoid Factor, and the Shared Epitope. ARTHRITIS & RHEUMATISM Vol. 42, No. 10, October 1999, pp 2184–2188. |
| [23] | Anderson, J. J., Wells, G., Verhoeven, A.C., Felson, D.T. (2000). Factors predicting response to treatment in rheumatoid arthritis: the importance of disease duration. Arthritis Rheum. 2000 January; 43(1): 22–29. doi: 10.1002/1529-0131(200001). |
| [24] | Grover, G., Sabharwal, A. A parametric approach to estimate survival time of diabetic nephropathy with left truncated and right censored data. International Journal of Statistics and Probability, Vol. 1, No. 1 (2012). DOI: 10.5539/ijsp.v1n1p128. |
| [25] | Multivariate analysis concepts, http://support.sas.com/publishing/pubcat/chaps/56903.pdf. |
| [26] | Mardia, K.V. Measures of multivariate skewness and kurtosis with applications. Biometrika, 57(3):519–530, 1970. |
| [27] | Grover, G., Sabharwal, A., Mittal, J. Application of Multivariate and Bivariate Normal Distributions to Estimate Duration of Diabetes, International Journal of Statistics and Applications, 2014; 4(1): 46-57.doi:10.5923/j.statistics.20140401.05. |
| [28] | Bradman, M.J., Clark, T.G., Love, S.B., Altman, D.G., 2003, survival analysis part III: Multivariate data analysis-choosing a model and assessing its adequacy and fit, British Journal of Cancer, 89, 605-11, doi: 10.1038/sj.bjc.6601120. |
| [29] | Johnson, N. L., and Kotz, S., Distributions in statistics: Continuous multivariate distributions, John Wiley & Sons, New York, 1972. |
| [30] | Transformations, http://www-users.york.ac.uk/~mb55/msc/clinbio/week5/transfm_gif.pdf. |
| [31] | Box-Cox and Power transforms, http://www.statsref.com/HTML/index.html?freeman-tukey.html. |
| [32] | Ahrens, J.H., Dieter, U. Generating gamma variates by a modified rejection technique. Communications of the ACM, Vol. 25, Issue 1, Jan 1982, Pages 47-54. doi>10.1145/358315.358390. |
| [33] | Crow, E.L., and Shimizu, K. Lognormal Distributions: Theory and Applications, Statistics, textbooks and monographs, vol 88, Marcel Dekker, Inc, New York, 1988. |
| [34] | Burdenski, T. Evaluating univariate, bivariate, and multivariate normality using graphical and statistical procedures. Multiple Linear Regression Viewpoints, 26(2): 15–28, 2000. |
| [35] | Kay, S, R.., Fizbein, A., Opler, A. (1987) The positive and Negative Syndrome Scale (PANSS) for schizophrenia. Schizophrenia Bulletin, 2, 261-276. |
| [36] | Hamilton, M. J. (1960). A rating scale for depression. J Neurol Neurosurg Psychiatry. 1960 Feb; 23(1): 56–62. |
| [37] | Overall, J.E, Gorham, D.R. (1962). The brief psychiatric rating scale. Psychological Reports 1962 vol. 10, pp799-812. |
| [38] | Hamilton, M. The assessment of anxiety states by rating. Br J Med Psychol 1959; 32:50–55. |
| [39] | Young, R.C., Biggs, J.T., Ziegler, V.E., Meyer, D.A. A rating scale for mania: reliability, validity and sensitivity. Br J Psychiatry 1978; 133:429–35. |
| [40] | Bush, G., Fink, M., Petrides, G., Dowling, F. and Francis, A.. Catatonia. I. Rating scale and standardized examination. Acta Psychiatrica Scandinavica, Volume 93, Issue 2, pages 129–136, February 1996. |
| [41] | Anderson, S.W., Crist, A.J., Payne, N. Predicting Inpatient Length of Stay With the Expanded Version of the Brief Psychiatric Rating Scale (Version 4.0). Psychiatric Services 55, 2004. |
| [42] | Adegunloye, O.A., Yussuf, A.D., Ajiboye, P.O., Issa, B.A. and Buhari, O.I.N. (2009). Correlates of Length of Stay among Psychiatric In-Patients in a Tertiary Health Institution in Nigeria. Research Journal of Medical Sciences, 3(2), 56-61. |
| [43] | Martin-Carrasco et al.: Number of prior episodes and the presence of depressive symptoms are associated with longer length of stay for patients with acute manic episodes. Annals of General Psychiatry 2012 11:7. |
| [44] | Harada,T., Ariyoshi, N., Shimura, H., Sato, Y., Yokoyama, I., Takahashi, K., Yamagata,S., Imamaki, M., Kobayashi, Y., Ishii, I., Miyazaki, M., Kitada, M. Application of Akaike information criterion to evaluate warfarin dosing algorithm. Thromb Res. 2010 Sep; 126(3): 183-90. doi: 10.1016/j.thromres.2010.05.016. |
| [45] | Lipow, M., and Eidemiller, R. L., 1964. Application of the bivariate normal distribution to a stress vs strength problem in reliability analysis, Technometrics, 6(3), 325-328, http://www.jstor.org/stable/1266043. |
| [46] | Yue, S., 1999. Applying bivariate normal distribution to flood frequency analysis, Water International, 24(3), 248-254. http://dx.doi.org/10.1080/02508069908692168. |
| [47] | Burton, A., Altman, D.G., Royston, P..and Holder, R.L. The design of simulation studies in medical statistics. STATISTICS IN MEDICINE Statist. Med. 2006; 25:4279–4292. www.interscience.wiley.com. DOI: 10.1002/sim.2673. |
| [48] | The Multivariate Normal Distribution, http://www.math.uiuc.edu/~r-ash/Stat/StatLec21-25.pdf. |
| [49] | Mental Health prevalence in U. S., http://www.nimh.nih.gov/health/statistics/prevalence/any-mental-illness-ami-among-adults.shtml. |
| [50] | WHO, Fact files, http://www.who.int/features/factfiles/mental_health/mental_health_facts/en/index4.html. |
| [51] | Hopko, D.R., Lachar, D., Bailley, S.E., et al: Assessing predictive factors for extended hospitalization at acute psychiatric admission. Psychiatric Services 52:1367–1373, 2001. |
| [52] | Woerner, M.G., Mannuzza, S., Kane, J.M. Anchoring the BPRS: an aid to improved reliability. Psychopharmacology Bulletin 24: 112–117, 1998. |
| [53] | Rudorfer, M.V., Henry, M.E., Sackeim, H.A. (2003). Electroconvulsive therapy. In A Tasman, J Kay, JA Lieberman (eds) Psychiatry, Second Edition. Chichester: John Wiley & Sons Ltd, 1865–1901. |
| [54] | Ect, https://www.sane.org/information/factsheets-podcasts/445-electroconvulsive-therapy-ect. |
| [55] | Auffarth I., Busse R., Dietrich D., Emrich H. (2008). Length of Psychiatric Inpatient Stay: Comparison of Mental Health Care Outlining a Case Mix From a Hospital in Germany and the United States of America. German Journal of Psychiatry • http://www.gjpsy.uni-goettingen.de • ISSN 1433-1055. |