-
Paper Information
- Previous Paper
- Paper Submission
-
Journal Information
- About This Journal
- Editorial Board
- Current Issue
- Archive
- Author Guidelines
- Contact Us
American Journal of Mathematics and Statistics
p-ISSN: 2162-948X e-ISSN: 2162-8475
2015; 5(5): 259-264
doi:10.5923/j.ajms.20150505.06
On the Use of P-Charts in the Quality Control of Students Performance in Tertiary Educational System Using MINITAB
 Abstract
 Reference
 Full-Text PDF
 Full-text HTML
Odunayo J. Braimah1, Monrufat B. Abdulsalam2
1Department of Statistics, Abdulraheem College of Advanced Studies, Igbaja (An Affiliate of Al-Hikmah University, Ilorin, Kwara State, Nigeria)
2Department of Computer Science, Abdulraheem College of Advanced Studies, Igbaja (An Affiliate of Al-Hikmah University, Ilorin, Kwara State, Nigeria)
Correspondence to: Odunayo J. Braimah, Department of Statistics, Abdulraheem College of Advanced Studies, Igbaja (An Affiliate of Al-Hikmah University, Ilorin, Kwara State, Nigeria).
| Email: |  |
Copyright © 2015 Scientific & Academic Publishing. All Rights Reserved.
This paper focuses on monitoring the teaching/learning process in an Advanced College in Kwara State, Nigeria to see if the service of the teachers to the students is meeting set academic standard of the College. This aim will be achieved by monitoring the failure rate of the students after the end of an academic session. The results of thirty courses taken by some departments in the college of Natural Sciences were extracted (total number of students who took various courses and number of students failing these courses) and the proportions of failures were obtained using Excel. Proportion defective (P) control chart is used to monitor the failure rate (shift in process mean) using statistical software software (MINITAB 13). The center line (CL), upper control limit (UCL) and the P-control chart is plotted. The courses that correspond to sample number 1, 2, 4, 6, 15, 16, 17, 18, 21, 22, 23, 26 and 30 are out of statistical control (that is, the failure rate of students in these courses were too high and should not be accepted by the management).Based on our findings, recommendation was made to the management to implement measures on the part of teachers and students in order to keep the process in control (reduce the failure rate).
Keywords: MINITAB, Upper Control Limit (UCL), Center Line (CL), Shift, Process Mean, Advanced College, Kwara, Nigeria, Algorithm
Cite this paper: Odunayo J. Braimah, Monrufat B. Abdulsalam, On the Use of P-Charts in the Quality Control of Students Performance in Tertiary Educational System Using MINITAB, American Journal of Mathematics and Statistics, Vol. 5 No. 5, 2015, pp. 259-264. doi: 10.5923/j.ajms.20150505.06.
Article Outline
1. Introduction
- Education systems have always had some kinds of checks and balances. These are put in place to maintain quality or standards in education institutions and systems, and to try to improve them. Only recently, however, have these been referred to as quality assurance. In some ways, quality assurance in education can be seen as building on the traditional checks and balances in the systems. In other ways, quality assurance in education is something rather different, and is new to education. This paper considers the teaching/ learning process of a College of Advanced Studies in 2013/2014 academic year by looking into failure rates to see it there is a shift in the process means.
1.1. College Internal Examinations
- The Nigeria school system, like school systems in other countries, has a tradition of internal evaluation. Internal exams are tests that are set by the school to assess and evaluate the performances of both the teacher and student at the end of an academic period. This type of system ensures that all students in various departments take the exams, in order to verify that they have attained a certain level of education. They are used to check what individual students have learned, and to give them certificates on the basis of their achievements in the exam and to place them in next classes. However, they are also an important mechanism for checking up on whether teachers and schools are teaching the prescribed curriculum appropriately. If students are not properly examined following the standard, it implement that their teachers may be lazy, corrupt and incompetent and set exams that are much too below the standard, Moore, (2004). External examination is therefore a way of ensuring that all written exams are meeting the standard. Institutional management can take action if, for example, a school has too high failure rate in a particular course.Within tertiary institutions, Nigeria also has a system of external evaluation which is used to monitor and maintain standards. For each examination that is set by one university, an expert in the same field at a different university checks the question paper, as well as a sample of the students’ scripts. External examiners also provide comments on the standard of the taught course. So, through this system, there is some control over what happens in different institutions. The system is known as “moderation” or “peer review” because it is a peer (an equal) within the same field, and not a government bureaucrat or external quality assurance agent, who is checks up on the quality of courses, question papers and the standard of marking (henceforth we will refer external evaluation as moderation). One of the features of a peer review system is that peers decide on what basis they will evaluate and judge each other’s work. Experts within particular fields are seen as the best people to make decisions about quality.There are many criticisms of exams as mechanisms for checking on individual learners, on teachers and on schools. Within higher education the criticisms are different. The main criticisms are:1. Corruption: Academics in one institution may ask their friends in other institutions to review their courses and exams, and in return review their friends’ courses, mutually agreeing not to point out bad practice. 2. Incompetence: If moderators/peer reviewers are not sufficiently expert in their subject, they may not see the weaknesses of the course or exam they are reviewing. 3. Lack of seriousness: Some people argue that the moderation/peer review system is not regarded sufficiently seriously by academics, and that not enough attention is paid to it. 4. Lack of transparency: Because of the nature of the peer review system, it is difficult for government to judge the performance of different universities. In terms of schools, many people will argue that, despite their flaws, exams are the best and most fair way of testing students, and therefore teachers and schools. Similarly, with regard to higher education, the view of many is that there is no other way of making judgments because only expert professionals within particular fields can make judgments about standards in their field.
2. Materials and Method
- Quality assurance is a term that is new to education, but that has rapidly become very important. What exactly is quality assurance in student’s performances (result)? Why do we need it? Does it really improve quality? In the realm of education, quality is the extent to which participants feel the educational and grading processes are corresponding to the specified requirements. Stakeholders in science and education are becoming interested in quality monitoring. Using reliable research methods, educational institutions must determine how well participants' needs are met and how reliable products/services are. The College grading system is; (A (70 to 100), B (60 to 59), C(50 to59), D(45 to 49), E(40 to 44) and F(0 to 39)).In 1924, Walter Shewhart of Bell Telephone Laboratories introduced the concept of statistical quality control in order to assess and ensure quality of mass-produced goods. Shewhart believed that variation always exists in processes, and that the variation can be studied, monitored, and controlled using statistics. In particular, Shewhart developed a statistical tool called the control chart. Such a chart is a graph that can demonstrate when a process needs to be adjusted and when the process should be left alone. Following World War II, neither statistical quality control nor the statistical control charts were greatly used. The man credited with turning this situation around is W. Edwards Deming, Ducan (1974). By following Deming's philosophy, quality culture was introduced as well as the overall approach of applying quality principles to all company activities. This philosophy is named ‘total quality management’ (TQM) or ‘total quality control’ (TQC). Deming (1986) summarized the fundamentals of his approach to quality and productivity improvement in 14 points. He stressed that implementation of these 14 points requires both changes in management philosophy and the use of statistical methods. Additionally, Deming believed it necessary to follow every point, not merely some of them.
2.1. W. Edwards Deming's 14 Points
- 1. Create constancy of purpose toward improvement of product and service with a plan to become competitive, stay in business, and provide jobs.2. Adopt a new philosophy.3. Cease the dependence on mass inspection.4. End the practice of awarding business on the basis of price tag.5. Constantly improve the system of production and service to improve quality and productivity, and thus constantly decrease costs.6. Institute training. Workers should know how to do their jobs and to be aware of how their jobs affect quality and the success of the company.7. Institute leadership. The job of management is leadership, not mere supervision.8. Drive out fear, so that everyone may work more effectively for the company.9. Break down organizational barriers.10. Eliminate slogans, exhortations, and arbitrary numerical goals and targets for the workforce that urges the workers to achieve new levels of productivity and quality without providing methods.11. Eliminate work standards and numerical quotas. Work standards and numerical quotas that specify the quantity of goods to be produced while quality is ignored are counterproductive and should be eliminated.12. Remove barriers that deprive employees of their pride in workmanship.13. Institute a vigorous program of education and self-improvement.14. Take action to accomplish the transformation. A management structure that is committed to continuous improvement must be put in place.Deming’s work was oriented mostly to the production of goods, but lately his principles have been implemented in the social sciences.
2.2. Statistical Process Control (SPC)
- The main aim of Statistical Process Control (SPC) is continuous process improvement. SPC is often used to monitor and improve manufacturing processes. However, it is also commonly used to improve service quality. For instance, we might use SPC to improve the quality of the grading process. In order to understand SPC methodology, we must realize that the variations we observe in quality characteristics are caused by various factors. These factors include equipment, materials, people, methods and procedures, the environment, etc.In grading, a common cause of variation is mainly student’s knowledge. Common cause variation can be substantial. Obsolete or poorly maintained equipment, a poorly designed process, and inadequate instructions for students are examples of common causes that might significantly influence process output. Together, the important and unimportant common causes of variation determine the usual process variability. That is, these causes determine the amount of variation that exists when the process is operating routinely. We can reduce the amount of common cause variation by removing some of the important common causes. Reducing common cause variation is usually a student's responsibility, for instance, poor preparation for exams, concentration, tiredness, etc.Assignable causes are sources of unusual process variation. These are intermittent or permanent changes in the process that are not common to all process observations and that may cause important process variation. Assignable causes are usually of short duration, but they can be persistent or recurring conditions. In the grading process, assignable causes could be the product of changes in the professor’s objectivity.One objective of SPC is to detect and eliminate assignable causes of process variation. By doing this, we reduce the amount of process variation. This results in improved quality:1. When a process is influenced only by common cause variation, it will be in statistical control.2. When a process is influenced by one or more assignable causes, it will not be in statistical control.In general, in order to bring a process into statistical control, we must find and eliminate undesirable assignable causes of process variation, and we should (if possible) build desirable assignable causes into the process. When we have done these things, the process is what we call a stable, common cause system. This means that the process operates in a consistent fashion and is predictable. Since there is no unusual process variation, the process meets all the requirements and is doing all it can be expected to do. When a process is in statistical control, management of the faculty can estimate the process capability. That is, it is possible to determine whether the process performs well enough to produce output that meets ECTS requirements. If it does not, action by local supervision will not remedy the situation.
2.3. Sampling Grading Processes and Control Charts
- In order to find and eliminate assignable causes of process variation, we sample output from the grading process. Naturally, the variable of interest in this case will be numerical (grades). When we study a quantitative process variable, we say that we are employing measurement data. To analyze such data, we take a series of samples (usually called subgroups) over time, (Cabrera and McDougall (2002)). Typically, we analyze data by plotting summary statistics for the subgroups versus time. The resulting plots are often called ‘graphs of process performance’. A control chart employs a center line (CL) and two control limits; upper control limit (denoted UCL) and a lower control limit (denoted LCL). The center line represents the process’ average performance when it is in a state of statistical control. That is, when only common cause variation exists. The upper and lower control limits are horizontal lines situated above and below the center line. These control limits are established so that almost all plot points will be between the upper and lower limits when the process is in control. In practice, the control limits are used as follows:1. If all observed plot points are between the LCL and UCL, and if no unusual patterns of points exist, (this will be explained later) we have no evidence of assignable causes. We then assume that the process is in statistical control. In this case, only common causes of process variation exist, and no action to remove assignable causes is taken. If we were to take such action, we would be unnecessarily tampering with the process.2. If we observe one or more plot points falling outside the control limits, we have evidence that the process is out of control due to one or more assignable causes. Then we must take action on the process to remove these assignable causes. It is important to document a process while the subgroups of data are being collected. The time at which each subgroup is taken is recorded, and the person who collected the data is also noted. Any process changes must be documented. Any potential sources of variation that may significantly affect the process output should also be noted.
2.4. Charts for Fraction Nonconforming
- When an inspected unit does not meet the desired criteria, it is said to be nonconforming (or defective). Conversely, when an inspected unit meets the desired criteria, it is said to be conforming. In the context of the grading process we will address conformance and nonconformance according to the failure rates. The control chart that we set up for this type of data is called a p-chart. To construct this chart, we observe subgroups of n units over time. We inspect (test) the n units in each subgroup and determine the number d of these units that are nonconforming. We then calculate for each subgroup n
 | (1) |
 values has mean
  and
and 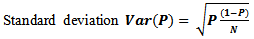 | (2) |
 by setting
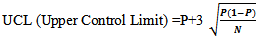 | (3) |
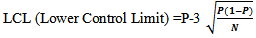 | (4) |
3. Data Analysis
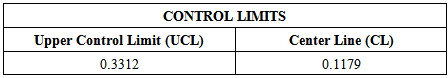
- The table below displays the summary of courses taken by the students, total number of students who took the courses and the number who failed the courses. The values in table 1 analyzed using MINITAB and the results are displayed in table 2 and figure 1 below.
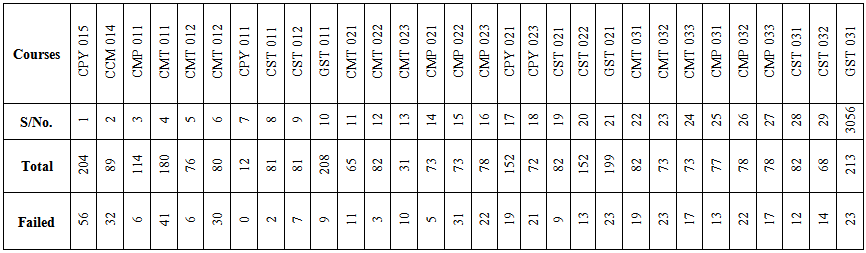 | Table 1. Distribution of courses and failure rate |
|
 6. Configure the proportion value on the Historical P text field7. Fill the variable and subgroup text field.8. Click Ok.The MINITAB window environment and the plotted chart are as displayed in figure 1 and 2 below.
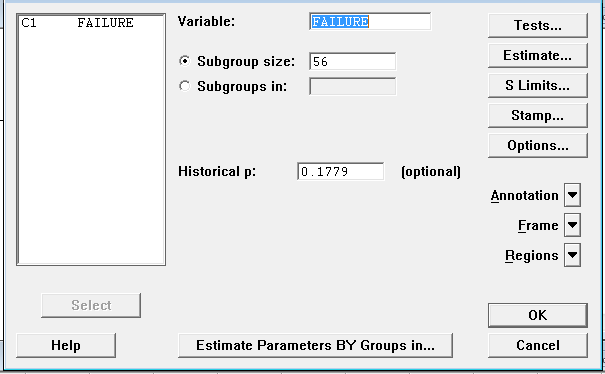 | Figure 1. P chart MINITAB dialog box |
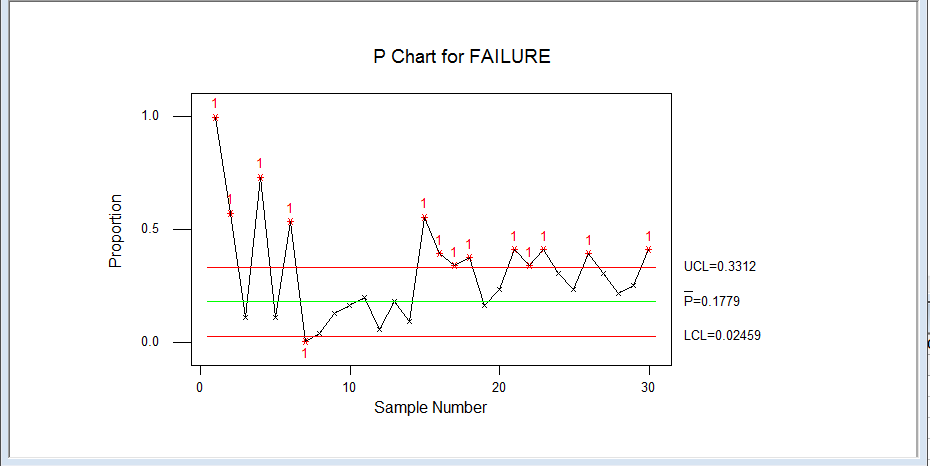 | Figure 2. P chart for proportion of failure |
4. Discussion of Result
- The number of students who sat for 30 selected courses and those who failed these courses in the college of natural sciences in the 2013/2014 academic session of an Advanced College were summarized in table 1. The proportion of failure, center line and upper control limit (UCL) were obtained using equation 1 and 3 and displayed in table 2. The P-control chart was plotted using MINITAB 13 and displayed in figure 2. The points that fall above the UCL indicate the courses corresponding to the numbers with high failure rate. This chart indicates that the teaching /learning process is out of statistical control. The high rate of could be traced back to the teaching method, assessment and evaluation process or, from the part of the students lack of seriousness (assignable cause of variation).
5. Conclusions
- Since P-chart detected shift in the process (teaching/learning), it can be used to monitor failure rate in schools (Colleges and Tertiary Institutions).Conclusively, the teaching/learning process is said to be out of statistical control since some of the plotted points fall outside the upper control limit (UCL), meaning that the failure rate of courses corresponding to these points above the UCL are not conforming to the failure level of conformance by the college.
6. Recommendations
- Based on our findings, the following recommendation can be made. Control charts can routinely be used to identify the courses students seem to be problematic to them. Rather than complaining about the high failure rate and on issues not under control, school administrators and teachers should concentrate on what they can control. All the common sense solutions for decreasing the failure rate should be put in place. As a school administrator, it would appear to be your job to make this recommendation/ suggestion and implementation to your teachers and follow-up to ensure your students have the highest probability of succeeding. On the part of the students, we suggest that students should improve their average test scores by having well-constructed notes that were directed by their teachers. More often, there is no solution cited by classroom teachers (Lecturers) – only blame assigned to their students for not studying. Always remember “ignore the excuse and attack the problem!”