A. C. Akpanta , I. E. Okorie
Department of Statistics, Abia State University, Uturu, Nigeria
Correspondence to: A. C. Akpanta , Department of Statistics, Abia State University, Uturu, Nigeria.
| Email: |  |
Copyright © 2015 Scientific & Academic Publishing. All Rights Reserved.
Abstract
Generally, the value at which one currency may be exchanged for another at any given time is refered to as Exchange rate. This article illustrates cointegration using the foriegn Exchange buying rates of Naira1/SDR2 and Naira/WAUA3 for a period of 119 days. The time-plot and the Augmented Dickey-Fuller test shows that both time series are integrated I(1), also, the Johansen test shows that the two time series are cointegrated with cointegration vector (1, - 1.010124)' and the cointegration relationship results to a stationary white noise process. Hence, the foriegn Exchange buying rates of Naira/SDR and Naira/WAUA has a long-run relationship.
Keywords:
Foriegn Exchange rates, Cointegration, Stationary process, White noise
Cite this paper: A. C. Akpanta , I. E. Okorie , Evaluating the Relationship between Foreign Exchange Buying Rates of Naira/SDR and Naira/WAUA: A Cointegration Approach, American Journal of Mathematics and Statistics, Vol. 5 No. 5, 2015, pp. 249-252. doi: 10.5923/j.ajms.20150505.04.
1. Introduction
A good number of both macroeconomic and financial time series exhibits substantial nonstationarity behaviour and by implication almost lack the tendency to return to a constant value. For example, Figure 1 dipicts a superimposition of two time series plots (foriegn Exchange buying rates of Naira/SDR and Naira/WAUA for a period of 119 days). It could be observed that non of these series is stationary because of its downward trend pattern. Hence, could be regarded as a nonstationary generated process and follow stochastic trends.In macroeconomics, empirical research is conducted with one of its objects beign hypothesis testing and estimation of relationships, having its basis on economic theory. However, in building and testing models the statistical theory that was widely applied has the assumption of stationarity for the variables of such model and coercing such variables from nonstationary process to stationary one before modelling would result to false results (estimates) and misleading statistical inference.The linear regression models, has by a long way provided a straight forward way of modelling nonstationary variables without any vivid knowledge of its implications on inferential results and conclusions, until Clive Granger and Paul Newbold made it clear in their classical paper [1] using a pair of independent simulated nonstationary  random walk process, where the results they obtained from regressing one nonstationary random walk process on the other shows from testing the significance of the regression coeficients a great deal of statistical significance, contradicting the theory. Again, they observed inconsistency in the residuals of the fitted model which exhibits a very strong positive autocorrelations is against the underlying assumption of normality for regression residuals. Factually, these were the motivation of Clive Granger [2] whose work provides a solution to this lingering problem of spurious regression of macroeconomic and financial variables. Interestingly, the result of his work led to the idea of cointegration and its applications.
2. Materials and Methods
The data for this work are the daily transactions of foriegn Exchange buying rates of Naira/SDR and Naira/WAUA for a period of 119 days (from 03-03-2014 to 22-08-2014) obtainable from the Central Bank of Nigeria (CBN) official website [3]. R programme for windows has extensively been used to perform analysis in the sequel section.The linear regression model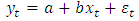 | (1) |
can be slightly rewritten as  | (2) |
where  Equations 1 and 2 imply that by fitting a regression model we absolutely assume that we can obtain a stationary process using some linear combination of
  and
and  , i.e. the two time series are cointegrated. Using the Johansen test [4] we could therefore test the null hypothesis that the time series are not cointegrated. If we do not reject it, we have strong reasons to be cynical about regression results. On the other hand, if we reject this hypothesis, then regression relationships between the time series may be useful.
3. Results and Discussions
Figure 1 shows the observed trajectories, Naira/SDR and Naira/WAUA, of two independent non stationary time series I(1). The trajectories seem to mimic a common trend, despite being independent. This may and does happen with integrated processes. | Figure 1. Time Plot of Naira/SDR and Naira/WAUA |
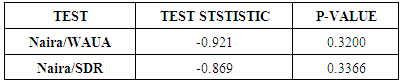
Hypothesis: H0: the time series is unit root non stationary and H1: the time series is stationary.Decision: large p-value greater than 0.05 is in favour of the null hypothesis. Thus there is no evidence against the null hypothesis at 5% level of significance suggesting that both time series are unit root non stationary.Table 1. The Augmented Dickey-Fuller Test
 |
| |
|
3.1. Spurious Regression and Correlation
Fitting a simple regression model to the data we get:  | (3) |
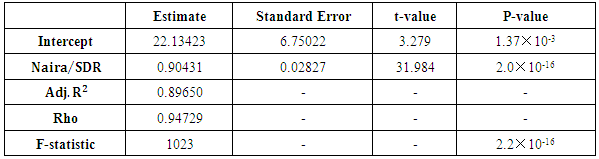
Table 2 is the standard summary of the fitted model:From Table 2 the slope is significant, adjusted  and rho (correlation coefficient) are large, the F-statistics suggest an overall fit of the fitted simple regression model. At face value, it seems that
  is a good explanatory variable for
  . This does not seem correct since the two series are independent. So, by implication the covariance
  for every t and k. Consequently, the population regression coefficient should also be zero. Also, the residual density plot in Figure 2(b) depicts a gross departure from normality against the theoritical assumption of zero mean and constant variance i.e.
  , again this is a frown on the adequacy of the fitted model.
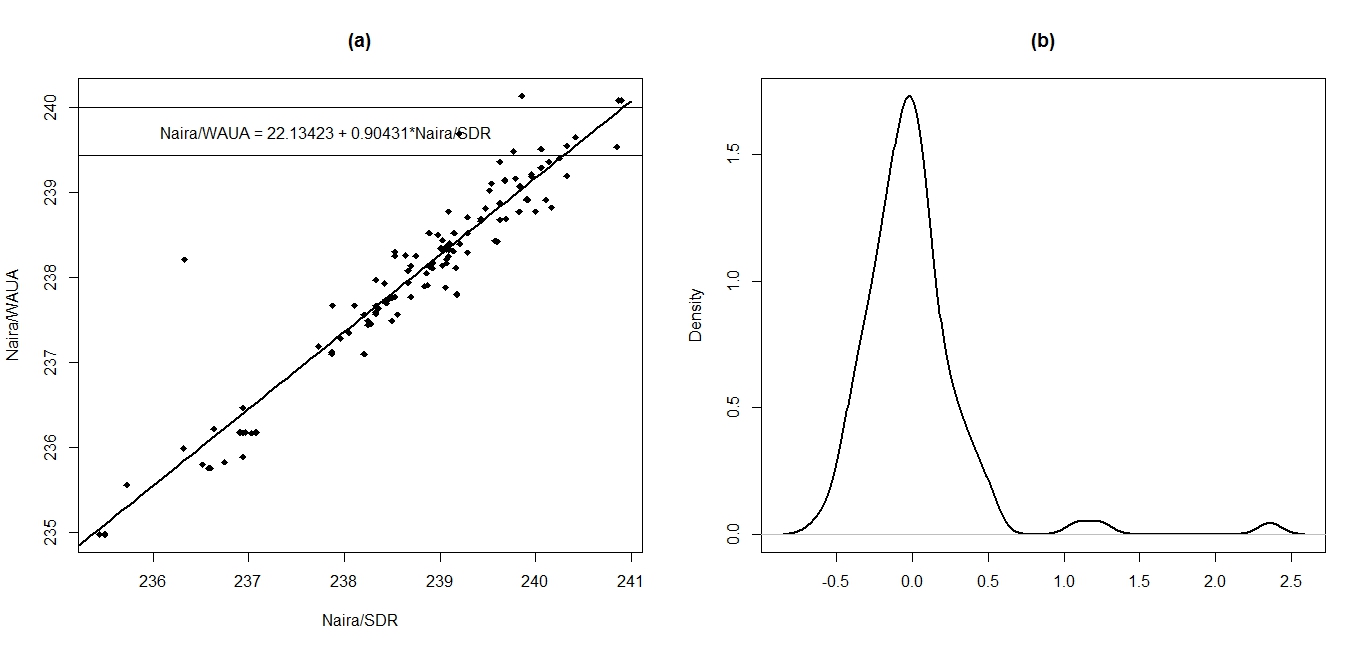 | Figure 2. Superimposition of the Fitted Regression Line on the Scatter-plot of  and and  2(a) and the Residual Density Plot 2(b) 2(a) and the Residual Density Plot 2(b) |
Table 2. Regression of
 on on

 |
| |
|
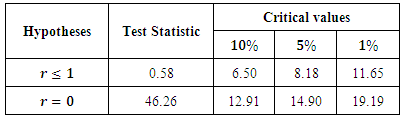
Table 3. Johansen Test
 |
| |
|
We reject H0 : r= 0 at any of the usual significance levels since the test statistics for r = 0 is larger than the corresponding critical values. So, we proceed to test  . The statistic is 0.58 and is smaller than the critical values (6.50, 8.18, 11.65 for
  = 0.1, 0.05 and 0.01, respectively). So we do not reject
  . But this means that we can claim that r= 1, since we already rejected r= 0.
Table 3.1. Eigenvectors, Normalised to First Column (Cointegration Relations)
 |
| |
|
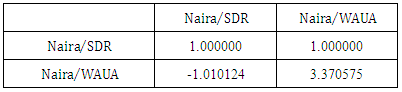
Having arrived at a dicision that the cointegration order is r = 1, we extract the cointegration vector 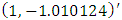 from the results in Table 3.1 (the first column in the eigenvectors table). The corresponding cointegrating relation is:
 | (4) |
The process  obtained from the cointegrating relation should be stationary. Figure 3 shows that
  is indeed stationary as required because, the time plot 3(a) shows no pattern, the ACF plot 3(b) and the PACF plot 3(c) shows no spike across the 95% confidence band hence, the process is uncorrelated at various lags. In fact
  is a stationary white noise process.
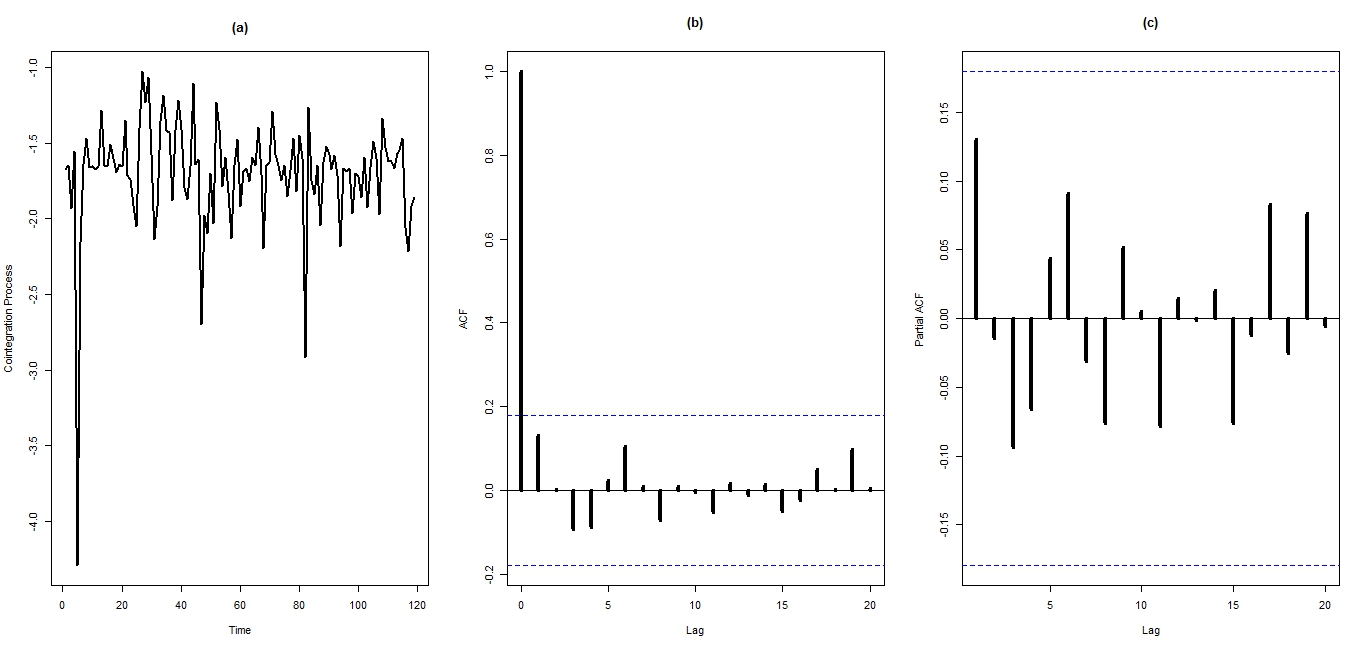 | Figure 3. Time Plot (a), ACF Plot (b), and PACF (c) of  |
4. Conclusions
The plot of two cointegrated time series is similar, an evidence of correlation. The time plot and the Augmented Dickey-Fuller test suggest that the data under study is integrated. Inference based on the statistics from simple regression model is invalid if the variables are integrated  , since the assumption under which they are derived are violated, for example the predictor variable does not have constant variance and is strongly correlated and its error term is not normally distributed. The resultant process (
 ) from the cointegration relationship is a stationary white noise process. As a result, the foriegn Exchange buying rates of Naira/SDR and Naira/WAUA are cointegrated (exhibits long-run relationship).
Notes
1. Naira - Nigerian currency.2. SDR (Special Drawing Rights) - An international type of monetary reserve currency, created by the International Monetary Fund (IMF) in 1969, which operates as a supplement to the existing reserves of member countries.3. WAUA (West African Unit of Account [currency]).
References
| [1] | Granger, C. W. J. and Newbold, P.: 1974, Spurious regression in econometrics, Journal of Econometrics 2, 111-120. |
| [2] | Granger, C.W.J.: 1981, Some properties of time series data and their use in econometric model specification, Journal of Econometrics 16, 121-130. |
| [3] | http//www.cbn.gov.ng |
| [4] | Johansen, S.: 1988, Statistical Analysis of Cointegration Vectors, Journal of Economic Dynamics and Control, 12, 231–254. |
 Abstract
 Reference
 Full-Text PDF
 Full-text HTML