-
Paper Information
- Previous Paper
- Paper Submission
-
Journal Information
- About This Journal
- Editorial Board
- Current Issue
- Archive
- Author Guidelines
- Contact Us
American Journal of Mathematics and Statistics
p-ISSN: 2162-948X e-ISSN: 2162-8475
2015; 5(5): 230-237
doi:10.5923/j.ajms.20150505.02
Some Standard Physical Characteristics of Students in Seoul: Modeling Approach
 Abstract
 Reference
 Full-Text PDF
 Full-text HTML
Md. Rafiqul Islam1, Md. Sabbir Hossain1, 2
1Department of Population Science and Human Resource Development, University of Rajshahi, Bangladesh
2Department of Business Administration, Bangladesh Islami University, Dhaka, Bangladesh
Correspondence to: Md. Rafiqul Islam, Department of Population Science and Human Resource Development, University of Rajshahi, Bangladesh.
| Email: |  |
Copyright © 2015 Scientific & Academic Publishing. All Rights Reserved.
Physically handicapped students (PHSs) are a part and parcel of a nation and indeed it is an important factor for socio-economic development. The purpose of this study is to fit some models to some standard physical characteristics (SPCs) of PHSs for male and femalewho are in primary and secondary schools in Seoul. For this, the data is taken from Seoul Education Statistical Annual. Quasi Newton Method is employed to fit these models using the Statistical software STATISTICA. Moreover, t-test, F-test and cross validity prediction power (CVPP) are used to check the accuracy as well as validation of the model. In this study, it is seen that these SPCs are showing upward pattern in accordance with age. Furthermore, it is found that SPCs of PHSs like height, weight, chest girth and sitting height of male and female students follow third degree polynomial model. These models are well fitted in accordance with t-test, F-test and CVPP. The stabilities of these models are more than 99%.
Keywords: Standard Physical Characteristics (SPCs), Physically Handicapped Students (PHSs), Polynomial Model, t-test, F-test, Cross Validity Prediction Power (CVPP)
Cite this paper: Md. Rafiqul Islam, Md. Sabbir Hossain, Some Standard Physical Characteristics of Students in Seoul: Modeling Approach, American Journal of Mathematics and Statistics, Vol. 5 No. 5, 2015, pp. 230-237. doi: 10.5923/j.ajms.20150505.02.
Article Outline
1. Introduction
- Seoul, the capital of Korea, has been a central city of the nation more than 600 years, since being selected as the capital by the Chosun Dynasty in 1394. Physically handicapped students (PHSs) are an important issue for nation's socio-economic development. PHSs stand for locomotor disabled students. Disability is any restriction or lack of an ability to perform an activity in the manner or within the range considered normal for a human being (WHO, 2002). Physical characteristics are personality or features about a person. In the present study, some standard physical characteristics (SPCs) of PHSs in Seoul represents four measurements like height, weight, chest girth and sitting height. And these measurements are assumed as latent indicators of early nutrition and lifetime health status. The sitting height is more important in the design and layout of transport, living and classroom of PHSs. Anthropometry is the study of measurement of the human body in terms of the dimensions of bone, muscle and adipose tissue. Factors which influence human growth and development are heredity, sex, socioeconomic factors, nutrition, hormones and different kinds of pollution etc. Oppositely, anthropometric measurement is one of the way to know the nutritional and health status of human body in any region or any country. The adolescent physical growth spurt, which tends to occur at an earlier age in a better nourished, healthier population (Eveleth and Tanner, 1976). Anthropometric data on the general population is essential in ergonomics to specify the physical dimensions of workspace, equipment, furniture and clothing to fit the user and to avoid a physical mismatch between the dimensions of products and equipment and corresponding user dimensions (Bridger, 1995). As anthropometric dimensions of humans widely vary across the age range, it is crucial to investigate the effect of age on anthropometric characteristics (Pennathur and Dowling, 2003; Hu et al., 2007; Ali and Arslan, 2009 and Dawal et al., 2012). A number of studies is done regarding anthropometric characteristics but modeling approach on these characteristics is more or less rare. For this, an attempt has been made to study these anthropometric measures mathematically. That is why, in this study, polynomial model is considered to study the level and pattern of SPCs such as height, weight, chest girth and sitting height of PHSs. It is mentioned that polynomial model was used in several studies (Islam, 2004, 2005a; 2005b; 2006a; 2006b; 2006c; 2007a and 2011; Islam et al., 2004). Therefore, the specific objectives of this study are addressed below:i) to study the level and pattern of height, weight, chest girth and sitting height of PHSs by sex of Seoul,ii) to fit some models to some SPCs of PHSs by sex of Seoul, andiii) to check the validity of these fitted models using cross validity prediction power (CVPP).
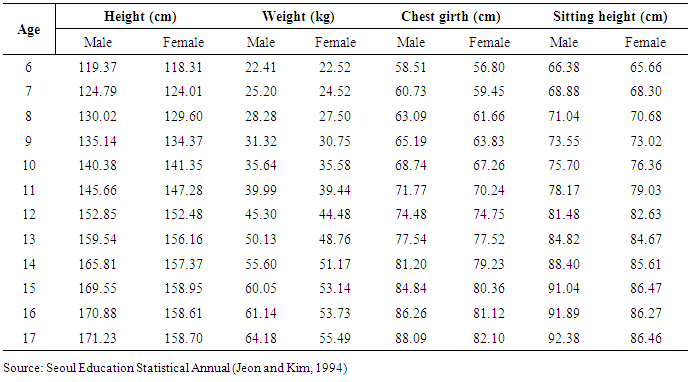
2. Data and Data Source
- A secondary data on SPCs of PHSs who are in primary and secondary schools of Seoul in 1991 have been taken from the Seoul Education Statistical Annual (Jeon and Kim, 1994) which is shown in Table 1 and that is used as raw materials in the present study for fulfilling the above objectives.
|
3. Methods and Methodological Issues
3.1. Model Fitting
- Using the scattered plots (Fig.1-Fig.8) of SPCs of PHSs by age and sex in Seoul, these seem that the data can be fitted by polynomial models with respect to different ages in year. Therefore, an nth degree polynomial model is considered in case of Seoul and the form of the model is
 where, x is the mean value of the age group; y is SPCs of PHSs;
  is the constant;
  is the coefficient of
  (i =1, 2, 3, ..., n) and u is the disturbance term of the model. Here, a suitable n is found for which the error sum of square is minimum.
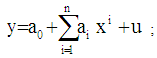
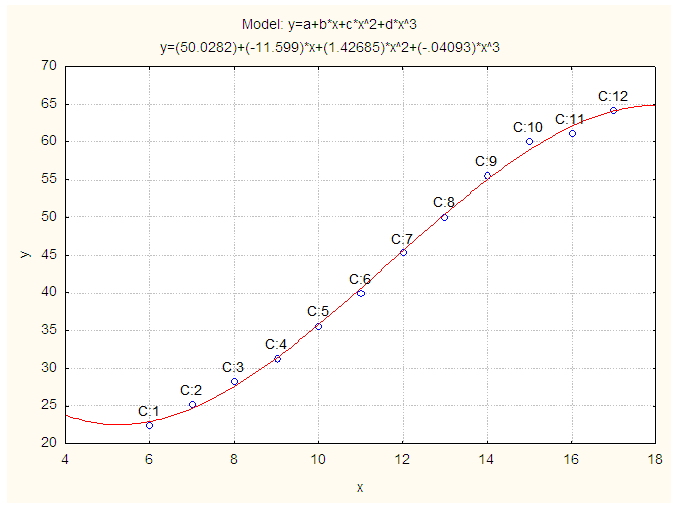
 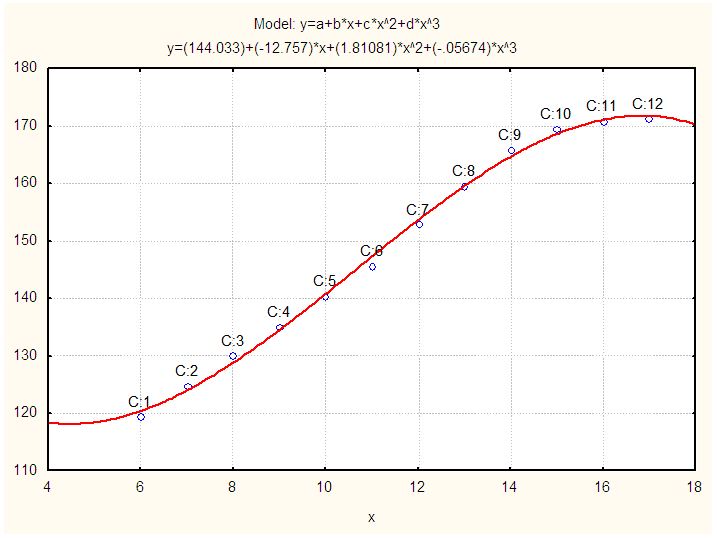 | Figure 1. Observed and Fitted Height (cm) of Physically Handicapped Male Students of Seoul. X: Age in Years and Y: Height (cm) |
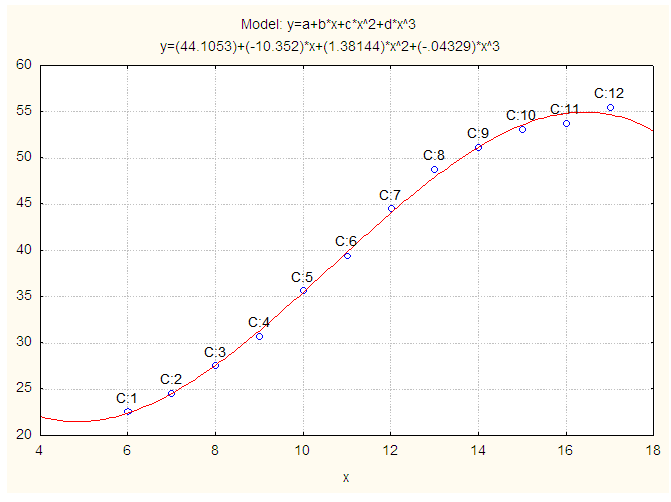
 | Figure 2. Observed and Fitted Height (cm) of Physically Handicapped Female Students of Seoul. X: Age in Years and Y: Height (cm) |
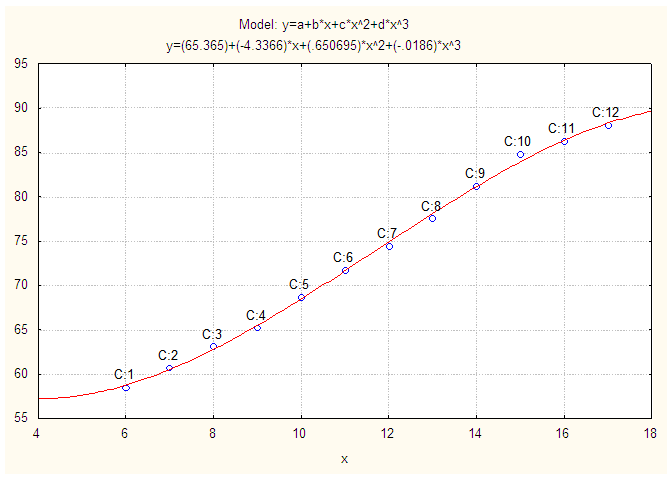
 | Figure 3. Observed and Fitted Weight (kg) of Physically Handicapped Male Students of Seoul. X: Age in Years and Y: Weight (kg) |
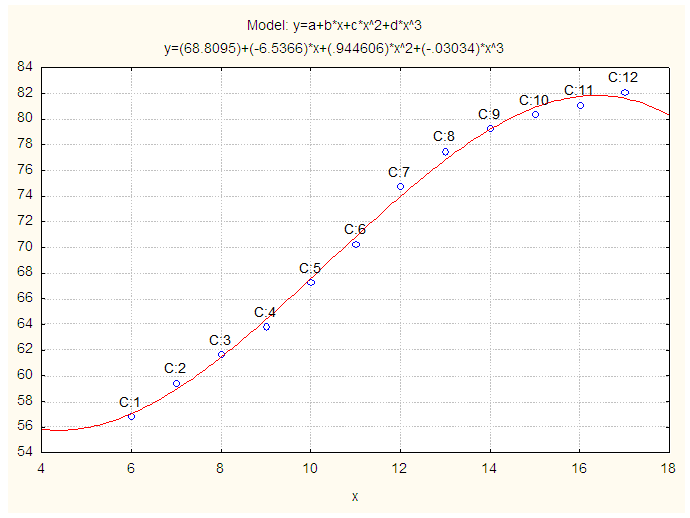
 | Figure 4. Observed and Fitted Weight (kg) of Physically Handicapped Female Students of Seoul. X: Age in Years and Y: Weight (kg) |
 | Figure 5. Observed and Fitted Chest girth (cm) of Physically Handicapped Male Students of Seoul. X: Age in Years and Y: Chest Girth (cm) |
 | Figure 6. Observed and Fitted Chest girth (cm) of Physically Handicapped Female Students of Seoul. X: Age in Years and Y: Chest Girth (cm) |
 | Figure 7. Observed and Fitted Sitting height (cm) of Physically Handicapped Male Students of Seoul. X: Age in Years and Y: Sitting Height (cm) |
 | Figure 8. Observed and Fitted Sitting Height (cm) of Physically Handicapped Female Students of Seoul. X: Age in Years and Y: Sitting Height (cm) |
3.2. Model Validation Technique
- To check how much these models are stable over population, the cross validity prediction power (CVPP),
 , is applied in the case of Seoul. Here
  where, n is the number of cases, k is the number of predictors in the model and the cross validated R is the correlation between observed and predicted values of the dependent variable. The shrinkage coefficient of the model is the positive value of
  ; where
  is CVPP and R2 is the coefficient of determination of the model. 1-shrinkage is the stability of R2 of the model. The information on model fittings and estimated CVPP has been demonstrated in Table 2. This technique is also used as model validation technique (Islam, 2007b; 2008; 2009; 2010; 2012a; 2012b; 2013; Islam & Hossain, 2013a; 2013b; 2014a; 2014b; Hossain & Islam, 2013; Islam et al., 2013; 2014; Islam & Hoque, 2015).
|
3.3. F-test
- To verify the measure of the overall significance of the model as well as the significance of R2, the F-test is employed here. The formula for F-test is given below:
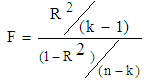 where k = the number of parameters is to be estimated, n = the number of cases and R2 is the coefficient of determination in the model (Gujarati, 1998). These estimates are shown in Table 3.
|
4. Results and Discussion
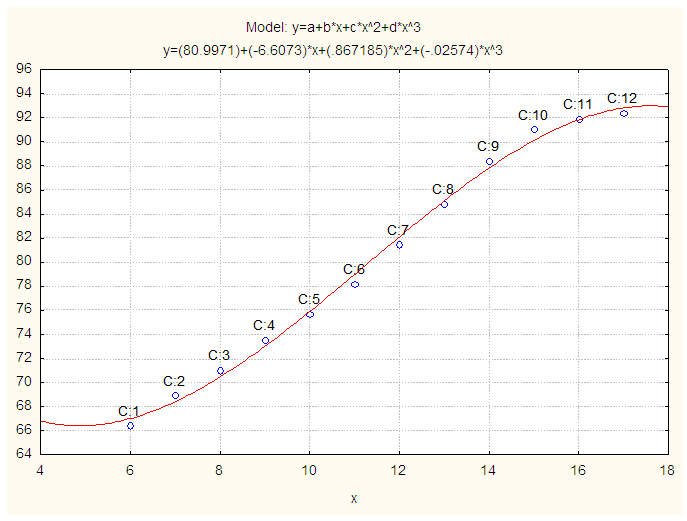
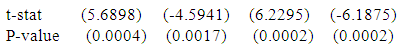
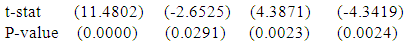
- The SPCs of PHSs by sex of Seoul is presented in Table 1. The status and physique of PHSs who are in primary and secondary schools in Seoul were studied and observed that the height, weight, chest girth and sitting height of male and female students are showing increasing pattern. Moreover, it was found that these physical characteristics of male students are comparatively high at every age than that of female excepting the height at ages 10 and 11, chest girth at age 12, sitting height at ages 10, 11 and 12. The polynomial model is constructed for height of physically handicapped male students of Seoul and the fitted equation is as follows:
 | (1) |
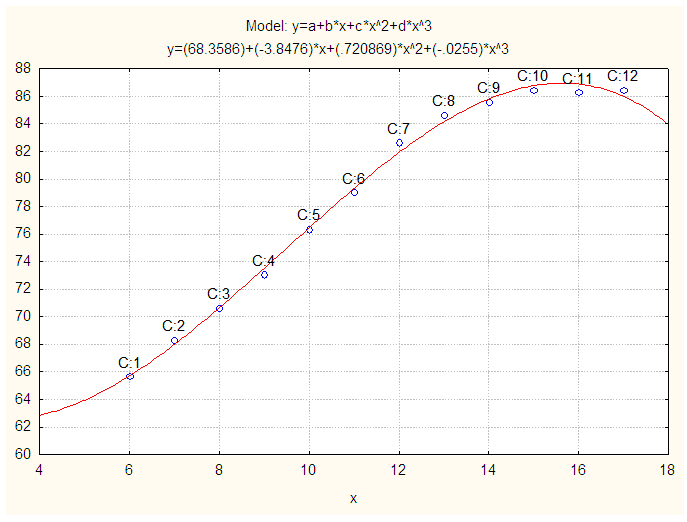
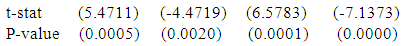
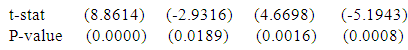
 Again, another polynomial model is constructed for height of physically handicapped female students of Seoul and the fitted equation is
  | (2) |
 In which the term containing x is excluded from the model because of the insignificant of the parameter.Another polynomial model is fitted for weight of physically handicapped male students of Seoul and the fitted equation is given below:
 | (3) |
 Moreover, another polynomial model is constructed for weight of physically handicapped female students of Seoul and the fitted equation is as follows:
 | (4) |
 Again, a polynomial model is fitted for chest girth of physically handicapped male students of Seoul and the fitted equation is addressed below
 | (5) |
 Furthermore, another polynomial model is constructed for chest girth of physically handicapped female students of Seoul and the fitted equation is given by
 | (6) |
 And, a polynomial model is fitted for sitting height of physically handicapped male students of Seoul and the fitted equation is
 | (7) |
 Then, polynomial model is fitted for sitting height of physically handicapped female students of Seoul and the fitted equation is
 | (8) |
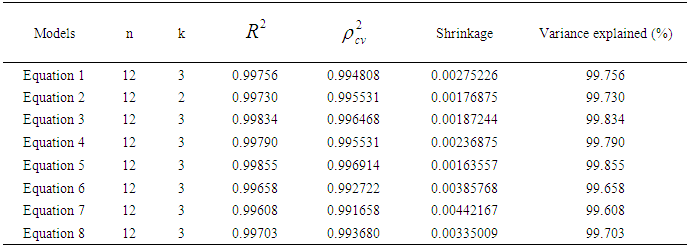
 The estimated CVPP,
  corresponding to their
  are shown in Table 2. The observed and fitted values are depicted in Figure 1 to Figure 8. In this table, all fitted models from equation (1) to equation (8) are highly cross validated and their shrinkage’s are very small. Moreover, it is observed that all the parameters of the fitted models are statistically significant with large proportion of variation explained and their proportion of variation are more than 99%. And the stabilities of these models are more than 99%. The stabilities of
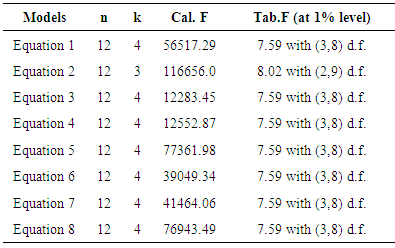
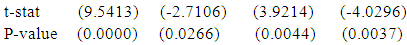
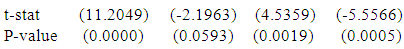
  of these models are also more than 99%.The calculated values of F-statistic of the models (1) to (8) are 56517.29 with (3, 8) degrees of freedom (d.f.), 116656.0 with (2, 9) degrees of freedom (d.f.), 12283.45 with (3, 8) degrees of freedom (d.f.), 12552.87 with (3, 8) degrees of freedom (d.f.), 77361.98 with (3, 8) degrees of freedom (d.f.), 39049.34 with (3, 8) degrees of freedom (d.f.), 41464.06 with (3, 8) degrees of freedom (d.f.), 76943.49 with (3, 8) degrees of freedom (d.f.) respectively where as the corresponding tabulated values are only 7.59, 8.02, 7.59, 7.59, 7.59, 7.59, 7.59 and 7.59 at 1% level of significance, respectively. Therefore, from these statistics it is also concluded that all these constructed models are highly statistically significant. Hence, the fits of all these models are well.
5. Conclusions
- In this study, it is found that height, weight, chest girth and sitting height of PHSs for male and female are increasing due to increment of age. Also it is investigated that SPCs of PHSs for male and female follow cubic polynomial models with explaining large proportion of variance. The stabilities of these models are more than 99%. Moreover, the stabilities of R2 of these models are more than 99%. It is found that the overall significance of these models is very high due to F-statistics. It is recommended that Government and Non-Government Organizations should take proper steps for bringing them to normal life and linked them to the development process of the nation.