-
Paper Information
- Paper Submission
-
Journal Information
- About This Journal
- Editorial Board
- Current Issue
- Archive
- Author Guidelines
- Contact Us
American Journal of Mathematics and Statistics
p-ISSN: 2162-948X e-ISSN: 2162-8475
2015; 5(3): 150-162
doi:10.5923/j.ajms.20150503.07
A Conditional Restricted Equilibrium Correction Model on Nigerian Stock Exchange All-Share Index and Macroeconomic Indicators with 2008 Global Financial Crisis Effects: A Univariate Framework Approach
 Abstract
 Reference
 Full-Text PDF
 Full-text HTML
Lawal Ganiyu Omoniyi 1, Aweda Nurudeen Olawale 1, Oyeyemi Gafar Matanmi 2
1Department of Statistics, Yaba College of Technology, Nigeria
2Department of Statistics, University of Ilorin, Nigeria
Correspondence to: Lawal Ganiyu Omoniyi , Department of Statistics, Yaba College of Technology, Nigeria.
| Email: |  |
Copyright © 2015 Scientific & Academic Publishing. All Rights Reserved.
This paper employed the modified autoregressive distributed lag (ADRL) procedure to establish a univariate single level relationship existing between the Nigerian Stock Exchange (NSE) All-Share Index and three macroeconomic indicators such as Treasury bill rate, nominal exchange rate and inflation rate in Nigeria. A conditional restricted equilibrium correction model (ECM) was postulated with significant long-run relationship between NSE All-Share Index, exchange rate and inflation rate. The model relates exchange rate and inflation rate negatively with the All-Share Index in the long-run. Treasury bill rate have no long-run relationship with All-Share Index. The short-run dynamics indicated a negative causal relationship between All-Share Index and the three macroeconomic indicators. The results of this paper showed that All-Share index is slow to react to any disequilibrium caused by shocks on these macroeconomic indicators in the long-run. The 2008 global financial crisis had an insignificant negative effect on the NSE All-Share Index due to improved financial deepening. Monetary policy stability is crucial to price level control because inflation is a monetary phenomenon in Nigeria. Therefore, this paper propose that the efficient use of Treasury bills as apparatus of monetary policy (inflation-targeting) and major source of government financing is essential to the growth of the Nigerian stock market. In addition to efficient monetary policy through interest rate and most importantly exchange rate, a secure fiscal discipline through effective government spending will likely have a positive effect on the All-Share Index rapidly and directly.
Keywords: ARDL, All-Share Index, Treasury bills, Nominal exchange rate, 2008 global financial crisis, Financial deepening, Inflation-targeting, Monetary policy
Cite this paper: Lawal Ganiyu Omoniyi , Aweda Nurudeen Olawale , Oyeyemi Gafar Matanmi , A Conditional Restricted Equilibrium Correction Model on Nigerian Stock Exchange All-Share Index and Macroeconomic Indicators with 2008 Global Financial Crisis Effects: A Univariate Framework Approach, American Journal of Mathematics and Statistics, Vol. 5 No. 3, 2015, pp. 150-162. doi: 10.5923/j.ajms.20150503.07.
1. Introduction
- The relationships between stock markets (the channel by which trading in securities makes funds available for investment purposes in any economy) and macroeconomic indicators have received significant attention in both developed and emerging economies globally. Macroeconomic indicators are responsible for the prices of stocks and securities are traded on the stock exchange [1]. The nature of these relationships has been extensively studied over the years. Hence, the crucial question is “do macroeconomic variables explain stock market in the long-, short-run or both?” This question has been attempted by different studies using different statistical techniques. The conclusions arrived at depended on the nature of the methods employed. Contradicting conclusions, some supported by and others in total deviation from established theory emerged over the years. The rich and diverse literature on various topics relating stock prices to macroeconomic variables include one of the earliest researches carried out by [2] through proxy hypothesis to establish significant strong positive relationships between stock prices, industrial production index, gross national product, money supply, inflation rate and interest rate. Similarly, using the arbitrage pricing theory, [3] studied the significance of some macroeconomic variables to the US stock market movement. [4] through vector error correction model (VECM) examined the relationships between stock returns and macroeconomic variables and found significant long- and short-run causal effects in selected developed economies such as Australia, Germany, Japan and United States. The exchange rate and short-term interest rate have insignificant relationships with the stock market of BSE Sensex in India [5]. While the Sensex is positively related with money supply and industrial production index but negatively related with inflation rate which is supported in the literature. By studying the granger causality between macroeconomic factors on Indian stock market volatility, [6] found none of the macroeconomic variables studied were significant in predicting the future volatility in stock prices individually. These variables include exchange rate, crude oil prices, interest rates, gold price etc. [1], by employing the restrictive cointegration technique, established both short- and long-run relationships between economic indicators such as short term interest rates, consumer price index, nominal exchange rate, unemployment rate with FTSE100 in the United Kingdom and S&P500 in the United States of America. Their findings suggested that increase in inflation rate does not necessarily result in the decline of stock prices, an argument supported by Rapach [7]. [7] by studying the relationships between real value of stocks in the heavily industrialized countries found a strong positive relationship between inflation rate and the stock market indexes. A lot of researches involving the main index of the Nigerian stock exchange, NSE All-Share Index have emerged over the years. [8] employed principal component analysis (PCA) to study the correlations between the stock market and long-term economic development. He concluded that stock market development index have a negative but significant long-run effect on the economic growth. Several studies examining the relationships between Nigerian stock market and macroeconomic variables has sprung up since the work of [8]. Notable were the works of [9] and [10]. [11] conducted an empirical study on the relationship between All-Share index, consumer price index, broad money supply (M2), Treasury bill rate, exchange rate and real output growth using augmented error correction model (ECM) proposed by [12]. They found significant long-run and short-run causal relationship between All-Share index and M2, inflation rate and real output. Similarly, [13] using yearly data that dated 1954 to 2006, established a positive long-run contemporaneous relationship between leading macroeconomic indicators and All-Share Index. Higher interest rate encourages savings but discourages investments in the stock market due to lower rate of return. [14] developed an error correction model on All-Share Index and selected key macroeconomic variables such as industrial production index, fixed exchange rate and minimum rediscount rate MRR and found inverse relationship with industrial production index due to higher energy prices and consequently higher cost of production. The error correction model postulated indicated a surprising high speed of adjustment to equilibrium at about 82.91 per cent of any disequilibrium resulting from shocks on these macroeconomic variables was corrected within one year. However, only MRR had a significant negative long-run relationship with All-Share Index at all levels, which showed the existence of multicollinearity amongst the variable an implication of over-parameterization. [15] employed vector error correction model to study the short-run dynamic relationships between All-Share Index and industrial production index, consumer price index, narrow and broad money supply, oil prices and Treasury bills. This current work intends to study the existing relationship between All-Share index and three major macroeconomic indicators such as Treasury bills rate, nominal exchange rate, and inflation rate using the modified autoregressive distributed lag model ARDL or bounds testing proposed by [16]. Though this robust method has been attracting a lot of researchers’ attention in the last decade, its application to the Nigerian stock market is still unconvincing. Few researches/studies have employed this method in the establishing cointegration amongst the stock market index and these macroeconomic variables in Nigeria. For example [17] using an ARDL (1,1) model found significant long-run and short-run causal relationships between NSE All-Share Index and consumer price index (as proxy for inflation rate). [18] attempted a study of the effect of stock market performance has on the gross domestic product (GDP). An ARDL (2,1,0,1,1,1) model involving stock market performance indicators such as value of traded securities, financial deepening, market capitalization, average dividend yield and interest rates. These variables are either I(0), I(1) or mutually cointegrated. They concluded that there exists a long-run relationship between stock market performance and gross domestic product (GDP) but with relatively slow speed of adjustment to disequilibrium caused by shocks on the stock market. Their paper, though not directly involving All-Share Index, is important in this current research as it showed that Nigerian stock market cannot be used as a determinant of the overall health of the economy due to the low level of reaction of the GDP to changes in market capitalization and average dividend yield.
2. Methods
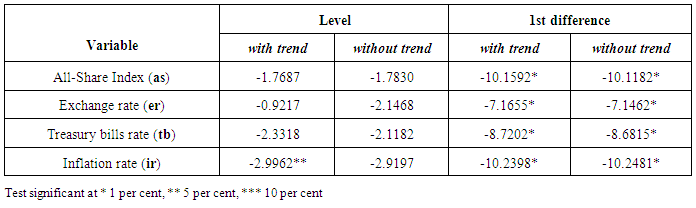
- The analyses of the time series data in this paper involve the test of non-stationarity through the usual [19] test. Though this pre-test is not necessary especially when a non-residual based cointegration method like the autoregressive distributed-lag procedure is involved in the analysis, its inclusion is to ascertain the underlying data generating process of the time series. The modified autoregressive distributed lag procedure of bounds testing proposed by [16] was employed to establish the existence of a univariate long-run relationship between the economic indicators and the All-Share Index. An ARDL (p,p1,p2,p3) with no deterministic trend and one-off dummy variable was postulated. Model stability techniques such as the autoregressive characteristic root polynomial and recursive tests were conducted on the postulated model. Furthermore, Lagrange multiplier of residual serial correlations alongside information criteria (such as Akaike information and Schwarz Criteria) were also carried out in the selection of the maximum lag length p and the final equilibrium correction model for forecasting purposes. This current paper included Treasury bill rate (tb) as a proxy for interest rates, Naira/US Dollar was used as a proxy for nominal exchange rate(er) and inflation rate (ir) as the regressors with lags p1, p2, and p3 respectively. All-Share Index (as) was regressed on its past values and these three variables in order to fit an autoregressive distributed lag model. Also, we introduced a dummy variable to capture the structural breaks caused by financial crisis, which led to the crash of the market especially in 2008. Generally, the presence of structural breaks in series may result in the over-acceptance of presence of one or more unit roots especially in the non-stationarity test [20]. The data employed are eleven-year monthly observations of All-Share index (as), Treasury bill rate (tb), nominal exchange rate (er), and Inflation rate (ir) between 2004 and 2014. The data on All-Share index was obtained from the database of the Nigerian Stock Exchange. The source of three macroeconomic indicators data was the Central Bank of Nigeria database. We assumed that all variables can be approximated by the natural log-linear VAR(p) model for reasons such as easy and improved interpretability and sustained normality assumption particularly in the disturbances.Test of non-stationarityTo check the data generating process underlying these time series, this paper carried out test of unit roots or non-stationarity using the regular Phillips-Perron (PP) test. The PP test was preferred for two reasons;○ It is flexible in dealing with the problem of serial autocorrelation and heteroskedasticity in the error terms ut in equation 1.1, hence the normality assumption that ut ~ N(0,σ2) was relaxed making this method robust to general form of heteroskedasticity [21].○ We do not need to specify lag length for the test regression in equation 1.1.The test regression is given as
 | (1.1) |
 .
. | (1.2) |
 | (1.3) |
 | (1.4) |
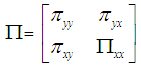
 is the standard error of ρ. That is under the null hypothesis that ρ=0, the PP and PPt statistics have the same asymptotic distributions as the ADF t-statistics and normalized bias statistic [19].The conditional equilibrium correction modelThe empirical analysis of the long-run and short-run relationships between All-Share Index and these three macroeconomic indicators was expressed by fitting a conditional equilibrium correction model (ECM) with intercept and no deterministic trend and a dummy variable. In accordance with the work of [16], we defined the vector wt = (ast, tbt, ert, irt)΄ = (ast, xt΄)΄, where xt is a (3x1) vector of Treasury bill rate, exchange rate and inflation rate at levels. A one off dummy variable which did not alter the asymptotic property of the Wald and F-statistic in bounds testing was introduced such that
 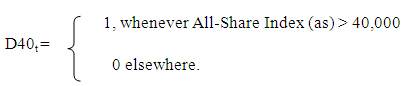 The choice of 40,000 was such that it reflects the 2008 global financial crisis. We expressed the model as
 | (1.5) |
 | (1.6) |
 of long-run coefficients, δ′i is a (p-1) x 1 vector of short-run coefficients of the regressors, εxt was derived from εyt = ωyxΩ-1xxεxt + ζt given that εyt is conditionally dependent on εxt. ∆xt which is uncorrelated with the disturbances, ζt, in the model of equation 1.5 is a 3x1 vector of the first difference of Treasury bill rate, exchange rate and inflation rate at levels. The model in equation 1.5 stems from a simple VAR(p) process in equation 1.7 and is referred to as a conditional equilibrium correction model (ECM) which will be emphasized later in this paper.
 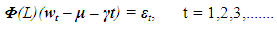 | (1.7) |
 | (1.8) |
 Under a univariate framework where the All-Share Index, yt, given the three economic indicators in the vector xt, εt = (εyt , ε′xt), the former and latter assumptions imply that equation 1.5 is generated from
  | (1.9) |
 | (2.0) |
 | (2.1) |
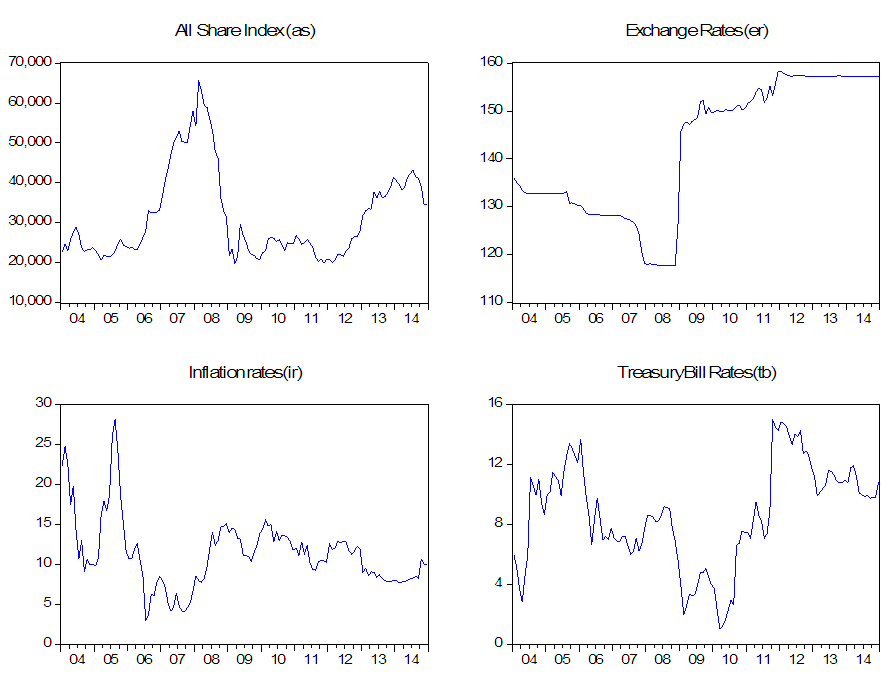 | Figure 1. Time Plots on NSE All-Share Index, Nominal Exchange rate, Inflation rate and Treasury Bill rate (2004-2014) |
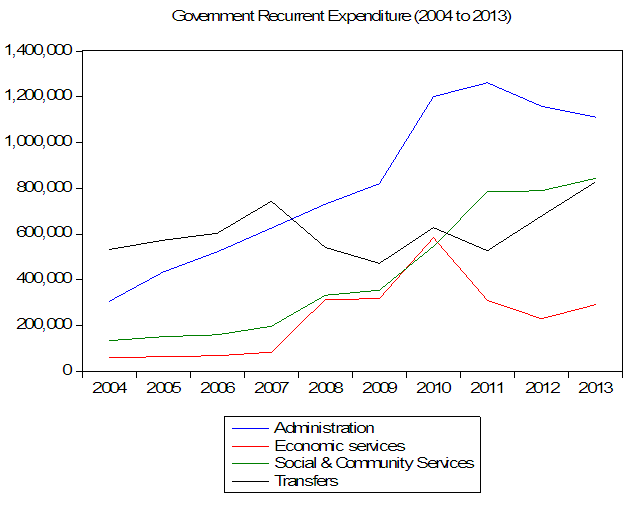 | Figure 2. Government Expenditure (N’millions) |
|
|
|
|
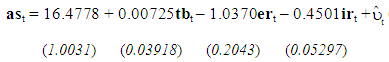 | (2.2) |
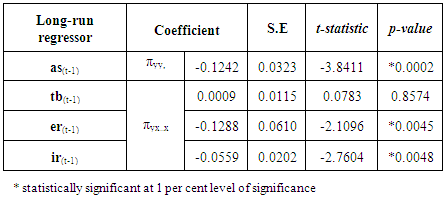
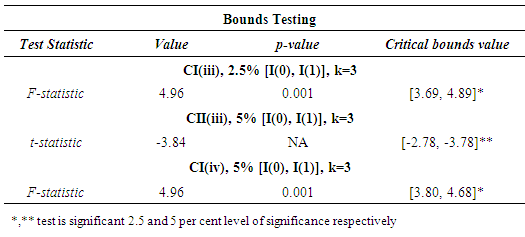
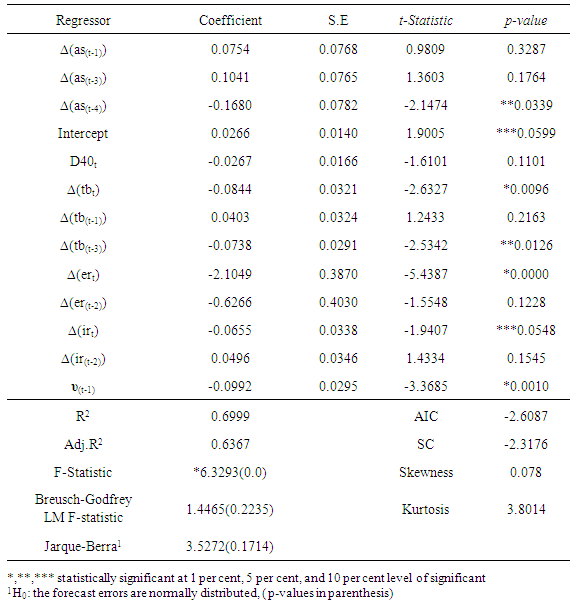
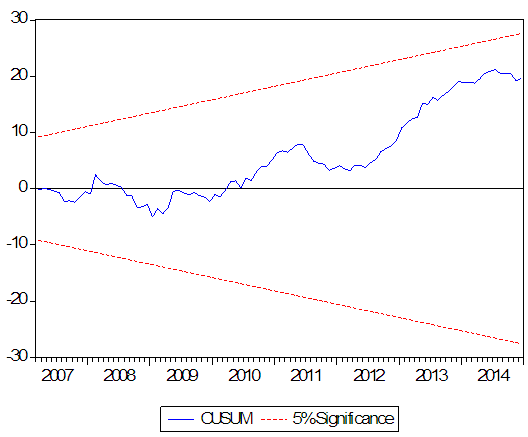
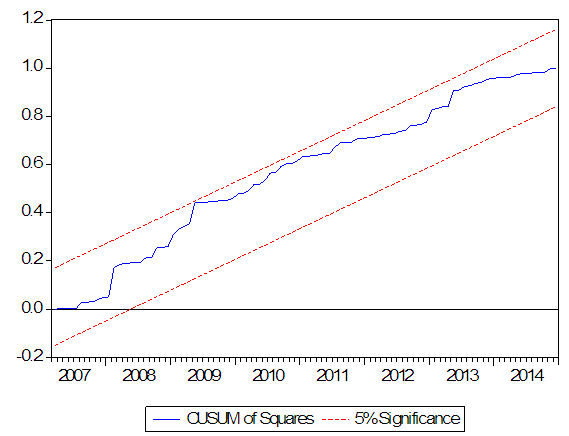
 is the error correction term with standard error expressed in brackets4. The long-run level relationship of the inflation rate is negative as supported in the literature. Only Treasury bills (tb) rate remained highly insignificant in the conditional long-run level model. The conditional restricted equilibrium correction model that follows was estimated by adopting the ARDL modeling approach proposed by [24] as shown in Table 5. As long as α0 ≠0 and the deterministic trend γ =0 in equations 1.6 & 1.8 then the deterministic behavior of the level process wt is invariant to the cointegrating rank of the long-run ∏ matrix [16], therefore the F-statistic and Wald statistic results are similar for the bounds test procedure as shown in Table 4. In the long-run, Treasury bill rate (tb) has coefficient statistically equal to zero implying that the positive causal long-run relationship with All-Share index is highly likely far-fetched. The reasons for this insignificant positive causal relationship between All-Share Index and the Treasury bill rate in the conditional long-run model of equation 2.2 are in two folds. Firstly, increased short-term interest rate by the CBN is an indication of tightening or contractionary monetary policy to slow down economic growth5 and subdue inflationary pressure. Very rare cases of situations where higher short-term interest rate such as risk-free Treasury bills rate leading to increase in stock prices exist in the literature. Short-term Treasury yield decline with increase in demand for the government backed security. Therefore, lower yields in the bills market result in the decline in the demand for stocks. Lower required rate of return (RRR) on stocks, rising inflation and tight liquidity lower stock prices in the long-run. Secondly, increase in Treasury bills rate also gives rise to increase in other interest rate, which imply higher cost of borrowings for both individuals and companies. For a company, the expected future discounted cash flow will decline if the company’s debt expense increases, thereby eroding investors’ confidence in the company resulting in lower stock prices. The postulated model relates exchange rate (er) and inflation rate (ir) negatively with All-Share Index, which was expected according to the literature. Depreciation of the local currency coincided with periods of high liquidity6 in the banking sector (associated with lower interbank interest rate) during the period under review. We reiterate here, [20] emphasized in their paper that exchange rate is a weak shock absorber during periods of high inflationary pressures in Nigeria. During these periods, depreciation of the Naira in addition to excess liquidity in the banking system, prompted the monetary authority, CBN to adopt the contractionary (tightening) monetary policy by increasing short-term interest rate, which represented the cost of borrowing by individuals and corporations. Whilst the short-term increase in interest rate such as the Treasury bills produced an insignificant marginal increase in share prices, the higher cost of operations/production and declining expected future cash flow of corporations lead to reduced share price as mentioned earlier during the period under review. Furthermore, investors generally react to the increase in interest rate by balancing their portfolio in money market instruments such as the Treasury bills, which are risk-free and possess higher return. The short-run dynamic revealed that only the first difference of All-Share Index at lag 4, Treasury bill rate at levels and lag 3, levels of exchange rate and inflation rate were significant (Table 5). The results of short-run dynamics further necessitated the existence of level relationships between All Share Index and the macroeconomic indicators. Although, the dummy variable D40 representing the impact of the 2008 global financial crisis on the Nigerian All-Share Index was negative as expected, it was statistically insignificant at all levels of significance. This implies that the Nigerian stock market remained resilient to the external shock from the collapse of the financial institutions in United States and United Kingdom and economic crisis across Euro Area partly due to improved financial deepening particularly during the crisis period7. “Financial deepening enhances resilience and capacity to cope with external shocks, improve macroeconomic policy effectiveness and support solid and durable inclusive growth” [26].
|
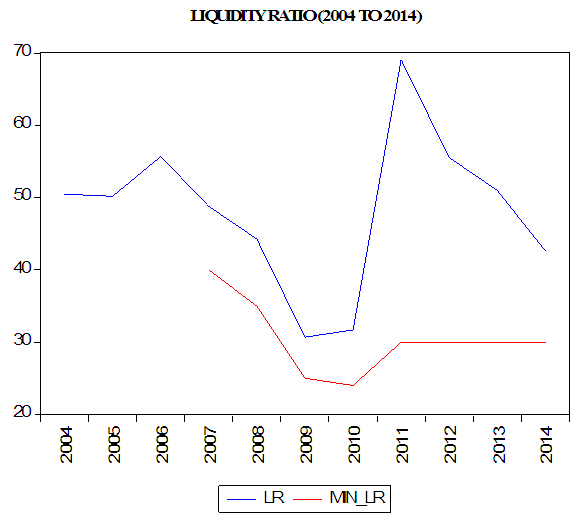 | Figure 3. Banking Industry Liquidity Ratio (2004-2014) |
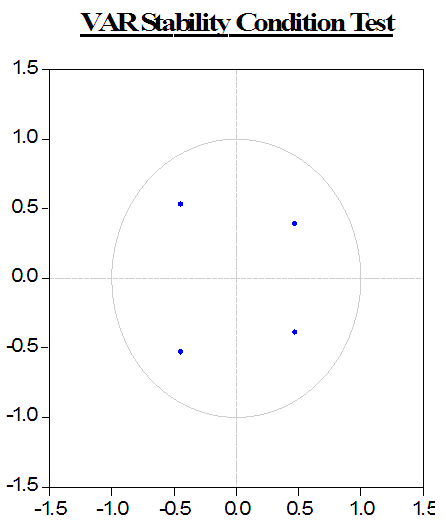 | Figure 4. VAR Stability Condition Plot |
 | Figure 5a. Cumulative Sum plot |
 | Figure 5b. Cumulative Sum of Squares plot |
|
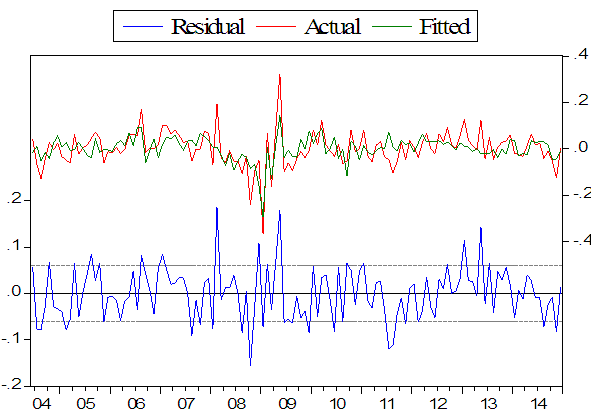 | Figure 6a. AS model residual diagnosis Plot |
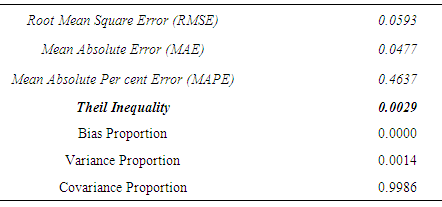
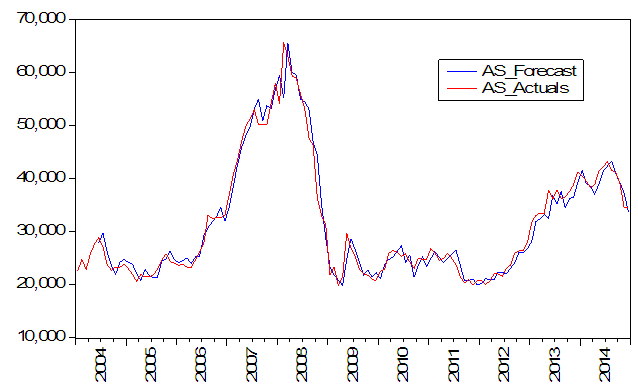 | Figure 6b. AS Forecast and Actual value plot (2004-2014) |
3. Conclusions
- In this paper, we have attempted to answer the research question “do macroeconomic variables explain stock market in the long-, short-run or both?” Using the bounds testing approach to cointegration, we conclude that a long-run co-movement exists between the Nigerian All-Share Index and three major economic indicators such as the risk-free Treasury bills, nominal exchange rate and inflation rate. This was achieved by estimating a conditional restricted equilibrium correction model in form of an ARDL(4,3,2,2) through ordinary least squares (OLS). Whilst the relationship between Treasury bills and All-Share Index is not significantly different from zero, nominal exchange rate and inflation rate are negatively related with All-Share Index in the long-run. The speed of adjustment to disequilibrium to shocks from these three economic indicators is relatively slow. The short-run dynamics indicated negative causal relationships between All-Share Index and these economic indicators, with the All-Share Index declining the most under the influence of nominal exchange rate during the period under review. The proportion of foreign currency debt has been on the rise leading to significant increase in the foreign exchange rate risk. The performance of the model revealed that all stability conditions were satisfied and the forecast errors, which signify when the most is happening in the economy, accounted for the various external forces influencing the Nigerian stock markets between 2008 and 2009. These forces include crude oil price crash10, declining foreign reserve, eroding investor’s confidence, change in government, rising public and private debts. The recent downturn in crude oil prices since June 2014, present an opportunity for energy subsidy, tax reforms and the much talked about diversification of the Nigeria economy from an oil based one to other viable non-oil sectors such as services, industry, building and construction, wholesale and retail trade and agriculture. Although the 2008 global financial crisis had an insignificant negative impact on the stock market, this paper revealed a weak fiscal policy discipline on the part of the Nigerian government whose recurrent expenditure rose significantly during periods of crisis resulting in higher inflation with consequential repercussion on the Nigerian Stock Market. Monetary policy stability is crucial to price level control because inflation is a monetary phenomenon in Nigeria. Therefore, the efficient use of Treasury bills as apparatus of monetary policy (inflation-targeting) and major source of government financing is essential to the growth of the Nigerian stock market. In addition to efficient monetary policy through interest rate and exchange rate, a secure fiscal discipline through effective government spending will likely have a positive effect on the All-Share Index rapidly and directly.
Notes
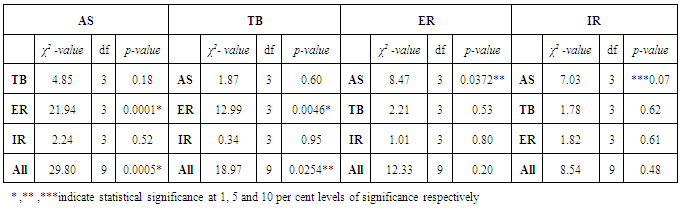
- 1. Yt= γ0 + γ1Yt-1 +.....+ γpYt-p + φ1Xt-1 +.....+ φpXtp + ωt Xt =υ0 + υ1Xt-1 +.....+ υpXt-p + φ1Yt-1 +.....+ ψpYt-p + vt Then, testing H0: φ1 = φ2 = ..... = φp = 0, against HA: 'Not H0', is a test that X does not Granger-cause Y. Similarly, testing H0: φ1 = φ2 = ..... = φp = 0, against HA: 'Not H0', is a test that Y does not Granger-cause X. In each case, a rejection of the null hypothesis implies there is Granger causality [1].2. H0 = H πyy 0 ∩ H πyx.x 0 vs H1 = H πyy 1 U H πyx.x where, H πyy 0 : πyy = 0 vs H πyy 1 : πyy ≠ 0 and H πyx.x 0 : πyx.x = 0 vs H πyx.x 1 : πyx.x ≠ 0. 3. CII(iii) is the Case III for unrestricted intercept and no trend critical values which computed through probabilistic simulations for testing the null hypothesis ф = 0 using t-statistic in ∆yt = фyt-1 + δ΄xt-1 + α΄wt + ɧt t=1,2,3,....,T [16].4. The standard errors of the coefficients are much smaller than the coefficients signifying the significance of the variables at level except for Treasury bills rate with the long-run coefficient lower than its standard error.5. The Nigeria Gross Domestic Product (GDP) grew by nearly 500 per cent between 2004 and 2013 due to rebasing of the economy. The new base year for the calculation of gross domestic product was set at 2010 to accommodate other major significant sectors of the economy. The GDP annualized growth rate was 5.83 per cent between 2005 and 2014. The country’s GDP growth rate in 2014 was 6.22 per cent, which was much higher than the World Bank forecasted value for African countries growth rate of 5.2 per cent.6. Excess liquidity (or money supply) may arise when the amount of broad money (M2) is higher than the level required to keep inflation under control in the economy. Excess liquidity implied that the liquidity ratio is in excess of the monetary authority level which varies over time depending on the Monetary Policy Committee (MPC) stance. A 47.02 per cent annualized average was recorded for the liquidity ratio during the period under review. Public sector Cash Reserve Requirement (CRR) is usually set higher than the Private Sector Cash Reserve Requirement. Banks deploy this excess liquidity mainly into Standing Deposit facility (SDF) and in a manner that put pressure on the exchange rate rather than encourage credits especially to the private sector. Interbank interest rate was kept low through the excessive repo operations of the CBN.7. In spite of the external shocks on the financial sector, the financial deepening in terms of the credit to private sector (CPS) relative to the GDP averaged more than 26 per cent between 2007 and 2009. Similarly, M2/GDP recorded annualized average of 31.44 per cent during the same period. 8. CUSM employ test statistic Vt = ∑tp=k+1 vp/σv to ascertain parameter instability arising from cumulative sum falling outside areas between [k, ± -0.948(T-k)1/2] and [T, ± 3*0.948(T-k)1/2] of 5 per cent critical areas. CUSUM of Squares is based on the test statistic Sp = (∑tp=k+1v2p)/ (∑Tp=k+1v2p) with an expected value E(Sp) = (t-k)/ (T-k) which takes value zero if t = k and 1 if t = T under parameter constancy [6]9. According to the model postulated by [20], a supply driven decline of 45 per cent in crude oil price will be associated with about 7.8 per cent and 4.5 per cent depreciation in the value of the Naira to the US dollars in the long- and short-run respectively. 10. Unlike the 2008 crude oil price crash which was as a result of speculative trading in oil futures, the recent crash since June 2014 has been associated with increase in unconventional oil, global supply outstripping global demand, policy shift by OPEC, crisis in the Middle East and major crude oil producers and depreciation in the value of Naira. The impact of unconventional oil through alternative sources such as oil sands, tight oil, oil shale, thermal depolymerisation, coal and gas conversion remained the major causes of this recent price crash in crude oil. This is a policy concern for the Nigerian government.