-
Paper Information
- Next Paper
- Previous Paper
- Paper Submission
-
Journal Information
- About This Journal
- Editorial Board
- Current Issue
- Archive
- Author Guidelines
- Contact Us
American Journal of Mathematics and Statistics
p-ISSN: 2162-948X e-ISSN: 2162-8475
2015; 5(3): 123-127
doi:10.5923/j.ajms.20150503.03
Multivariable Discriminant Analysis; Application of a Three Dimensional Case on Students Measurements
 Abstract
 Reference
 Full-Text PDF
 Full-text HTML
Usoro Anthony E.
Department of Mathematics and Statistics, Akwa Ibom State University, Mkpat Enin, Akwa Ibom State, Nigeria
Correspondence to: Usoro Anthony E., Department of Mathematics and Statistics, Akwa Ibom State University, Mkpat Enin, Akwa Ibom State, Nigeria.
| Email: |  |
Copyright © 2015 Scientific & Academic Publishing. All Rights Reserved.
A three dimensional discriminant analysis was the research interest. Memberships in three different groups were studied. Three linear discriminant models were estimated from the pair-wise analysis. Misclassifications were identified in each group and associated probabilities of misclassification obtained.
Keywords: Discriminant Analysis, Classification, Probability of Misclassification
Cite this paper: Usoro Anthony E., Multivariable Discriminant Analysis; Application of a Three Dimensional Case on Students Measurements, American Journal of Mathematics and Statistics, Vol. 5 No. 3, 2015, pp. 123-127. doi: 10.5923/j.ajms.20150503.03.
Article Outline
1. Introduction
- A discriminant analysis is a multivariate statistical method whose objective is to have a critical study about population and seek to differentiate between two or more groups within the population with respect to certain characteristics [2]. In most cases, observations or individuals under careful examination may have some properties that restrict their fundamental membership to two predefined groups or populations of which a group will have similar properties amongst its members, but distinct from another group or population. In spite of the common similarities, there may be some differentials based on certain features or characteristics, which could make some members of a particular group or population different from other members within the group [4]. The aim of discriminant analysis is to establish a parametric based procedure, known as a linear discriminant function with which individuals’ membership can be assessed [10]. Classification or discriminant analysis has long been a subject of extensive studies in chemometrics. So far, a number of chemometrics methods have been established for discriminant function modeling. Among those are: (Bayesian) Quadratic discriminant analysis (QDA), (Bayesian) Linear discriminant analysis (LDA), Fisher linear discriminant analysis (FLDA), Discrimnant partial least squares (DPLS), Soft independent modeling of class analogies (SIMCA) and Artificial neural networks (ANN) have been widely used for practical purposes [3]. Discriminant analysis has very wide areas of application in sciences, business, education and economic studies. [8] Carried out a research to distinguish relevant indices from the vast range of indices that determine the economic situation or that influence the evaluation process and enable forecasting of its further state. The indices included gross domestic product, individual house hold consumption, public expenditures, gross fixed capital formation, export of goods and services, import of goods and services, and average monthly gross salary in real terms. Their research work covered the period, 1991-2002, and divided into two disjoint classes, namely (i) years of the upturn of polish economy and (ii) years of economic downturn. Discriminant analysis was used to distinguish and rank those indicators that are responsible in the most significant way for the differences between the objects and simultaneously for division into classes. Their work identified barometers for present economic and future economic situations. [9] applied discriminant analysis to re-classify students on the basis of their academic performances. The two groups of students used in the analysis were Business and Accountancy students in an institution. He used five courses offered to the two groups of students. Out 114 students in Accountancy, 37 were discriminated to Business Department, while retaining 77 students in Accountancy. Out of 202 students in Business Department, 78 were discriminated to Accountancy, while 124 were retained based on their performances. [5] applied discriminant analysis on the classification of implemented foreign assisted projects in Nigeria. Their study was to build a model that could be used to classify implemented foreign projects into one of the two categories – sustainable and unsustainable groups. The discrimination was between two groups, and the analysis was carried out using Mahalanobis Distance and Stepwise methods. [7] adopted principal component method to discriminate between two groups (sexes) based on the measurements of their sewing trousers. The parameters used were the measurements taken from both males and females. [1] considered different classification methods that can take care of unequal cost ratio of misclassification. That is appropriate method to be adopted when the equal cost of misclassification is violated. From their work, Maximum Linear Discriminant Function (MLDF), Fisher’s Linear Discriminant Function (FLDF) and Based Discriminant Function (BDF) were considered. Their investigation revealed that Maximum Linear Discriminant Function (MLDF) was observed as robust linear classifier. This study is motivated by the need to apply discriminant analysis to a three dimensional case, involving measurements of student’s shirts. The three dimensions imply three groups classification.
2. Method of Analysis
2.1. Data Collection Procedure and Variable Description
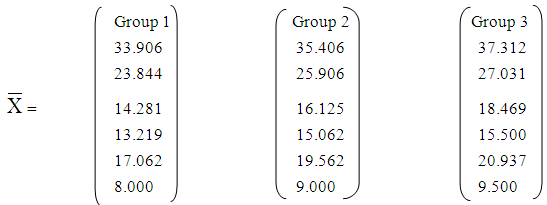
- Secondary School Students were classified into three groups. Group I comprises JSS1 and JSS2 students, Group II comprises JSS3 and SSS1 and Group III comprises SSS2 and SSS3. Measurements were taken from a sample of 32 students in each group. The measuring parameters for the sewing shirts included: chest (X1), length(X2), back(X3), neck(X4), sleeve(X5) and wrist(X6).
2.2. Vector Means and Covariance Matrix
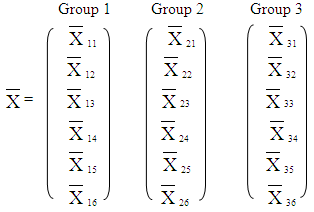
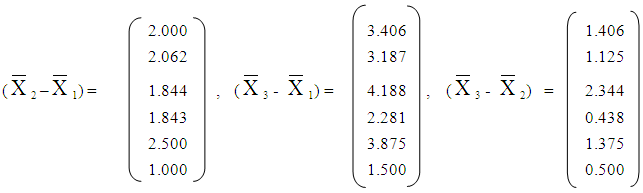
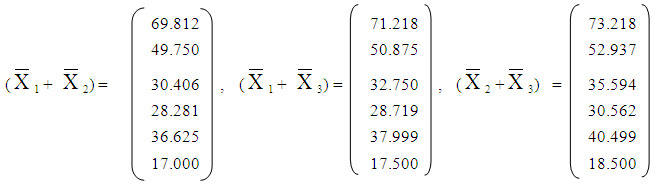
- A. The vector means for the three groups are:
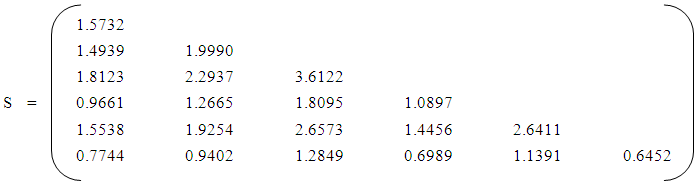
 B. The covariance matrix:
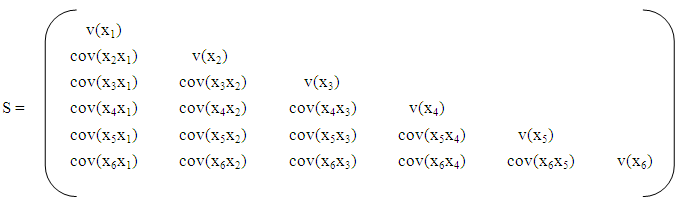 The above covariance matrix is obtained from each of the groups. The measurements are obtained from the three groups, and the variances and covariance are assumed not equal. Therefore, the pooled covariance matrix becomes,
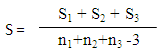 From the above matrix, inverse S-I is obtained. Inverse of a matrix is the transpose of the cofactor divided by the determinant.C. Linear Discriminant Function:There are many classification methods earlier mentioned in this paper. [6] applied Fisher’s linear discriminant function for reclassification of samples from three varieties of sorghum, using length of flag leaf, width of flag leaf, length of stalk and girth of culm as parameters. Here, we apply the Fisher’s linear discriminant function with six measuring parameters on three groups of students. The function is given by
 The discriminant rule is given by
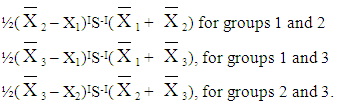
3. Data Analysis
3.1. Mean Vector and Covariance Analysis

3.2. Linear Discriminant Function
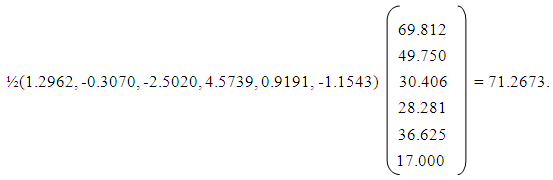
- A. for groups 1 and 2, the estimated model isF12 = 1.2962X1 – 0.3070X2 – 2.5020X3 + 4.5739X4 + 0.9191X5 – 1.1543X6The discriminant figure is obtained as
 B. for groups 1 and 3, the estimated model is F13 = 2.3017X1 – 0.5679X2 + 0.059X3 + 0.6453X4 + 1.2519X5 – 2.6386X6The discriminant figure is obtained as
 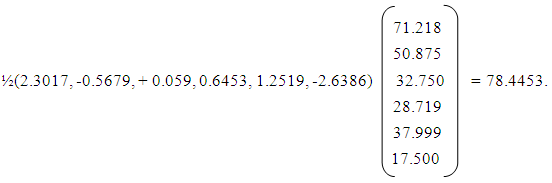 C. for groups 2 and 3, the estimated model isF23 = 1.8115X1 – 0.2609X2 + 2.5612X3 - 3.9286X4 + 0.3327X5 – 1.4842X6The discriminant figure is obtained as
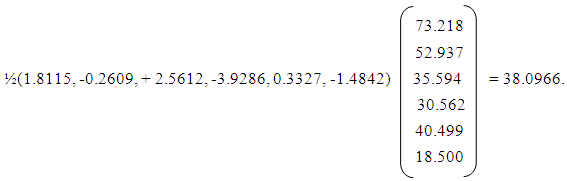
3.3. Discriminant Rule
- From the function Fmn = (Xi – Xj)IS-IX, the measurements are substituted to obtain discriminant figure for each pair of groups. The discrimination rules are:From Group 1:Retain Yth individual in group1 if Yth score from model F12 ≤ 71.2673Assign Yth individual to group2 if Yth score from model F12 > 71.2673Assign Yth individual to group3 if Yth score from model F13 > 78.4453From Group 2:Assign Yth individual to group1 if Yth score from model F12 ≤ 71.2673Retain Yth individual in group2 if Yth score from model F12 > 71.2673Assign Yth individual to group3 if Yth score from model F23 > 38.0966From Group 3:Assign Yth individual to group1 if Yth score from model F13 ≤ 78.4453Assign Yth individual to group2 if Yth score from model F23 ≤ 38.0966Retain Yth individual in group3 if Yth score from model F23 > 38.0966
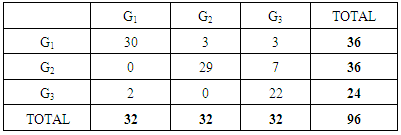
3.4. Confusion Matrix
- This table contains both correct and misclassified values from which the probabilities of misclassification are calculated.
|
4. Conclusions
- The application of discriminant analysis in this paper was motivated by the need to study membership of individuals in three heterogeneous groups and discriminate their membership based on their measurements. It is an indisputable fact that every unit of a population possesses some characteristics similar to or different from other members of the group in which its membership is established. The need for discrimination arises if there are some individuals in a group whose characteristics are significantly different from general characteristics of members forming the greater proportion of membership in the group. In the three dimensional case carried out in this work, some individuals, based on their measurements have exceeded the next superior group to where they should belong. The process of the analysis was pair-wise, and this ended in estimating three models for discrimination.