-
Paper Information
- Paper Submission
-
Journal Information
- About This Journal
- Editorial Board
- Current Issue
- Archive
- Author Guidelines
- Contact Us
American Journal of Mathematics and Statistics
p-ISSN: 2162-948X e-ISSN: 2162-8475
2015; 5(2): 88-94
doi:10.5923/j.ajms.20150502.06
Mathematical Analogue Traffic System Model
 Abstract
 Reference
 Full-Text PDF
 Full-text HTML
R. B. Ogunrinde
Department of Mathematical Sciences, Ekiti State University, Ado-Ekiti, Nigeria
Correspondence to: R. B. Ogunrinde, Department of Mathematical Sciences, Ekiti State University, Ado-Ekiti, Nigeria.
| Email: |  |
Copyright © 2015 Scientific & Academic Publishing. All Rights Reserved.
This paper presents the construction of a traffic system model which we call the mathematical analogue traffic system MATS. This is built from analogue wall clock with the combination of bulbs, electric wire for connection and battery to generate power to the system. The paper is basically on Traffic light, how it operates and the mathematical model behind it. The analogue traffic systems shall be applied to traffic problems of different kinds to find their solutions.
Keywords: Traffic light, Mathematical model, Model, Analogue traffic Systems (MATS)
Cite this paper: R. B. Ogunrinde, Mathematical Analogue Traffic System Model, American Journal of Mathematics and Statistics, Vol. 5 No. 2, 2015, pp. 88-94. doi: 10.5923/j.ajms.20150502.06.
Article Outline
1. Introduction
- Mathematical modeling can be defined as the process of creating a mathematical representation of some phenomenon in order to gain a better understanding of that phenomenon. It is a process that attempts to match observation with symbolic statements. Mathematical modeling can also be defined as the use of mathematics to describe the real-world phenomena, investigate important questions about the observed world, explain real world phenomenon, test ideas and make predictions about the real-world. The real-world refers to engineering, physics, physiology, ecology, wild-life, management, chemistry, economics, etc. There are relevant and exhaustive materials on this work such as [2, 3, 4, 6, 8, 10, 11, 12] just to mention but a few.Traffic is the movement of motorized vehicles, unmotorized vehicles and pedestrians on roads. Traffic Flow is the pattern of the way people move through an area or road network, or a measure of the density of traffic [9]. Traffic Jam means the number of vehicles blocking one another until they can scarcely move, that is a situation when all road traffic is stationary or very slow. Traffic Congestion is a condition on any network as user increases and is characterized by slower speeds, longer trip times, and increased queuing. Also, pedestrian is a person traveling in foot, whether walking or running, in fact in some communities those travelling using roller skate boards and similar devices are considered to be pedestrians. In modern times, the term mostly refers to someone walking on road or footpath.
2. Mathematical Analogue Traffic System Model
2.1. Traffic Light
- Traffic light at times can also be seen as a cluster in some cases but the only difference between cluster and traffic light is that cluster as a method which is Slow, Join (the cluster) and Go method while traffic light is Slow, Stop and Go.Traffic light on a road is set to operate with Red, Green and Yellow phase (light) of difference phase length. In some cases the length varies, i.e Red phase is less than Green phase or vise-visa depending on the location, nature of traffic, the yellow phase or amber phase may be or not be ignored. When yellow phase is ignored in a traffic light system it is not totally ignored but incorporated with both the red phase and the green phase. This happens only when a traffic light system is computerized, where the time taking for yellow phase will be added to Red and Green phases, this is often so because yellow phase length is short and so may not be considered. In some cases, yellow phase length can be two seconds. In this research we are put into consideration the yellow phase and also incorporate it with other phases. [5, 9, 11, 12].It is noteworthy that the common traffic systems we have in this country operate on three phases which are Red, Green and Yellow. RED Phase means STOP, GREEN Phase means GO, and YELLOW Phase means STAND FOR or SLOW-DOWN.Traffic system can be modeled to solve traffic problems of different kinds. Here we shall derive a model and compare the model with an existing model, putting into consideration the movement of pedestrians. With the formula below it is possible to find the average delay per vehicle.
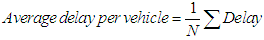 Given N = 40 and Σ delay = 1650, the average delay per vehicle
 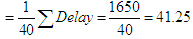 Where
Where  is the total number of vehicles that arrive during phase cycle and the
  is the sum of all vehicles delayed.Problem 1The flow of pedestrians at a road crossing is controlled by a set of traffic lights that operate on a fixed cycle basis. The red light is shown to pedestrians for rp seconds the green light for, gp seconds. We can assume that pedestrians arrive at the rate of one person every b seconds, and that all pedestrians arriving during the red phase cross the road at the start of green phase, and those pedestrians arriving during the green phase cross the road immediately.Solution.From this information we can find the formula for their average delay per pedestrian.The formula can be obtained by using a similar formular:
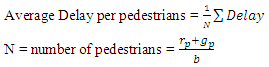 The
The  can be expressed as the sum of an arithmetic progression:
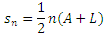 Note in this case d will be zero because there is no time between the crossings of pedestrians.So, A = first term, b and L = last term =
  , where
  therefore
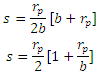 Average delay per pedestrian =
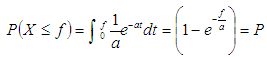
 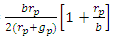 Problem 2Pedestrians cross a one-way street at a point P where there are no traffic lights or other traffic controls. It takes a pedestrian f seconds to cross the road, and vehicles pass at random such that there is an average seconds between the times when successive vehicles pass point P. i.e. the number of vehicles that pass point P in one second is a Poisson random variable with mean
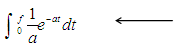
  . Solution:It is possible to demonstrate that a deterministic model in which vehicles are assumed to pass point P at exact intervals of a second is inappropriate for determining the average delay to pedestrians.Therefore the deterministic model is inappropriate for determining the delay to pedestrians because the cars arrive at regular intervals. In reality if a< f then the pedestrians would never cross the road, which is not a realistic model.Pedestrians can cross if and only if the times between successive vehicles passing point P is greater than the time it takes to cross the road.
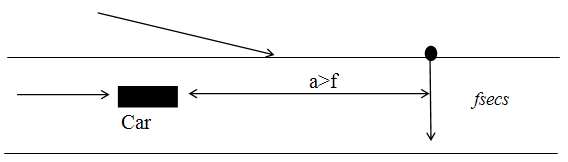 We can use a stochastic model to determine the average delay to pedestrians in term of f and a.
 The car interval is random variable. N = waiting time
 mean of exponential distribution over f.
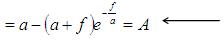 mean waiting time of 1 vehicle.AP is the average time one has to wait for 1 car.AP2 is the average time one has to wait for 2 cars.AP3 is the average time one has to wait for 3 cars.Such that;APn is the average time one has to wait for n cars.This gives
 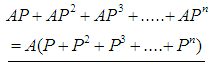 (This can be written as sum of geometric series.) That is
  Therefore the average waiting time for one person is
  This equation can be re-written in terms of f and a.
2.2. Model of Traffic System Construction (MATS)
- For understanding and clarity of the derived model above, we construct a traffic system which we call Mathematical Analogue Traffic System, MATS is built from analogue wall clock with the combination of bulbs, electric wire for connection and battery to generate power to the system, MATS operate in three phase, these phases are model on the clock with four segment, the phases are Red, Green and Yellow or Amber Phase. Diagram below illustrate the model “MATS”.
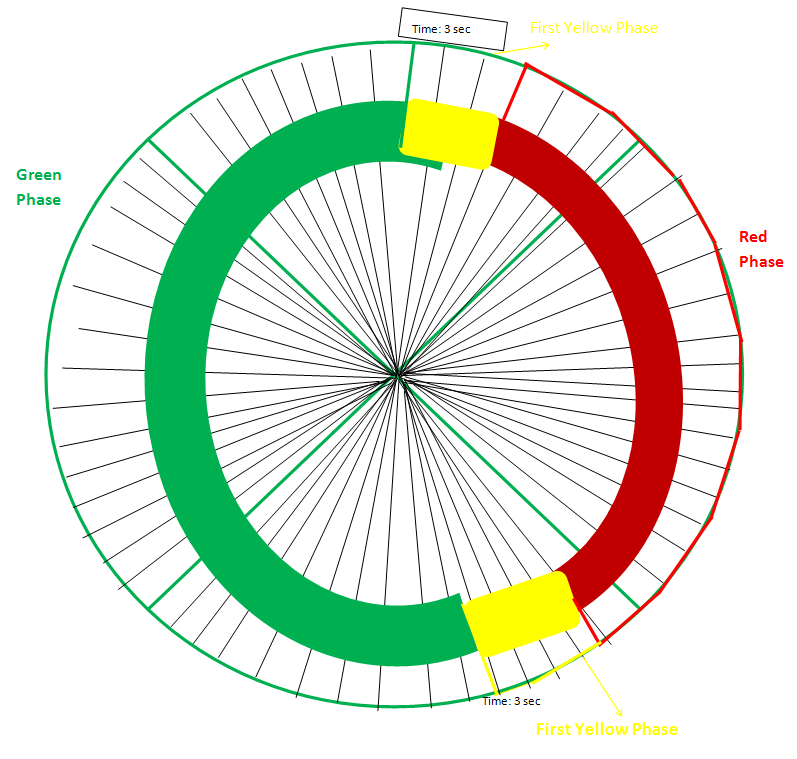 | Figure 1. |
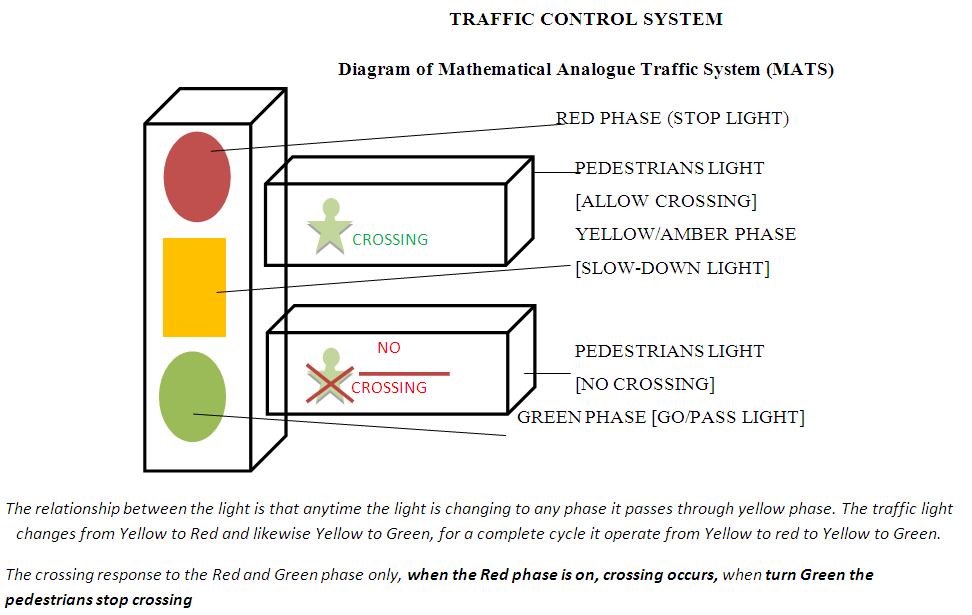 | Figure 2. |
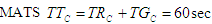
 For a complete cycle phase, i.e. moving from 0(sec) to 60 (sec), where Gn = T0 for another iteration. If the yellow phases were incorporated then we are left with two phases, the Red and the Green phases.
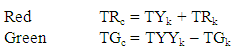 And the complete time taken for the whole phase will be TTc = TRc + TGcMATS LengthMATS as a complete time for 60 sec. with Red Phase Length = TRk = 20 SecGreen phase length = TGk = 34 Sec.And the yellow phase length = TYk = TYYk = 3 3 sec.Therefore the complete time for MATS can be written as
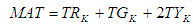 or
or 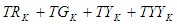 If yellow phase is incorporated then we have

 .In the first section we have our Red phase length to be rv, and Green phase length to gv, using the above data to work with the MATS replacing rv and gv with TRc and TGc respectively.Recalling the formula
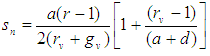 Taking the value of a and d to be 4 and 1, we have
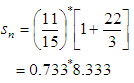 The total time delay = 6.108Calculating for N we have
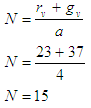 Therefore we put the values into the formula
  , we obtain average delay per vehicle (AV)
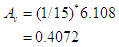 Second iterationTaking the value of and d to be 3 and 1, we obtain value Sn (total time delay) and Av (average delay per vehicle) as
 and
and Third iterationa = 2 and d = 1, we obtainSn = 16.859 and Av = 1.1239
3. Discussion of Results
- The table below gives a clear explanation of the results obtained. Dividing table A by a number of cycles i.e. table A was divided into three using MATS method, on table A we have 160sec as the total traffic length, with Red and Green Phase of 100 and 60 length respectively, but in our own case we take the total traffic length to be 60sec with red and Green phase of 23 and 37 using incorporated method.
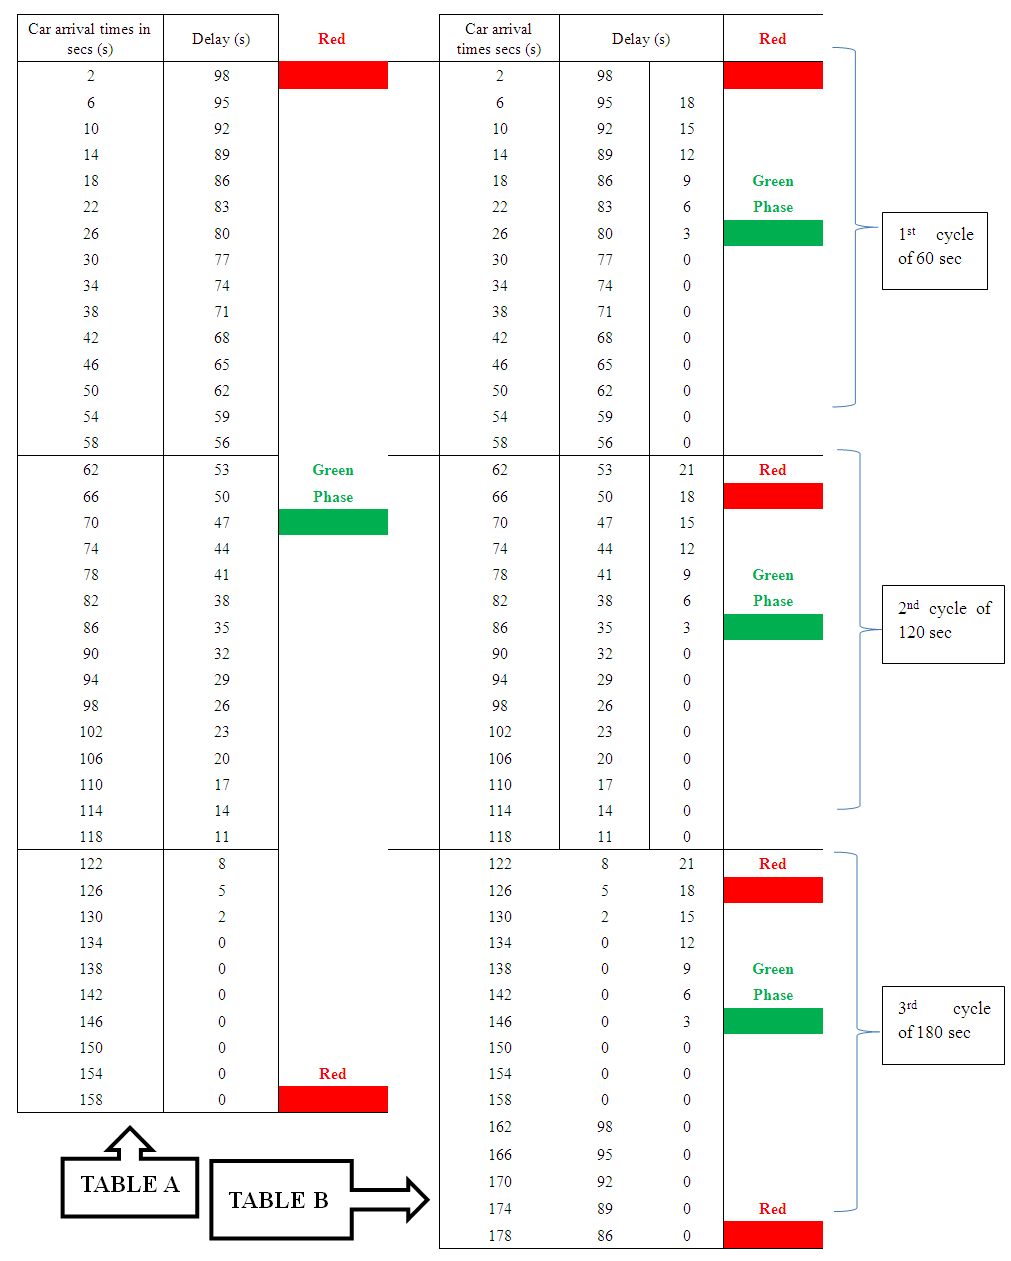 | Table 1. |
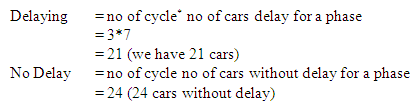 Note: if the no of cars that goes through the light either delay or no delay are not equal for each cycle then someone can easily calculate the number of cars for each part and sum it up, depending on the number of cycle. The total average of cars (Atv) can be calculated for x and y –cycle, where x and y stand for delay and no delayby:X1 +X2 + - - - + Xn = XtvWe therefore divide total number of car by total number of cyclei.e. Atv = Xtv / nFOR NO DELAY:We replace x by y, we then obtain Ytv and for Atv = Ytv / n.
4. Conclusions
- We have been are able to derive a model to construct a mathematical analog Traffic System MATS which we use to determine1. The number of cars that goes through lights either delay or no delay2. The total average time of cars, subject to delay or no delay in traffic.The constructed MATS is recommended for Local Area usage, like the sub settlement on highways, this can also be used by churches, schools and organization for crossing or for joining other cars on high way lane.