-
Paper Information
- Next Paper
- Previous Paper
- Paper Submission
-
Journal Information
- About This Journal
- Editorial Board
- Current Issue
- Archive
- Author Guidelines
- Contact Us
American Journal of Mathematics and Statistics
p-ISSN: 2162-948X e-ISSN: 2162-8475
2015; 5(2): 60-71
doi:10.5923/j.ajms.20150502.03
Analysis of the Effiency of Life Assurance Companies in Kenya Using the DEA-Model
 Abstract
 Reference
 Full-Text PDF
 Full-text HTML
Mohammed Mustapha Wasseja, Samwel N. Mwenda
Kenya National Bureau of Statistics
Correspondence to: Mohammed Mustapha Wasseja, Kenya National Bureau of Statistics.
| Email: |  |
Copyright © 2015 Scientific & Academic Publishing. All Rights Reserved.
The importance of life insurance as part of the financial sector and a player in the economy has significantly increased over the last decades, both as a provider of important financial services to consumers and a major investor in the capital market. However, an examination of a few performance indicators, the industry has been inefficient. Inefficiency affects profits through increased waste on resources and earnings thus adversely affecting sustained growth of the industry. Without sustained growth in the industry, a life insurer may not garner the business volume necessary to ensure collective pooling of insurance risk under the law of large numbers upon which the insurance companies operations relies [1]. Understanding the efficiency of the life insurance sector in Kenya is important because an efficient life insurance industry is critical to propel management of risk, promote long-term savings and serve as a conduit to channel funds from policyholders to investment opportunities. The examination of efficiency of life insurance companies will be pivoted on exogenous factors which include: size of the insurance company, the age of the insurance company since it was incorporated, whether the insurance company has been quoted with the Nairobi Stocks Exchange (NSE) and line of specialization of the insurance company. The efficiency over time has been declining for the period of this study. The average level of efficiency has declined from 0.582 in 2004 to 0.499 in 2009. The results from the Mann- Whitney test indicate that this decline is statistically significant. The life insurance sector’s efficiency has thus deteriorated over the study period. The regression analysis of the external factors on efficiency scores using the bootstrapping procedure sheds some light on the possible drivers of efficiency in the life insurance sector. The size of the insurer and stock exchange listing positively and significantly influence the technical efficiency of life insurance firms. Specialization in life insurance and not offering composite insurance negatively affects the insurer efficiency.
Keywords: Efficiency, Insurance, NSE, Kenya
Cite this paper: Mohammed Mustapha Wasseja, Samwel N. Mwenda, Analysis of the Effiency of Life Assurance Companies in Kenya Using the DEA-Model, American Journal of Mathematics and Statistics, Vol. 5 No. 2, 2015, pp. 60-71. doi: 10.5923/j.ajms.20150502.03.
Article Outline
1. Introduction
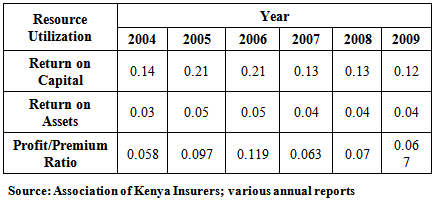
- The history of insurance sectors in most developing countries is alike in that it was one of the product of colonization and the development of a modern economic sector. British and Indian initially offered life assurance services acting as agents for foreign insurance companies and as the business flourished, overseas countries begun establishing branches in Kenya in the 1930’s. By the end of 2009, insurance companies had grown to a total of 46 registered insurers where 23 are underwritten general insurance, 8 are transacting life assurance and 15 are composite insurers. [2]Over the study period (2004-2009), assurance companies in Kenya have recorded growth in the premiums as indicated in figure 1 below. However, a close examination of a few performance signals shows that this industry may be inefficient. Based on the Association of Kenya Insurers (AKI) released on 2009 annual report, return on capital ratio, return on asset ratio and the profit to premium income ratio have fallen since 2006 as indicated in the table 1 and figure 2 below. Inefficiency affects profits through the negative impact of wasted resources on earnings and cash flows and thus adversely affects sustained growth on the industry. In as a much as growth is an important driver for all firms, it is of specific importance to life assurance firms. A life insurer may not garner the business volume necessary to ensure collective pooling of insurance risk under the law if large numbers upon which the insurance companies operate [1].Both as a provider of important financial services to consumers and a major investor in the capital market, the importance of life assurance company as part of the financial sector and a player in the economy has significantly increased over the last decade. The contribution of life assurance sector in Kenya to the economy is included under financial intermediation and accounts for 4.6% of the total GDP in the year 2009 (Economic Survey, 2009). Investment worth Ksh.72.6 billion was held in the Kenyan life assurance industry out of which, Ksh. 21billion was held in government securities as at end of year 2009. Therefore, this sector is a pivotal source of government borrowing. Given this importance of life assurance to the financial sector and the particular importance of the efficiency on sustained growth of life assurance industry, this study seeks to analyse the efficiency of the life assurance sector in Kenya. Life assurance sector has faced a number of structural changes in the recent past. Composite insurers has slowly separated their life assurance business into a fully fledge life assurance business entity to reduce inefficiency associated with underwriting both life and general insurance companies. This was done with the intent to avoid underwriting losses from general insurance with investment income generated from life assurance by composite insurers. In a bid to increase growth in the industry, capitalization was raised from Ksh, 50 million to Ksh.150 million in the year 2007. A couple of insurers have begun consolidation for example, Insurance company of East Africa (ICEA) and Lion of Kenya Insurance Company Ltd that are merging their life assurance business. Example, heritage and CFC life assurance Ltd started their merge process in the year 2008 to be underwritten by CFC life assurance Ltd. As a result, competition has heightened in this sector. Consequently, inefficient insurers cannot survive in this incredibly competitive market and as such, life insurance firms need to be efficient to ensure their survival. This paper therefore, attempts to investigate and analyse the efficiency of life insurance firms in Kenya in the last six years (2004-2006) using a non-parametric approach. The second object is to examine the factors that affect efficiency in a bid to explain the variation of efficiency levels among life insurers.
|
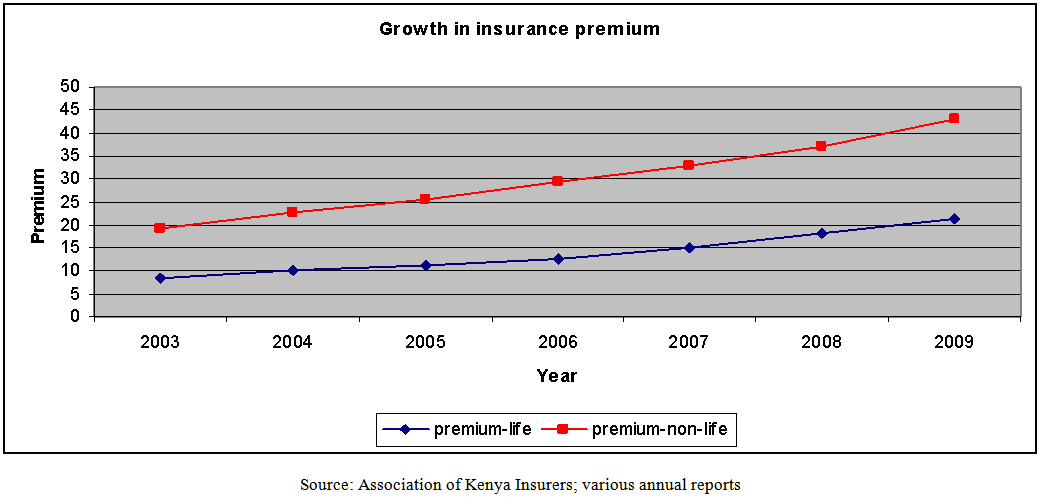 | Figure 1. Growth of insurance premium |
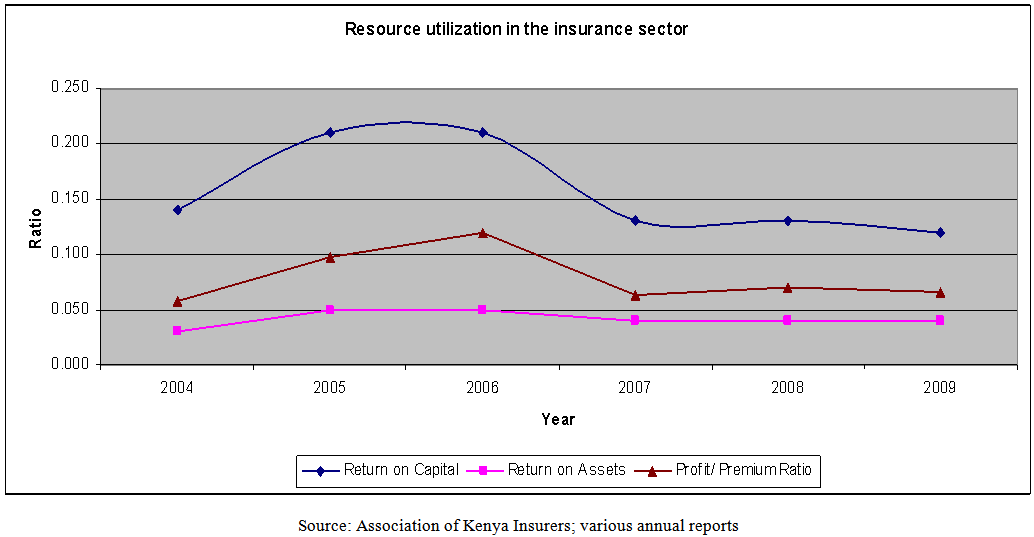 | Figure 2. Performance Indicators |
2. Literature Review
- For a long time, it was considered adequate to use the average productivity of labour as a measure of efficiency. This however ignored all other inputs. Indices of efficiency have been constructed until recently when frontier analysis was used as a measure of efficiency [4]. Efficiency is a relative concept as it is not possible to define some theoretically ideal level of efficiency and thus firms have to be compared with those that constitute the best practice in the industry. The term efficiency can be in different way such as economic efficiency, technical efficiency, allocate among others. Allocative efficiency reflects the ability of a firm to combine the inputs and output in optimal proportions, given their respective prices. Technical efficiency is the ratio of actual output to the maximum output attainable with given amounts of inputs [5]. It takes a value between zero and one in which case a value of one implies that a firm is fully efficient. A firm is thus technically inefficient if it operates below the efficiency frontier.The Concept of EfficiencyEfficiency of a production unit is defined as the ratio of observed to optimal value of its output and input. The comparison can take the form of the ratio f observed to maximum potential output obtainable from the given input, or the ratio of maximum potential to observe input required to produce the given output. Productive efficiency of a firm consists of two components: technical efficiency, which reflects the ability of a firm to obtain maximal output from a given set of inputs, and allocative efficiency, which reflects the ability of a firm to combine the inputs and the output in the most optimal proportions, given their respective prices. If the prices are available, a measure of economic efficiency (cost efficiency) can be provided and thereafter a measure of allocative efficiency an also be determined by the ratio of economic efficiency to technical efficiency.The concept of efficiency can be illustrated in simple firms using two inputs X1 and X2 to produce a single output q. the unit’s isoquant of the efficient firms represented by AA in Figure 1, and assumes constant returns to scale. It shows various combinations of inputs producing a unit level of output.
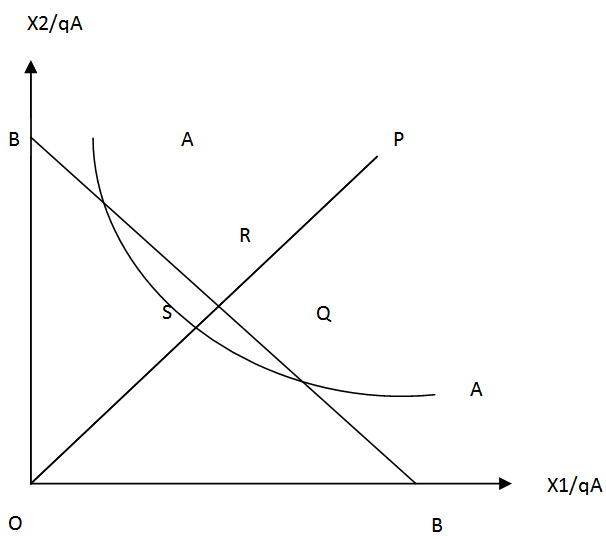 | Figure 3. Illustration of the Concept of Efficiency |
 A technician is said to be technically efficient if production occurs on the boundary of producer’s production possibilities; it is technically inefficient if production occurs in the interior of the production possibilities set. The term technical inefficiency is used to embrace all reasons for actual performance falling short of the maximum that can be attained using a given set of inputs. In figure 1, the line BB represents the input price, so that the allocative efficiency (price efficiency) of the firm operating at p is defined as:Allocative Efficiency =
  The economic efficiency is defined as a product of technical and allocative efficiency, which is overall cost of producing at Q relative to P.Economic efficiency =
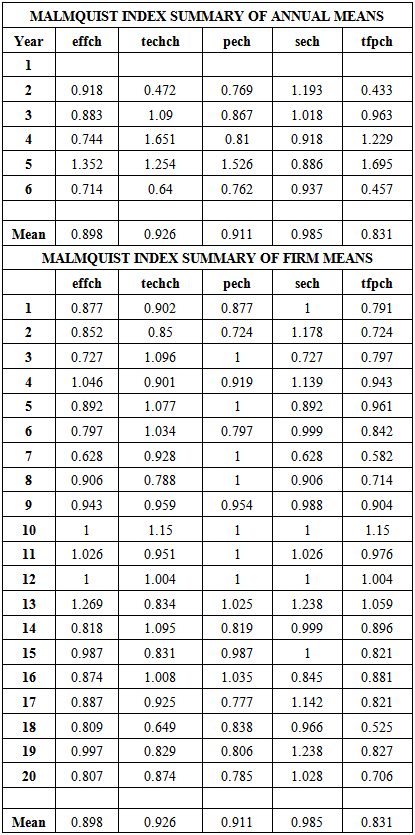
 The concept of efficiency is closely linked with the issue of productivity. The productivity of a firm is generally defined as the ratio of the output that is produces to the inputs that is uses. Rising productivity implies either more output is produced with the same amount of inputs, or that fewer inputs are required to produce the same level of output, hence rising efficiency with the outward shift of a production frontier signalling productivity growth.Efficiency MeasureAn attempt to measure firm efficiency started with the research work of [5]. Based on his model, several procedures have been developed over tine to estimate technical efficiency. The most recent of these models are the stochastic frontier analysis (SFA) developed by [6] and data envelopment analysis (DEA) developed by Charnes et al. (1978). The stochastic frontier model requires the specifications of the form of the efficient frontier by assuming a specific functional form. SFA specifies an efficient frontier form usually trans-log and assumes a composed error model where inefficiencies follow an asymmetric distribution and the random error term follows a symmetric distribution, usually normal. DEA puts less structure on the specification of the efficient frontier and does not decompose the inefficiency and error terms.The same characteristics that make DEA a useful analysis tool can also create problems. It is deterministic and gives point estimates that do not provide information about uncertainty in estimation and depends on the correctness of frontier units. Since DEA is a non-parametric technique, statistical hypothesis testing is difficult. [8] proposed a bootstrap procedure as a solution to perform the desired inference under DEA methodology.General level of efficiency over time[9] analyse efficiency of Nigeria’s insurance companies in a two stage DEA model. DEA is widely used to calculate both technical and scale efficiency. The finding indicates that most companies are not the efficient frontier with regards to technical efficiency and two of the insurance companies are scale inefficient. They suggest that insurance companies operating within bank networks tend to have higher efficiency scores which may be explained by the scope economies related to networks. After establishing the efficiency scores, the Mann-Whitney U-test is used to test some hypothesis related to efficiency scores. The hypotheses are with regards to firm size, integration into bank networks and insurer markets share. [10] evaluated the cost efficiency Of Thailand’s life assurance industry using a stochastic frontier approach. They estimated a cost function which constitutes a vector of the output, input price, the inefficiency variable and the random error term to measure how far the life insurer’s cost is relative to its best practice. Inefficiency was then modelled as a function of firms’ specific variable by regressing it on firm specific variables. These variables are age of firms, firm size and a dummy variable for financial crisis. They found that the industry is on average 60% inefficient. They also investigated the relationship between efficiency and profitability and concluded that inefficiency has substantial effect on profitability of life insurers. [11] examine the effects of increasing competition on the structure of the UK life assurance industry over 1989-1993 by employing a stochastic frontier approach. He reports high levels of economic inefficiency (costs are on average about 30% above the estimated cost frontier) and significant positive economies of scale. He argues that the principal beneficiaries from the European single market are likely to be large companies with lower levels of economic inefficiency. [12] measured efficiency of property insurer in the US by estimating a stochastic cost frontier. The results show that insurers operate in a narrow range around an average efficiency level of around 90% relative to their cost frontier. Large insurers over-produce loss settlement services, while small and medium-size insurer’s under-produce this output. The small insurers are characterized by economies of scale, suggesting the potential for cost reduction from consolidation in the industry.Effects of Regulatory Change[13] measure the relative technical efficiency of the Greek insurance industry by means of DEA to analyse the effects of deregulation on the efficiency. The analysis is based on a two stage procedure to regress the efficiency scores to examine the hypotheses that insurance is determined by different contextual variables. They use the double bootstrap procedure in a truncated regression to analyse the effects of environmental factors on efficiency of the Greek insurance market. The external variables used are ownership structure, size, stock exchange listing, market’s share and capital structure. Market share is found to have positive effects on efficiency. [14] measured cost efficiency in the European insurance sector using stochastic frontier analysis and explored variations in efficiency in relations to firm size and market structure. They estimated a flexible form frontier assuming a flexible frontier functional form for the three main business types observed in the EU: life, non-life and composite insurers to measure the impact of liberalization of the European insurance market. They find strong evidence that x-inefficiency of specialist insurer’s increase with firm size. The degree of x-inefficiency for composite firms in low and varies with size. [15] studied the impact of the WTO accession in 2001 by China on technical efficiency of China’s insurance industry using DEA. They used a panel data set of 22 firms the period of 1999-2004, to evaluate their technical efficiency scores. An econometric model was then applied to identify the key determinants of technical efficiency. The results indicated that firm’s size, ownership structure, mode of business and human capital are important factors affecting firm’s efficiency. [16] analysed whether changes in market structure and regulatory environment had an influence on the production performance of Austrian insurance companies over 1994-1999 by employing a Bayern stochastic frontier. They show that the process of deregulation had positive effects on the production efficiency of the Austrian insurance companies. [17] investigate the impact of the single market project of the EU on the German insurance industry efficiency over 1992-1996 by employing DEA and Malmquist analysis[18]. Total factor productivity was found to have increased by 12.8%. [19] studied the effects of deregulation and consolidation on Spanish insurance industry efficiency over 1989-1998 by using DEA and Malmquist indices. They reported a low average cost efficiency of 22.7% in 1998, which is mainly due to low allocative efficiency, 41.2% in the same year (1998). Moreover, firms in the largest size quartile were found to be more cost effective due to higher pure to higher.
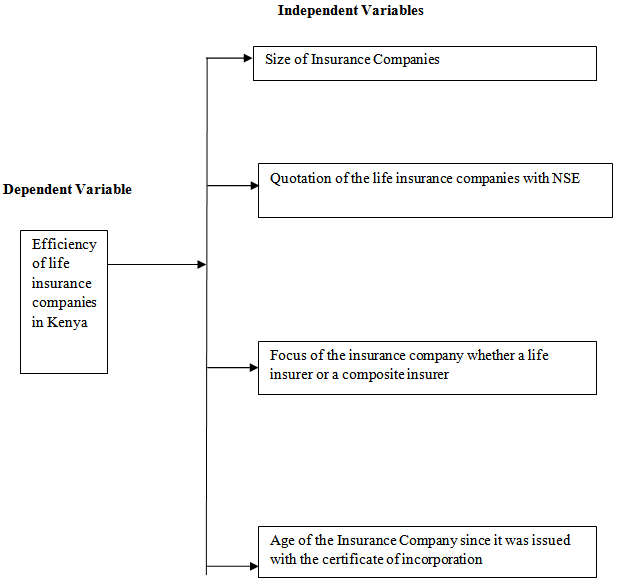
 2.1. Conceptual Framework
- To examine how external factors impact on the level of efficiency, the two-step approach has been described by [8] and used by [13] among others. Those external factors include, and not limited to:a. Size-taken as the natural log of the total asset of the company under consideration, it is included among the explanatory variables to account for the association between size and economies of scale in the life assurance industry. b. Quoted is a dummy variable which is one for companies quoted in the stock exchange intended to capture the effects of stock market governance and disclosure requirements on efficiency. Ideally, firms that are quoted in the NSE are expected to be more efficient because of the additional oversight requirement on efficiency by such bodies.c. Whether an insurance company is a life insurance or a composite insurance company is also going to be used as a measure of efficiency of life insurance companies in Kenya. Ideally, studies have found that multi-line insurance firms are more efficient. Therefore, 9focus is going to be on insurance firms, which only specialize in life assurance, and composite insurance companies that are multi-line insurance firms.d. The age is also another explanatory variable, which denotes the number of years that a firm has been in the life insurance business. Accordingly, older insurers are expected to be more efficient due to experience in the business. Older firms therefore, are more efficient because of learning-by- doing.The coefficients of these external factors ought to be positive for they all affect efficiency positively.
3. Methodology
- Data Envelopment AnalysisDEA is a multi-factor productivity analysis model for measuring the relative efficiencies of a homogeneous set of decision-making units (DMUs). Following [7] the efficiency scores is defined as:
 Such that
 | Figure 4. |
 can be derived by solving the following linear programming equation.
 i=1,….,n firmsWhere
  is a vector of output,
  is a vector of inputs, λ is a 1 ×1 vector of constants. The value of
  obtained is the technical efficiency score for the ith firm. A measure of
  indicates that the firm is technically efficient and otherwise inefficient. This paper utilizes the multi-stage DEA approach which is recommended to handle the problem of slack variables as it is invariant to units of measurement [20]. Data Source and VariablesThis study uses secondary data from 20 life assurance companies in Kenya obtained from Insurance Regulatory Authority for the period 2004-2009. In a bid to use balanced panel Data in the analysis, first insurance and Pan African life insurance companies were left out since they controlled a combined market share of 14%. The 2 insurance companies were not in existence over the study period considered.The most important advantage for using panel data as opposed to cross section data is that it leads to better efficiency analysis as each firm is observed more than once over a period of time and it contains more observations. This enables us to have a better analysis of the determinants of efficiency.The choice of the inputs and the output is guided by the literature review. Labour, business services and material, debt capital and equity capital are used as inputs. The collection of the data was purposive, and therefore, labour and business services are combined as operating expenses (including commission). This simplification is present in other studies [14], [16], [22] among others.As it is evident from most studies on efficiency of life insurance industry, value added approach is used to determine outputs [22]. A good proxy for measuring the output of life insurers is the value of net incurred benefits plus additions to reserve for life insurance. The output variable, which proxies the intermediation function, is the value of total investments.The BootstrapDEA efficiency scores are sensitive to sample composition incase of finite samples. The efficiency scores are also correlated with each other, as the calculation of efficiency of one form incorporates observation of all other firms in the same data set. This renders standard inference approach invalid. Bootstrapping, as described by [8] has been used to analyse the sensitivity of the results. [8] extended this by proposing the double bootstrapping procedure which solves the dependency problem and provides valid estimates for the parameters in the second stage regression. This second bootstrap procedure is used to analyse the impact of external factors on efficiency. Use of Ordinary Least Square regression to estimate this relationship may lead to incorrect statistical inference because the DEA score are correlated with each other as the calculation of efficiency of one insurer takes into account all other insurers in the data set. The procedure applied in this study follows [8].Determinants of EfficiencyTo examine how external factors affect the level of efficiency, we use a two-step approach described by [8] and used by [13]. The efficiency scores derived above are bootstrapped to obtain bias-corrected DEA efficiency scores which are then regressed on the external factors. This has been formulated as:
 Where
Where  represents the bootstrap efficiency score. Following [1] and [10], size is taken as the natural log of the total assets of the respective insurer. Size is included among the explanatory variable to account for the association between size and economies of scale in the life insurance industry. Larger insurers have the advantage of economies of scale and therefore, we expect the size coefficient to be positive. Quoted is a dummy variable which is one for companies quoted in the stock exchange and it aims at capturing the effects of stock market governance and disclosure requirements on efficiency. Firms quoted in the stock market are expected to be more efficient given the additional oversight requirement from the capital market regulations. Some insurers only transact only on life insurance while others are composite insurers. Existing literature is conflicting as to whether specialization on one line of insurance increases insurers efficiency or not. [22] found that, multiple-line insurers are more efficient while [19] concluded that diversifying in different lines of business is not better than a strategic focus on one line of insurance. Focus is a dummy variable which equals to 1 for insurers who specialize only on life insurance and 0 for composite insurers. Age denotes the number of years a firm has been in the life insurance business. Following [10] study results, older insurers are expected to be more efficient given the experience in the business. Older firms are more efficient because of learning-by-doing. The coefficient of this variable is thus expected to be positive.
4. Results and Discussions
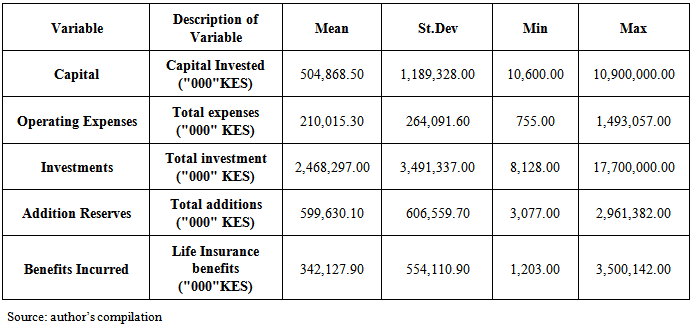
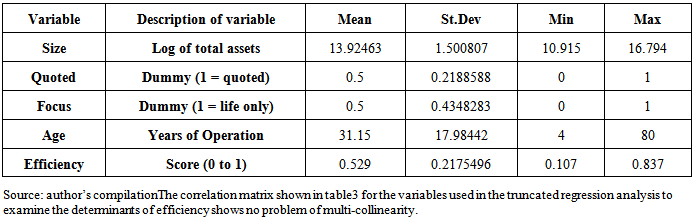
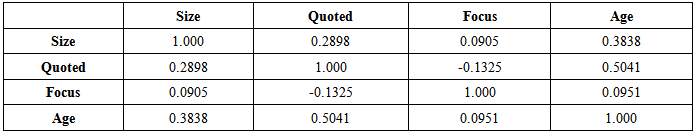
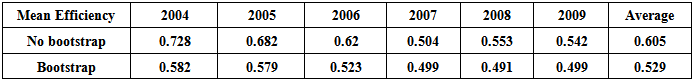
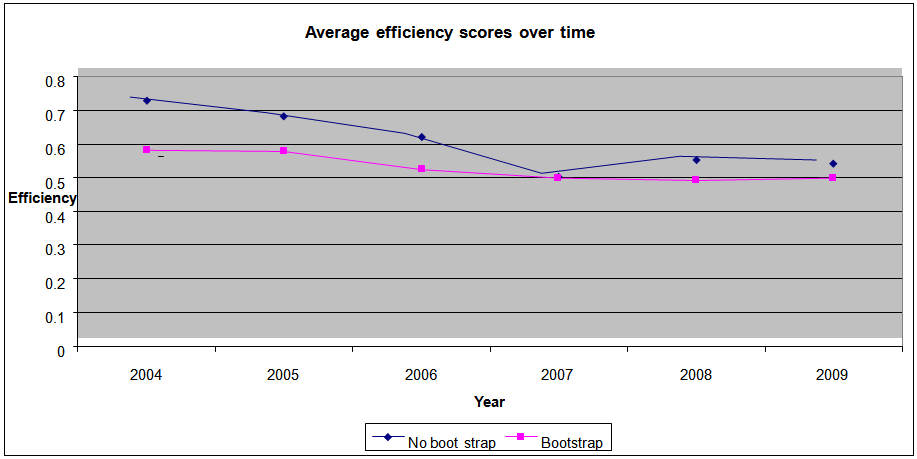
- Table 2 and table 3 present the summary statistics of the data variables. The number of insurers analysed is 20 over a period of six years which gives a total of 120 observations. The study respected the DEA convention that the minimum number if DMUs is greater than three times the number if inputs plus the outputs [13]. From the data, there is a wide variation with regards to capital invested with a minimum of Ksh10.6 billion and a maximum of Ksh. 1,090,000. This shows that there are small and large life insurers. This is also noted for operating expenses and additions to reserves. The same variation is noted with the amount of investments done. Benefits paid out to policy holders show a minimum of Ksh I.203 billion paid out by an insurer in one year and Ksh 3,500,142,000 by another insurer with the highest number of policy holders. This indicates a wide variation with regards to market share in the industry. Table 2 provides data used in the regression to examine the external factors that influence efficiency. Size of insurers has been denoted by the log of total assets as guided by literature. Stock exchange participation (quoted) has been denoted by a dummy where 1 represents a quoted insurer and insurers who only concentrate on life insurance are denoted by a dummy of 1 and zero for composite insurers. The age of the insurers varies from 4 to 80 years. The average age of operation for the life insurers is 31 year.Empirical Results: Data Envelopment AnalysisEfficiency scores the calculation of technical efficiency scores is done under the multi-stage DEA method. This method is invariant to units of measurements [20]. The analysis was done under the assumption of variable returns to scale (VRS). The advantage of the variable returns to scale assumption is that it relaxes the assumption that all firms are operating are an optimal scale. The results of the data envelopment analysis are presented in summary in table 3 and appendix B2. The detailed results are shown in appendix A. The efficiency scores are calculated using [8] algorithm 2 which uses 2000 replications to bootstrap. The results show that on average the overall industry efficiency is 52.9%. This means that 47.1% of the life insurers have an average efficiency of less than 0.5 and none of them has an average efficiency score of more than 0.75 over the study period. Using the bias corrected/bootstrapped efficiency results, no single life insurance firm is 100% efficient for the entire study period and only four insurers; insurance company of East Africa, Kenindia Insurance co., Heritage insurance co. and Geminia Insurance Co. have an efficiency score of more than 0.70. According to the results from our DEA analysis, Trinity Life Assurance and Old Mutual Insurance Co are the least efficient with an efficiency score of less than 0.32.Looking at the efficiency distribution over the years, as summarized in table 3 and figure 4, we observe that mean efficiency score has declined over the study period from a score of 0.582 in 2004 to o.499 in 2009. Efficiency level however, has picked up in 2009 to o.499 from 0.491 in 2008. The mann-whitney test has been adopted to test for differences between the efficiency scores. The results as shown in appendix A indicate that the mean efficiency across the years is only significant for 2004 to 2009. The decline in the efficiency from 0.582 in 2004 to 0.529 in 2009 is significant at 10% level of significance. The increase in mean efficiency from 0.491 in 2008 to 0.499 in 2009 is however not significant at both 5% and 10% significance level. This means that overall efficiency has been declining in this sector from years 2004 to 2009.
|
|
|
|
|
 | Figure 5. Efficiency over time |
|
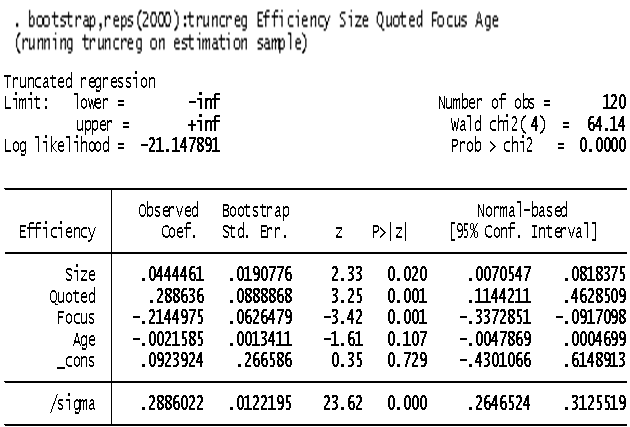
 The coefficient for size was positive and significant at 5% significance level. This means that the size of the life insurance firm positively affects efficiency. Large insurers are more efficient than small life insurance firms. This finding supports [10] and [15]. Since some life insurers in Kenya are relatively small in size, consolidation in this sector can lead to increased efficiency. Firms that are listed on the stock exchange are expected to be more efficient. From our results, the coefficient for Quoted is positive and also significant at 5% level of significance. A quoted firm on the Nairobi Stock Exchange can benefit from the enhanced corporate governance and other transparency requirements by the capital market regulator and also increased shareholder expectation with regard to its performance. This then leads to enhanced level of efficiency of the insurer. The coefficient for Focus is negative and significant. From our results, insurance firms in Kenya that specialize in only life insurance and are thus not composite insurers are less efficient than composite insurers. The results obtained in this study are similar to those obtained by that [22] who did a cross country study of 36 countries and found out that multi-line insurance firms are more efficient than specialized ones. Age is not significant at 5% and 10% level of significance indicating that the age of life insurance firms does not matter to efficiency. These results are similar to the findings of [10] in their study of life insurance sector in Thailand.Controlling for the independent factors that are not significant, the model reduces to:
 This multi regressive model does not include the constant and the independent factor age since they are not significant at 5% level of significance and therefore they been left out.
5. Conclusions and Policy Recommendations
- This chapter presents the summary of the findings of the study in relation to set objectives. It also includes conclusions, recommendations and suggestions for further research.Summary of major findingsThe study sought to find out the efficiency of life insurance companies. We observe that mean efficiency score has declined over the study period from a score of 0.582 in 2004 to 0.499 in 2009. Efficiency level however, has picked up in 2009 to o.499 from 0.491 in 2008. The mann-whitney test has been adopted to test for differences between the efficiency scores. The results as shown in appendix A indicate that the mean efficiency across the years is only significant for 2004 to 2009. The decline in the efficiency from 0.582 in 2004 to 0.529 in 2009 is significant at 10% level of significance. The increase in mean efficiency from 0.491 in 2008 to 0.499 in 2009 is however not significant at both 5% and 10% significance level. This means that overall efficiency has been declining in this sector from 2004 to 2009. From the analysis, external factor have a positive influence on the efficiency of life insurance companies except age. Therefore, it’s evident that the age of an insurance company does not have any influence on the efficiency of life insurance companies. Size, focus and quotation, on the other hand, have a positive influence to the efficiency of life insurance companies.ConclusionsThis study estimates the level of technical efficiency of the life insurance sector in Kenya and examines the factors that determine efficiency using the Data Envelopment Analysis for the year 2004 to 2009. The study findings reveal that overall efficiency level of the life insurance sector in Kenya is 52.9%. This indicates a potential of 47.1% to improve output without the use of more input resources. The variation of efficiency levels among the firms is wide with the least efficient firm at 0.231 efficiency level and the most efficient at 0.723. Only 12 out of the 20 life insurers analysed in this study have an efficiency score greater than 0.5. The efficiency over time has been declining for the period of this study. The average level of efficiency has declined from 0.582 in 2004 to 0.499 in 2009. The results from the Mann- Whitney test indicate that this decline is statistically significant. The life insurance sector’s efficiency has thus deteriorated over the study period. The regression analysis of the external factors on efficiency scores using the bootstrapping procedure sheds some light on the possible drivers of efficiency in the life insurance sector. The size of the insurer and stock exchange listing positively and significantly influence the technical efficiency of life insurance firms. Specialization in life insurance and not offering composite insurance negatively affects the insurer efficiency.Policy RecommendationsThe size of the life insurance firm positively affects efficiency. The government has already initiated reforms that were supposed to lead to consolidation in the industry. Kenya’s life insurance sector has many small players with little financial strength to underwrite large insurance policies and unable to compete in the continental and global scene. This increase in capitalization of life insurers from KES 50 million to KES 150 million has however not led to consolidation in the industry. To encourage consolidation in this sector, the government should increase the re-capitalization further. Stakeholders in industry through the association of Kenya insurers (AKI) had suggested a re-capitalization level of KES 500 million, equivalent to $6m. The government should thus go by this recommendation. Similar reforms have succeeded in Nigeria by increasing recapitalization to $16.2 million. Kenya’s minimum capital of approximately $2 million compares unfavourably with Cameroon, Benin, Senegal at $2.2m, Morocco - $6.3m, Egypt- $10.9m, Angola-$8m, among others. For the industry to consolidate and obtain the wherewithal to develop and market low-priced life insurance products, a higher capitalization base is required. The Insurance Regulatory Authority (IRA) and the Association of Kenya Insurers (AKI) should convene a workshop for the directors, investors and stakeholders in the life insurance sector where professionals with expertise in insurance, financing and mergers and acquisitions can present papers on topics covering issues involved in consolidation to educate all stakeholders on the need for high capitalization. This paper finds a positive and statistically significant impact of stock exchange listing on insurer efficiency. Various reforms have been done to encourage firms to list on the stock exchange over the years since the establishment of the Capital markets Authority (CMA) in 1990. The latest of these reforms was the incentive in the 2006/2007 fiscal year budget speech that made legal costs and other incidental costs for company listings income tax deductible and the reduction of the fees for new listings from 0.3% of the value of issue to 0.15% in the 2009/2010 fiscal budget speech. However, these reforms have not led to increased stock exchange listing. The policy advice here is for the policy makers to reduce the listing fees further to 0.03%. This level is able to encourage new listings and compares with most emerging economies.