-
Paper Information
- Paper Submission
-
Journal Information
- About This Journal
- Editorial Board
- Current Issue
- Archive
- Author Guidelines
- Contact Us
American Journal of Mathematics and Statistics
p-ISSN: 2162-948X e-ISSN: 2162-8475
2015; 5(1): 37-41
doi:10.5923/j.ajms.20150501.06
Comparison of Outlier Detection Procedures in Multiple Linear Regressions
 Abstract
 Reference
 Full-Text PDF
 Full-text HTML
Gafar Matanmi Oyeyemi 1, Abdulwasiu Bukoye 2, Imam Akeyede 3
1Department of Statistics, University of Ilorin, Ilorin, Nigeria
2Department of Statistics, Auchi polytechnic, Auchi, Nigeria
3Department of Mathematics Federal University Lafia, Lafia, Nigeria
Correspondence to: Gafar Matanmi Oyeyemi , Department of Statistics, University of Ilorin, Ilorin, Nigeria.
| Email: |  |
Copyright © 2015 Scientific & Academic Publishing. All Rights Reserved.
Regression analysis has become one of most widely used statistical tools for analyzing multifactor data. It is appealing because it provides a conceptually simple method for investigating functional relationship among variables. A relationship is expressed in the form of an equation or a model connecting the response or dependent variable and one or more explanatory or predictor variables. The major problem that statisticians have been confronted with, while dealing with regression analysis, is presence of outliers in data. An outlier is an observation that lies outside the overall pattern of a distribution. In other words it is a point which falls more than 1.5 times the interquartile range above the third quartile or below the first quartile. Several statistics are available to detect whether or not outlier(s) are present in data. Therefore, in this study, a simulation study was conducted to investigate the performance of Deffits, Cooks distance and Mahalanobis distance at different proportion of outliers (10%, 20% and 30% )and for various sample sizes (10, 30 and 100) in first, second or both independent variables. The data were generated using R software from normal distribution while the outliers were from uniform distribution. Findings: For small and medium sample sizes and at 10% level of outliers, Mahalanobis distance should be employed for her accuracy of detection of outliers. For small, medium and large sample size with higher percentage of outliers, Deffits should be employed. For small, medium and large sample sizes, Deffits should be used in detecting outlier signal irrespective of the percentage levels of outliers in the data set. For small sample and low percent of outliers Mahalanobis distance should be employed for easy computation.
Keywords: Outliers, Linear regression, Simulation, Probability
Cite this paper: Gafar Matanmi Oyeyemi , Abdulwasiu Bukoye , Imam Akeyede , Comparison of Outlier Detection Procedures in Multiple Linear Regressions, American Journal of Mathematics and Statistics, Vol. 5 No. 1, 2015, pp. 37-41. doi: 10.5923/j.ajms.20150501.06.
Article Outline
1. Introduction
- Regression analysis is a conceptually simple method for investigating functional relationships among variables. For example; The University management may wish to relate the performance of students with number of hours spent by the students on internets. We may wish to examine whether cigarette consumption is related to various socioeconomic and demographic variables such as age, education, income, and price of cigarettes. The relationship is expressed in the form of an equation or a model connecting the response or dependent variable and one or more explanatory or predictor variables. In the cigarette consumption for example, the response variable is cigarette consumption (measured by the number of packs of cigarette sold in a given state on a per capita basis during a given year) and the explanatory or predictor variables are the various socioeconomic and demographic variables. In the real estate appraisal example, the response variable is the price of a home and the explanatory or predictor variables are the characteristics of the building and taxes paid on the building.Regression models are commonly used to study the functional relationship between a dependent variable(Y) and independent variable(s) (X’s). Usually, ordinary least- squares (OLS) method is applied to the sample data to obtain the fitted linear model or linear regression equation of the dependent variable y on the regressors
 .However, sometimes the samples might contain outliers in the X’s values, the Y’s values, or in both X’s and Y’s values. In that case, some methods of estimation in regression model may not be précised.In statistics, an outlier is an observation that is numerically distant from the rest of the data. [1] defined an outlier as one that appears to deviate markedly from other members of the sample in which it occurs. It is an observation that lies outside the overall pattern of a distributions ([2]) Similarly, Johnson ([3]) defines an outlier as an observation in a data set which appears to be inconsistent with the remainder of that set of data. In many data analysis tasks a large number of variables are being recorded or sampled. One of the first steps towards obtaining a coherent analysis is the detection of outlying observations. Although outliers are often considered as an error or noise, they may carry important information. A convenient definition of an outlier is a point which falls more than 1.5 times the interquartile range above the third quartile or below the first quartile. It can also occur when comparing the relationship between two set of data. According to Oxford Dictionary of Statistics (2008), outlier is an observation that is very different to other observations in a set of data. It is a data value which is unusual with respect to the group of data in which it is found. It may be a single isolated value far away from all others, or a value which does not follow the general pattern of the rest. Usually the presences of outliers indicate some sort of problem. This can be a case which does not fit the model under study or measurement error. Outliers are often easy to spot in histograms.Detected outliers are candidates for aberrant data that may otherwise adversely lead to model misspecification, biased parameter estimation and incorrect results. It is therefore important to identify them prior to modeling and analysis ([4], [5]).When the sample data contain outliers, alternative approach to the problem should be applied, to obtain a better fit of the models or more precise estimates of β. Several works has been carried out on outliers’ detection and how to tackle it if present in a data analysis. [5] conducted a comparison study with six multivariate outlier detection methods. The methods’ properties are investigated by means of a simulation study and the results indicate that no technique is superior to all others; Several factors can affect the efficiency of the analyzed methods. In particular, the methods depend on: whether or not the data set is multivariate normal; the dimension of the data set; the type of the outliers; the proportion of outliers in the dataset; and the outliers’ degree of contamination (outlyingness). Another class of outlier detection methods is founded on clustering techniques, where a cluster of small sizes can be considered as clustered outliers ([6]). There are two types of outliers depending on the variable in which it occurs, Outliers in the response variable represent model failure. Outliers with respect to the predictors are called leverage points; and affect the regression model. Indeed, there is need to check whether a data set contains outlier(s), hence different statistics are used to detect the presence of outliers in a sample data, three of which were investigated in this study, these are Cook’s Square Distance, Deffits Distance and Mahalanobis Distance. The proportion of outliers that can best be detected by the different methods and effect of sample size on the methods under consideration were investigated. The outcomes of this research will assist a researcher to understand and know the more efficient statistical tools for detecting outlier amongst deffits, cooks distance and Mahalanobis distance.To help researchers to known at what sample size(s) and at what level of presence of outlier do each statistical tool perform best.
2. Methodology
- In the literature, there are many methods of detection of outliers in multiple linear regressions. They may be classified in to two groups, namely graphical and analytical methods. However, three different methods of detecting outliers were considered in this study, these are Cook’s Square Distance, Deffits Distance and Mahalanobis Distance. These methods are analytical methods which has their procedures as follows:Cook’s Square DistanceCook’s square distance of unit i is a measure base on the square of the maximum distance between the OLS estimate on all n points
 and the estimate obtained when the
  point is not included, say
  . Cook and Weisberg suggest examining cases with
  and that case where
  should always be studied ([7]). This distance measure can be expressed in a general form
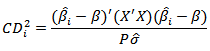
 However, substitute
  statistic may also be rewritten as
 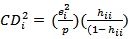 For this research work cooks square distance
  is considered. Any ith observation with values exceeding one (1.0) is counted as an outlier.Deffits DistanceDeffits is a diagnostic tool meant to show how influential a point is in a statistical regression. Its measures how much the predicted for
  wound change if the ith case is being excluded from the analysis. For each observation
  computed
 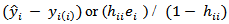 which tells how much the predicted value
  , at the design point
  would be affected if the ith case were deleted. The standardized version of Deffits is
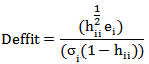

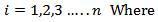
 i =1,2,…,n . ([8]) suggested that any observation for which
 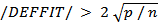 warrants attention for outliers.
 = Number of independent variable n= sample size of the data
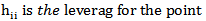
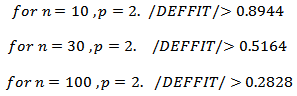 Mahalanobis DistanceThis measure the leverage by means of
  (Mahalanobis distance), where
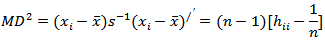
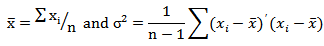 To determine a mahalanobis distance that is too large we compare the distance with 99th percentile of Chi-square distribution with p-1 degrees of freedomIf
  where
where is
is  percentile of a chi-square distribution with p −1 degrees of freedom then there is an outlier.In this work data were simulated and analys for multiple linear model with two independent variables using R statistics.
3. Method of Simulation and Analysis
- All data used for this study were simulated, because it might be difficult to get secondary data that contain required number of outliers. Simulation technique is a dependable tool in situations where statistical or mathematical analysis is either too complex or too costly. According to ([9]), simulation is the process of designing a model of real system by conducting experiments with this model for purpose of understanding the behavior of the operation of the system. In this work, a set of replication of data sets are generated from the multiple linear regression models with two independent variables stated as follows
 where all regression coefficients
  were fixed to be
 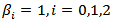 and the errors are assumed to be independent. The independent variables were independently simulated from standard normal
  the outlier were injected to the sample from uniform distributed
  the data sets are generated under the two regressor (p=2) and the sample sizes considered are small, moderate and large samples with n=10, 30, and 100 respectively. The outlier are introduced to the simulated data at three different levels of 10%, 20% and 30% for each set of simulated data.The following procedures were taken for the simulation and analysis:1. X1 and X2 were simulated from N(0,1) using R Statistical software2. Ten (10%), twenty (20%) and thirty (30%) percent of outliers were introduced respectively from U(5,10) into each sample of data generated for X1 and X2 from normal distribution in 1.The simulations were repeated 1000 times.3. The data simulated were analysed and the following were examined
  - The number of times the outliers were detected.
 - The number of times each test statistics correctly identifies actual percentage number of Outliers introduced.
 - The probability of times outliers were over identified.
 -The probability of times outliers were under identified.4. Each statistic is computed for each sample and replicates. 5. We make comparison of detection of outliers by counting the number of times that each statistic over, under, accurately and identifies outliers.6. The variation in comparison of three outlier detection methods will provide an indication of the sensitivity of the methods. Thus, the best method(s) were recommended for various sample size.
4. Simulation Results and Data Analysis
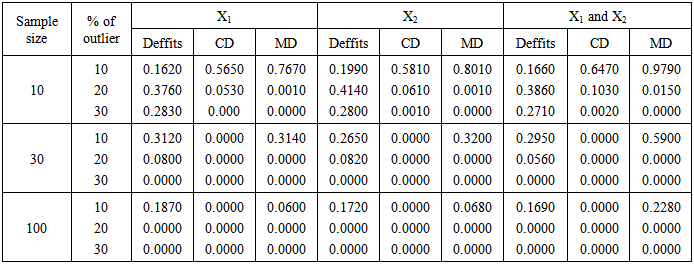
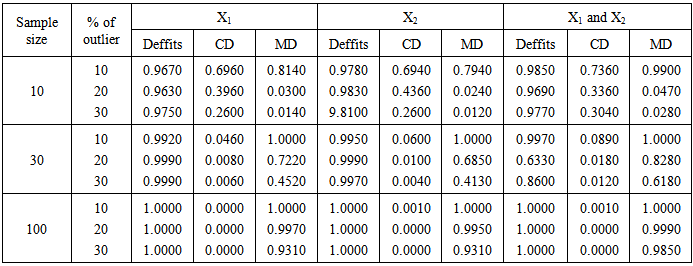
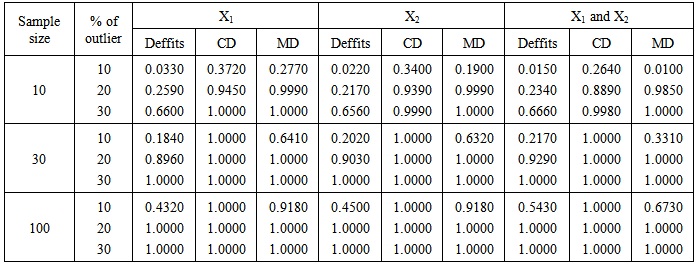
- The results of the three methods of detecting outliers were presented in table 1- 4. The procedures involved introduction of 10%, 20% and 30% outliers to each simulated sample sizes of 10, 30 and 100 and each simulation were repeated 1000 times. Furthermore, the data simulated were analyzed by the three statistic (Deffits, Cooks distance and Mahalanobis distance). Table 1 presents the probability of correct identication of actual number (percentage) of outliers in the predictors. Table 2 shows the probability of signals of outliers while Table 3 presents the proportion of over detection of outliers. The proportion of under-detection of outliers is presented in Table 4.
|
|
|
|
5. Discussion and Conclusions
- Based on the results of the simulated data and analysis, the results show that the outlier detections follow similar trend irrespective of which of the predictor variables contained the outliers (first, second predictors or first and second predictors). Mahalanobis distance detects outliers more accurately in small sample size (n =10) and when the number (percentage) of outlier is small (l0%) while Deffits performs better as level of outliers increases still for small sample size. For medium sample size (n = 30) Mahalanobis distance maintains its accuracy at10% level of outliers and for large sample size Deffits performs best in accuracy.Deffits signals more outliers (over detection) in small and large samples while Mahalanobis distance signals more outliers (over detection) in medium sample size (n = 30) at 10% level of outliers. Deffits seems to be the most strict among the three procedures in the sense that it identified outliers more than number (percentage) of outliers injected, whereas, Cooks distance is more liberal amont the three procedures.
6. Recommendations
- From the result of this analysis, the following recommendations have been made:
 - For small and medium sample sizes and at small number of outliers, Mahalanobis distance should be employed for its accuracy of detecting outliers.
  - For small, medium and large sample size with higher percentage of outliers, Deffits should be employed.
  - For small, medium and large sample sizes, Deffits should be used in detecting outlier signal irrespective of the percentage levels of outliers in the data set.
  - For small sample and low percent of outliers Mahalanobis distance should be employed for easy computation.The key point to stress here is that the above procedures can only serve to identify points that are suspicious from a statistical perspective. It does not mean that these points should automatically be eliminated. The removal of data points can be dangerous. While this will always improve the “fit” of your regression, it may end up destroying some of the most important information in your data. Hence the first question that should be asked is whether there exists some substantive information about these points that suggests that they should be removed. Do they involve special properties or circumstances not relevant for the situation under investigation? If no then there are no clear grounds for eliminating outliers. An alternative approach is to perform the regression both with and without these outliers, and examine their specific influence on the results. If this influence is minor, then it may not matter whether or not they are omitted. On the other hand, if their influence is substantial, then it is probably best to present the results of both analyses,
 Appendix
- The codes for simulation as well as analysis are given below.Sample size of 10 with 10% outlier on X1 computing for cooks distance.m1 <- matrix(nrow=1,ncol=1000)for (i in 1:1000) {x1<-c(rnorm(9,0,1),runif(1,5,10))x2<-c(rnorm(10,0,1)e<-rnorm(10,0,1)y<-x1+x2+1+elm1 <- lm(y~x1+x2)cook<-as.vector(cooks.distance(lm1))g<-which(cook>1)count <- length(g)m1[,i] <- countSample size of 10 with 10% outlier on X1 computing for deffits.m2 <- matrix(nrow=1,ncol=1000)for (i in 1:1000) {x1 <- c(rnorm(9,0,1),runif(1,5,10))x2 <- c(rnorm(10,0,1)e <- rnorm(10,0,1)y <- x1+x2+1+elm1 <- lm(y~x1+x2)diffts <- as.vector(dffits(lm1))g <- which(abs(diffts) > 0.8944)count <- length(g)m2[,i] <- count}Sample size of 10 with 10% outlier on X1 computing for mahalanobis distance.m3 <- matrix(nrow=1,ncol=1000)for (i in 1:1000) {x1 <- c(rnorm(9,0,1),runif(1,5,10))x2 <- c(rnorm(10,0,1)e<-rnorm(10)y<-x1+x2+1+ex <- cbind(x1,x2)d <- mahalanobis(x, colMeans(x), cov(x))g <- which(d > qchisq(0.99,1))count <- length(g)m3[,i] <- count}