-
Paper Information
- Paper Submission
-
Journal Information
- About This Journal
- Editorial Board
- Current Issue
- Archive
- Author Guidelines
- Contact Us
American Journal of Mathematics and Statistics
p-ISSN: 2162-948X e-ISSN: 2162-8475
2015; 5(1): 15-23
doi:10.5923/j.ajms.20150501.03

Mathematical Study of HIV and HSV-2 Co-Infection
 Abstract
 Reference
 Full-Text PDF
 Full-text HTML
Udoy S. Basak 1, Jannatun Nayeem 2, Chandra N. Podder 3
1Department of Mathematics, Pabna University of Science & Technology, Bangladesh
2Department of Arts and Sciences, AUST, Dhaka, Bangladesh
3Department of Mathematics, University of Dhaka, Dhaka, Bangladesh
Correspondence to: Jannatun Nayeem , Department of Arts and Sciences, AUST, Dhaka, Bangladesh.
| Email: |  |
Copyright © 2015 Scientific & Academic Publishing. All Rights Reserved.
This work is licensed under the Creative Commons Attribution International License (CC BY).
http://creativecommons.org/licenses/by/4.0/

Mathematical models and underlying transmission mechanism of the HIV and HSV-2 can help the scientists and medical researchers to understand and anticipate their spread in different populations. Present study fitted mathematical models, which exhibit two equilibrium points, namely, the disease free equilibrium point and the endemic equilibrium point. It is found that if the basic reproduction number  the disease free equilibrium point is locally asymptotically stable which may not be globally asymptotically stable when
  If
If  the endemic equilibrium exists which is locally asymptotically stable under some conditions. Numerical simulations suggest that the individual experiencing incident HSV-2 infections are at a risk of HIV acquisition, compared with individuals not infected with HSV-2 or who have prevalent HSV-2 infection. Thus the reduction of the effective contact rate of HSV-2 can reduce the disease burden of co-infection. Controlling the transfer rate from HIV class to the AIDS class disease elimination is feasible. Controlling the transfer rate from the HSV-2 exposed class to the HSV-2 infected class disease control is also feasible.
Keywords: Equilibrium, Local and Global Stability, Endemic Equilibrium
Cite this paper: Udoy S. Basak , Jannatun Nayeem , Chandra N. Podder , Mathematical Study of HIV and HSV-2 Co-Infection, American Journal of Mathematics and Statistics, Vol. 5 No. 1, 2015, pp. 15-23. doi: 10.5923/j.ajms.20150501.03.
Article Outline
1. Introduction
- The name herpes comes from the Greek word "herpein" means "to creep" [4]. Members of the Herpes viridae family have been identified in a variety of animals and they all share certain features, including an ability to establish latency following primary infection, as well as a potential to reactivate and cause further disease [4]. Herpes viruses have large genomes and contain approximately 35 virion genes all of which encode a number of enzymes involved in nucleic acid metabolism, DNA syntheses and protein processing- making them a complex group of viruses [4].Some herpes viruses known to infect animals, some are known to establish infection and cause disease in humans. These human herpes viruses can be divided into three sub-families: Alpha herpes virinae, Beta herpes virinae and Gamma herpes virinae. In the Alpha herpes virinae subfamily are the following: simplex virus (herpes simplex virus -1 [HSV-1] and 2 [HSV-2]) and varicellovirus (varicella-zoster virus [VSV]). "Alpha herpes viruses are the most aggressive" [4]. They will infect a large variety of cell types and tissues and can reproduce very quickly. They have been the favourite targets of antiviral-chemotherapy.Human immunodeficiency virus (HIV) is a lentivirus that causes acquired immunodeficiency syndrome, a condition in humans in which progressive failure of the immune system allows life-threatening opportunistic infections and cancers to thrive [6, 11, 13]. Infection with HIV occurs by the transfer of blood, semen, vaginal fluid, breast milk [4]. Within these bodily fluids, HIV is present as both free virus particles and virus within infected immune cells. HIV infects vital cells in the human immune system such as helper T cells (especially
 cells), macrophages and dendrite cells. HIV infection leads to low levels of
  cells through a number of mechanisms including: apoptosis of uninfected by stance cells, direct viral killing of infected cells, and killing of infected
  cells by
  cytotoxic lymphocytes that recognize infected cells. When
  cell numbers decline below a critical level, cell-mediated immunity is lost, and the body becomes progressively more susceptible to opportunistic infections [4].Of the 2732 individuals enrolled, 2260 were male, 463 were female and 9 of them were eunuchs. The prevalence of HSV-2 at enrolment was 43%. The HSV-2 incidence 11.4% and the HIV incidence were 5.9% cases per year [4]. The HIV incidence was 3.6% per years among persons without evidence of HSV-2 infection, 7.5% per years among persons with prevalent or remote incident HSV-2 infection and 22.6% per year among persons with recent incident HSV-2 infection [4].The interaction between clinically apparent or self reported genital ulcer disease and HSV-2 sero-status was also investigated. Of the 217 individuals with serologic evidence of incident HSV-2 infection, 51 (23%) had a genital lesion documented at the same visit at which sero-conversion was demonstrated. Using a proportional hazards model, the investigators found that the presence of asymptotic prevalent HSV-2 infection conferred an adjusted hazard ratio for HIV infection of 2.14 (compared with no genital ulceration and negative results of serologic testing for HSV-2). Symptomatic prevalent HSV-2 infection conferred an adjusted hazard ratio of 5.06.In short, this demonstrated that individuals experiencing incident HSV-2 infections are at the greatest risk of HIV acquisition, compared with individuals not infected with HSV-2 or who have prevalent HSV-2 infection. The individuals with serologic evidence of recent incident HSV-2 infection had the highest HIV incidence, illustrating that recent infection with HSV-2 is independently associated with HIV acquisition [4].Dr. Balfour pointed out that some recent in vitro studies have helped to explain the association between HSV-2 and HIV [4]. First, some studies have demonstrated that HSV-2 infection may increase the risk of HIV acquisition through the influx of susceptible, host
  cells to the infected area. Studies have also demonstrated that HSV-2 has the ability to enhance HIV replication. The investigators suggested that the elevated risk of HIV acquisition among individuals with exposure to recent incident HSV-2 may reflect a more vigorous immune response in individuals who are immunologically naive to HSV-2. Further studies examining the local immune response to incident HSV-2 infection may help explain the elevated risk of HIV acquisition that is associated with exposure to incident HSV-2 [4, 12].Here we predict the potential impact of HIV on the probability and the expected severity of HSV-2 outbreaks using a discrete event simulation model. We also focus on the joint dynamics of HIV and HSV-2 at the population level. The model is not for a specific country or nation, and our approach does not preclude the possibility of joint infections. This model is used to explore the impact of factors associated with co-infections on the prevalence of each of the two diseases. The possibility of HIV infections is incorporated within epidemiological frameworks that have been developed for the transmission dynamics of HSV-2. The enhanced deterministic system is used to carry out a qualitative study of the joint transmission dynamics of HIV and HSV-2. We use an epidemiological model to study the dynamics of co-infection of HIV and HSV-2. Although there is no cure for both HIV and HSV-2, but we desire to reduce the disease burden of co-infection. That is, how can we reduce the disease load of HIV and HSV-2 co- infection?In this study we propose a mathematical model for the joint dynamics of HIV and HSV-2 co-infections. Our model is given by a set of differential equations and the details of the co-infection are very complicated, yet, we have managed to model the effects of co-infections in a simple setting.This paper is organized as follows: Section 2 introduces our co-infection model; Section 3 computes the disease-free equilibrium point; Section 4 computes the basic reproduction number for our co-infection model and the local stability of the disease-free equilibrium point; Section 5 calculate the global stability of disease-free equilibrium; Section 6 compute the endemic equilibrium point and its stability; Section 7 focuses on numerical and graphical analysis and Section 8 gives our results and conclusions.
2. Formulation of Model
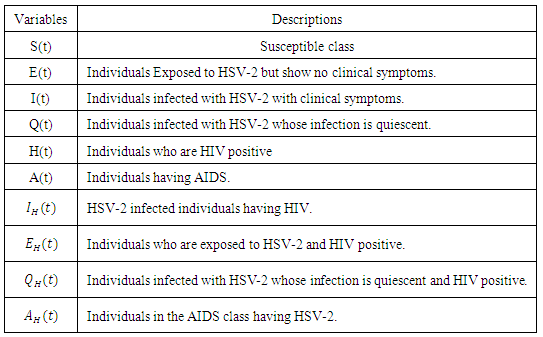
- The total sexually-active population at time t, denoted by
 is subdivided into ten mutually-exclusive compartments, namely susceptible (S(t)), exposed to HSV-2 but show no clinical symptoms of the disease (E(t)), HSV-2 infected individuals with clinical symptoms of HSV-2 (I(t)), infected individuals whose infection is quiescent (Q(t)), individuals who are HIV positive (H(t)), individuals having AIDS (A(t)), individuals who are exposed to HSV-2 and HIV positive
  , Individuals infected with HSV-2 and HIV positive
  , Individuals infected with HSV-2 whose infection is quiescent and HIV positive
  , individuals in the AIDS class having HSV-2
  so that the total population at time t is given by
 The susceptible population is increased by the recruitment of individuals (assumed susceptible) into the population at a rate
  .Susceptible individuals acquire HSV-2 infection, following effective contact with people infected with HSV-2 only (i.e. those in the E, I and Q classes) at a rate
  , where
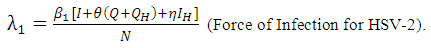 Here
Here  is the transmission rate for HSV-2 and the modification parameter
  accounts for the assumed reduction of infectivity of infectious individuals in the quiescent class. It is assumed that, the infectious individuals of quiescent state are less infectious than active HSV-2 infected individuals because of their assumed reduced viral load. The parameter
  , indicates that an individuals with HIV and infected HSV-2 is more infectious compared with an individual with HIV and quiescent HSV-2.Similarly, the susceptible individuals acquire HIV at a rate
  , where
 Here
Here  is the transmission rate for HIV and the modification parameter
  , indicates that an individual with HSV-2 and AIDS is more infectious then an individual’s having HIV and quiescent HSV-2. Combining all the aforementioned assumptions and definitions, the model becomes:
 Where
Where 
3. Disease-Free Equilibrium Points
- Disease-free equilibrium (DFE) points of a disease model are its steady-state solutions in the absence of infection or disease. We denote this point by
 and define the "diseased" classes that are either exposed or infectious. Thus we can construct the following two lemmas. Lemma 1: For all equilibrium points on
 The positive DFE for the model (1) is
  .Lemma 2: The model (1) has exactly a DFE and the DFE point is
  .Proof: The proof of the lemma requires that we show that the DFE is the only equilibrium point of (1) on
  . Substituting
  into (1) shows all derivatives equal to zero; hence DFE is an equilibrium point. From above lemma, the only equilibrium point for
  is
is  and the only equilibrium point for
  is
is  . Thus the only equilibrium point for
  is DFE point [2].
 4. Local Stability of the Disease-free Equilibrium
- The global stability of the model (1) is highly dependent on the basic reproduction number which is denoted by
 . The basic reproduction number is defined as the expected number of secondary infections produced by an index case in a completely susceptible population. The associated non-negative matrix F, for the new infection terms, and the non-singular M-matrix, V, for the remaining transfer terms, are given, respectively, by
 Where
Where The basic reproduction number
  is the spectral radius of the matrix
  . The Eigen values of the matrix
  are
are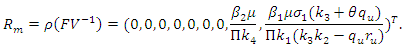
 Thus we have the following lemma.Lemma 3. The disease-free equilibrium
  of the model (1) is locally asymptotically stable whenever
  and unstable
  .
.5. Global Stability of the Disease-Free Equilibrium
- The global asymptotically stability (GAS) of the disease-free state of the model is investigated using the theorem by Castillo-Chavez [1]. So from the model (1) we have
 Here
Here  and so the conditions are not met. So
  may or may not be globally asymptotically stable when
  .
.6. Endemic Equilibrium of the Model
- A disease is endemic in a population if it persists in a population. The endemic equilibrium of the model is studied using the Central Manifold Theorem [1]. To apply this theorem we make the following change of variables. Let


 so that
 Now the model (1) can be rewritten as
 Where
Where 
 as
as Where
Where  and
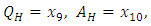
and The Jacobean of the system (2) is
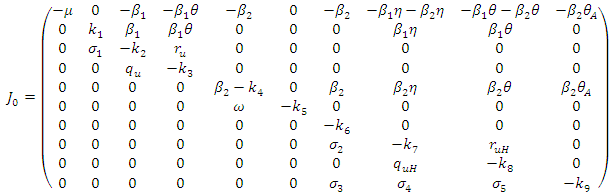 Where
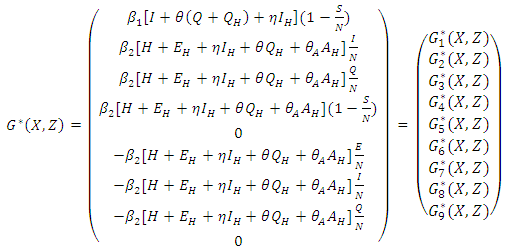
Where  To analyse the dynamics of (2), we compute the Eigen values of the Jacobean of (2) at the disease free equilibrium (DFE). It can be shown that this Jacobean has a right eigenvector given by:
 Where,
 And the left eigenvectors are given by
  , where
  Now using (2) we have:
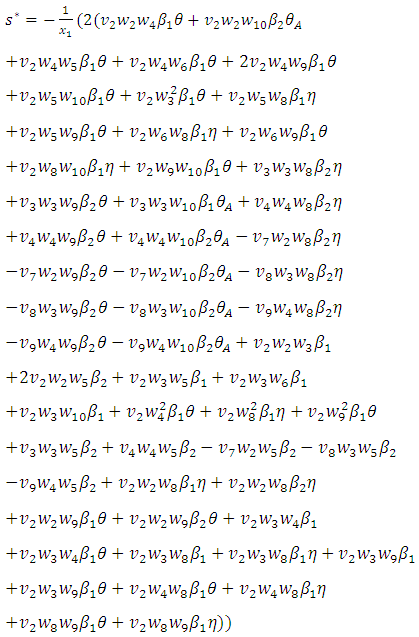 and
and 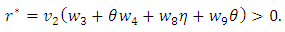
|
|
 when
when where
where  and
and  Theorem 1. The model (1) has a unique endemic equilibrium which is locally asymptotically stable when
  and unstable when
7. Numerical Simulations and Discussions
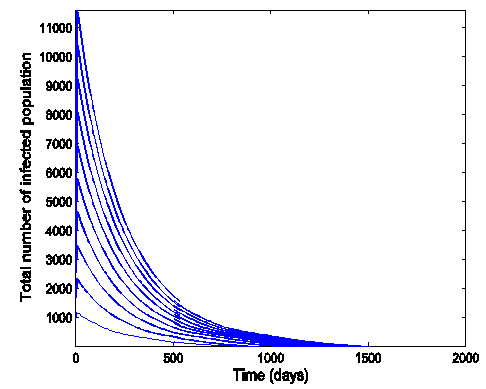
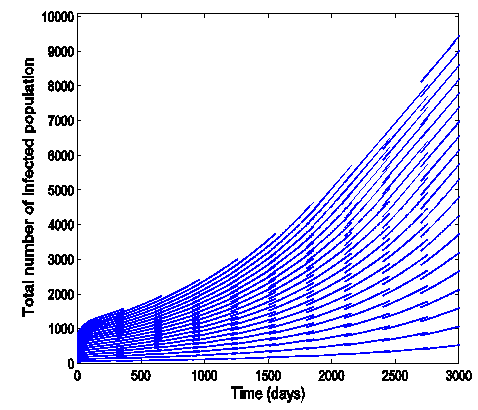
- The effect of the back and forth transmission between the HSV-2 infected class (I (t)) and HSV-2 quiescent class (Q (t)) is monitored in figures (1) and (2). From the figures (1) and (2), it is monitored that, if the forward transmission rate
 is bigger than the backward transmission rate,
  , the infected population as well as the disease prevalence decreases, which is expected. On the other hand if the backward transmission rate
  is bigger than the forward transmission rate,
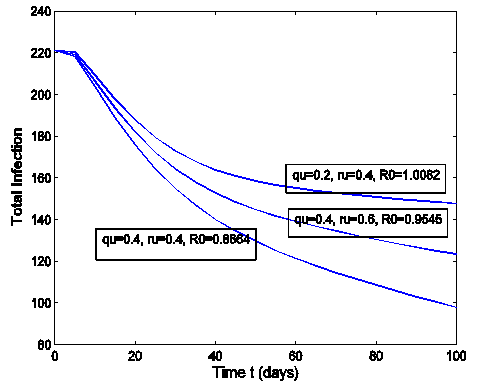
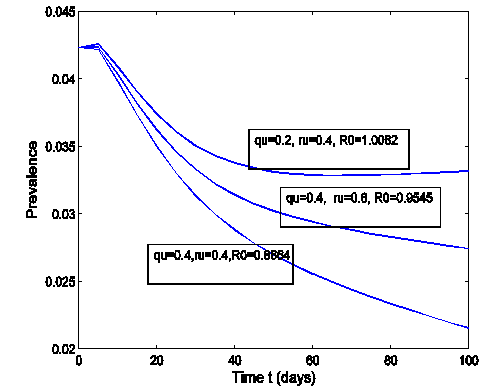
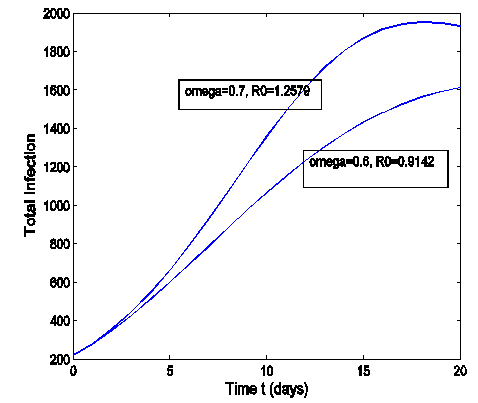
  , then the infected population as well as the disease prevalence increases, which also is expected.From figures (3) and (4), it is monitored that if we increase the value of
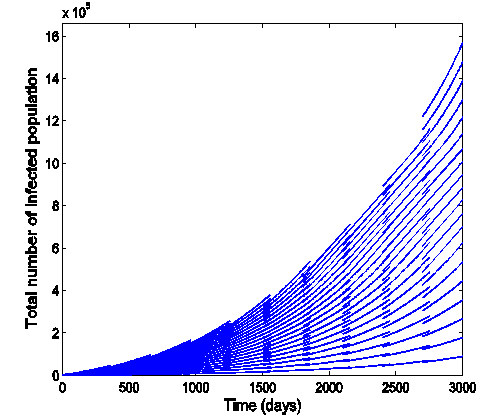
  , then the value of
  also increases. Hence the number of infected population also increases. Here
  is the modification parameter which indicates the infectiousness of the classes
  and
and  .Figure (5) (time series plot of co-infection) indicates that, the number of total infected population increases whenever
  Figure (6) (time series plot of co-infection) indicates that, the number of total infected population increases whenever
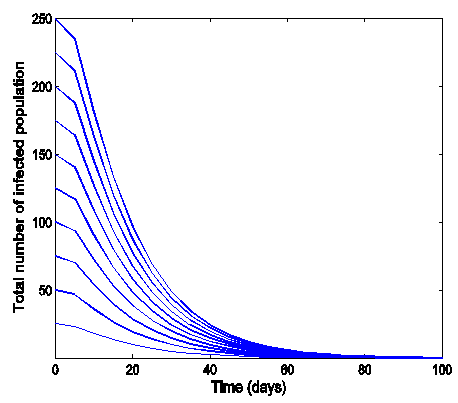
  .Figure (7) (time series plot of HIV-infection) indicates that, the number of total infected population decreases whenever
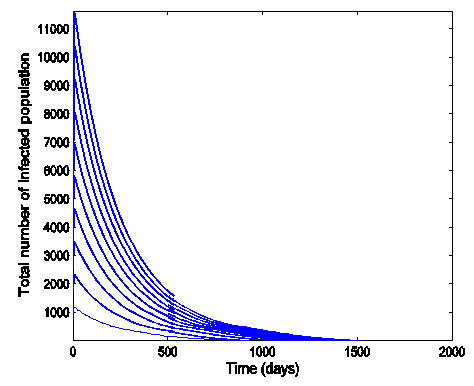
  and otherwise increases (Fig. 8).Figure (9) and Figure (10) (time series plot of HSV-2 infection) indicates that, the number of total infected population decreases whenever
  and increases whenever
 | Figure 1. Total infection for model (1) with different values of  and and  where where  |
 | Figure 2. The prevalence as a function of time for model (1) with different values of  and and  where where 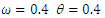 |
 | Figure 3. Total infection as a function of time for model (1) with different values of  where where  |
 | Figure 4. The prevalence as a function of time for model (1) with different values of  where where  |
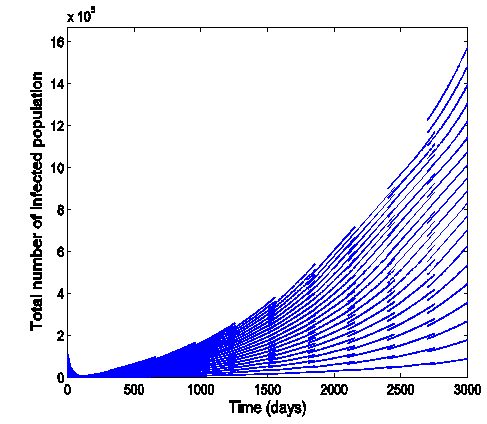 | Figure 5. Time series plot of the co infection for model (1) when R0 = 1.2499 |
 | Figure 6. Time series plot of co-infection for model (1) when R0 = 0.9750 |
 | Figure 7. Time series plot of HIV infection for model (1) when R0 = 0.9750 |
 | Figure 8. Time series plot of HIV infection for model (1) when R0 = 1.2499 |
 | Figure 9. Time series plot of HSV-2 infection for model (1) when R0 = 0.9750 |
 | Figure 10. Time series plot of HSV-2 infection for model (1) when R0 = 1.2499 |
8. Numerical Examples
- In this section we use model (1) to examine the impact that prevalence of HIV may have on HSV-2 dynamics and vice versa. We also present some numerical results on the stability of R0. The key parameters in the model are
 and
and  , which are the forward transmission rate from
  to
to  class of HSV-2 progression in individuals and the backward transmission rate from
  to
to  class of HSV-2 . It is mentioned that, if
  is bigger than
  , the infected population as well as the disease prevalence decreases. On the other hand, if
  is bigger than
  , then the infected population as well as the disease prevalence increases. This suggests that
  , and in some cases,
  . Our numerical studies indicate that only in certain cases, this factor may play an important role for explaining the effect of HSV-2 epidemics on the increased or decreased prevalence level of HIV. Numerical simulations suggest that the individual experiencing incident HSV-2 infections are at a high risk of HIV acquisition compared to the individuals who are not infected with HSV-2 or who have prevalent HSV-2 infection. Thus the numerical simulation suggests that the reduction of the effective contact rate of HSV-2 can reduce the disease burden of co-infection. After controlling the transfer rate from HIV class to the AIDS class disease elimination is feasible. Maintaining the transfer rate from the HSV-2 exposed class to the HSV-2 infected class disease control is also feasible.
8.1. Impact of Parameters on the Total Infection and Prevalence Level of Co-infection
- In many epidemiological models, the magnitude of the reproduction number is associated with the level of infection. The same is true in model (1). That is, the reproduction numbers for HSV-2 and HIV, R0 are directly related to the infection levels of the respective diseases. Such many literatures have been studies earlier [14, 15]. Thus, we consider the impact of HSV-2 on HIV by first examining the effect of R0 on the prevalence of diseases. Notice that R0 = max {R1, R2} are independent of the parameters,
 and
and  , the last two parameters indicates transfer rate between HIV and HSV-2 classes and modification parameter.
 9. Conclusions
- In summary, the main findings of this paper are itemized below:I. Reduction of the effective contact rate
 of HSV-2 can reduce the disease burden of co-infection.II. Controlling the transfer rate
  from HIV class to the AIDS class disease elimination is feasible.III. Controlling the transfer rate
  from the HSV-2 exposed class (E) to the HSV- 2 infected class (I) disease controls is feasible.
ACKNOWLEDGEMENTS
- U.S.B and C.N.P acknowledge, with thanks, the support in part of the University Grant Commission (UGC), Dhaka, Bangladesh.