Salah H. Abid , Heba A. Hassan
Mathematics department, Education College, Al-Mustansiriya University, Baghdad, Iraq
Correspondence to: Salah H. Abid , Mathematics department, Education College, Al-Mustansiriya University, Baghdad, Iraq.
| Email: |  |
Copyright © 2015 Scientific & Academic Publishing. All Rights Reserved.
Abstract
The marshall-olkin extended uniform (MOEU) distribution is introduced. The cumulative distribution function, Reliability function, hazard function and some of essential moments are derived. The MOEU stress-strength model R is obtained where the stress and the strength are independent MOEU distributions with different scale parameters and different shape parameters. Different methods to estimate R and MOEU distribution parameters are studied, maximum likelihood estimator, method of moments estimator, percentiles estimator, least squares estimator, weighted least squares estimator, L-moment estimator and regression estimator, An empirical study was conducted to support the theoretical aspect.
Keywords:
Marshall-Olkin extended Uniform, Reliability, Stress-strength, Percentiles estimators, L-moment estimators
Cite this paper: Salah H. Abid , Heba A. Hassan , The Marshall-Olkin Extended Uniform Stress-Strength Model, American Journal of Mathematics and Statistics, Vol. 5 No. 1, 2015, pp. 1-10. doi: 10.5923/j.ajms.20150501.01.
1. Introduction
Marshall and Olkin [7] introduced a new family of distributions in an attempt to add a parameter to a family of distributions. Let 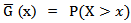 be the reliability function of a random variable X and
  be a parameter. Then
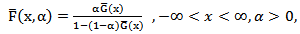 | (1) |
is a proper reliability function.  is called Marshall-Olkin family of distributions. The probability density function (p.d.f) corresponding to (1) is given by
 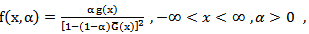 | (2) |
where  is the p.d.f. corresponding to
  . The hazard (failure) rate function is given by
 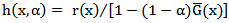 , where
 .similar models were considered, for example by Alice and Jose [1, 2].
  and
and  [8] discussed a new uniform AR(1) time series model.
2. Marshall-Olkin Extended Uniform (MOEU) Distribution and Properties
Let X follows distribution, where
  . Then
 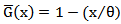 . Substituting in (1) we get a new distribution denoted by MOEU
  with reliability function [4].
 | (3) |
The corresponding pdf is obtained as | (4) |
The corresponding cumulative distribution function is,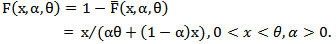 | (5) |
Note that  is the shape parameter and
  is the scale parameter of the distribution.The hazard rate function of a random variable X with MOEU
 distribution is
  | (6) |
2.1. The Moments of MOEU Distribution
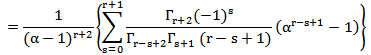
In this section we consider a random variable X with MOEU distribution. Let us first consider the higher-order moments. We have [4]
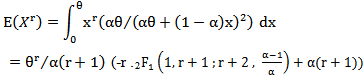 | (7) |
If r-s-1=0, then the corresponding term is 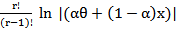 , where the hyper geometric Function is defined for |z|<1 by the power series 2
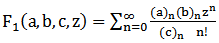 . It is undefined (or infinite) if c equals anon-positive integer. Here
  is the rising pochhammer symbol, which is defined by,
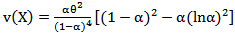
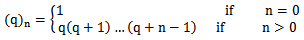 Specially, the mean and the variance of a random variable X with MOEU
 distribution are, respectively [4]
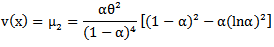
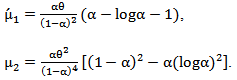 Another form of
  can be derived as follows
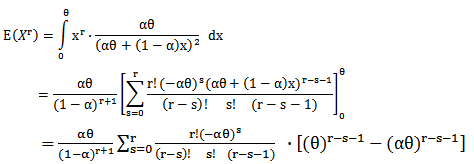 | (8) |
The coefficient of variation is,  | (9) |
And it depends only on parameter  .The
.The  quantile of a random variable X with MOEU
  distribution is given by
  | (10) |
The median can be derived as follows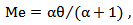 | (11) |
The mode can be derived as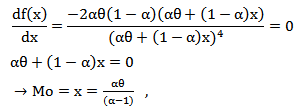 | (12) |
Also the skewness can be derived as follows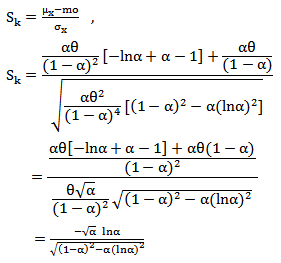 | (13) |
Or | (14) |
Another form of the skewness can be derived as follows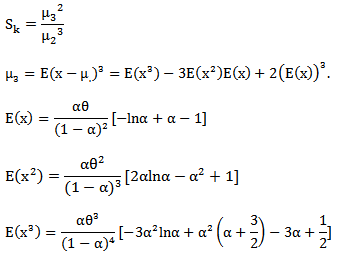
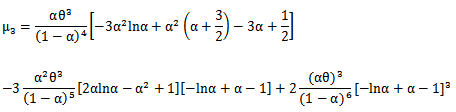
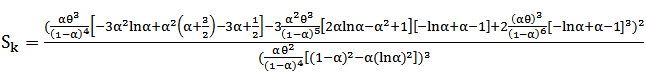 | (15) |
Where 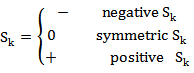 The kurtosis can be derived as
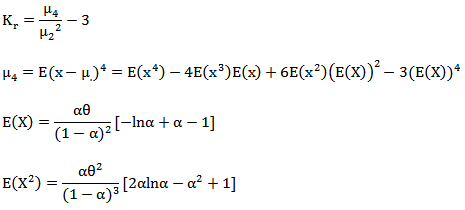
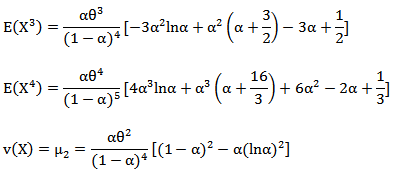
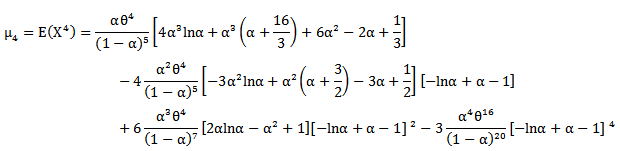
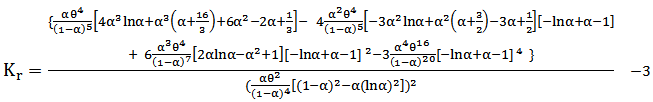 | (16) |
Where 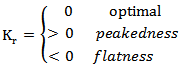
3. Stress Strength Reliability
Let X and Y be the Strength and the stress random variables, independent of each other, follow respectively 
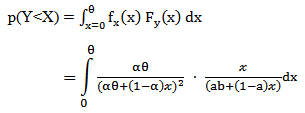 Now, let
 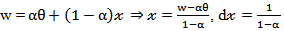 , then,
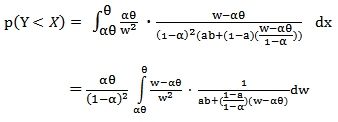 Now, Let
 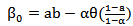 and
and  .So, we have actually,
 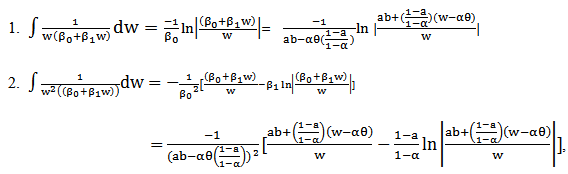 Then, for
  we have,
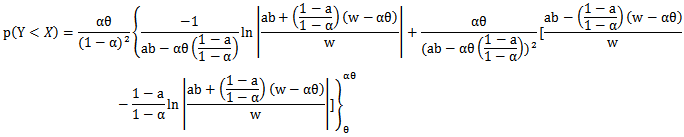
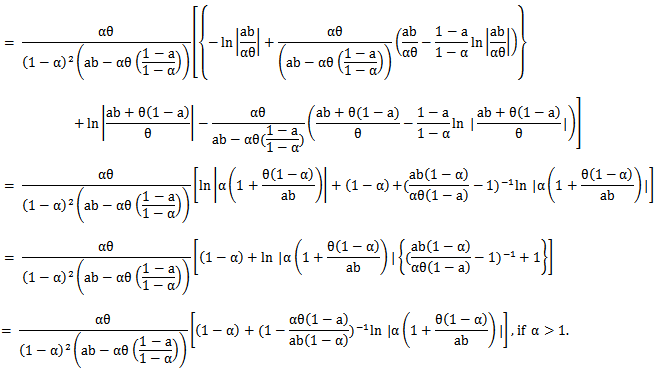 And for
  , we have
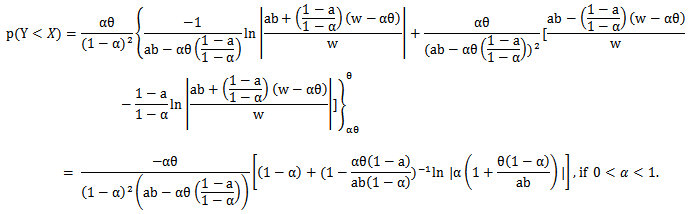
4. Parameters Estimation of MOEU Distribution
The main aim of this section is to study different estimators of the unknown parameters of MOEU distribution,1. The exact estimators of maximum likelihood (MLE)If  is a random sample from
  , then the likelihood and log likelihood functions are,
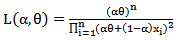 | (17) |
 | (18) |
Now, since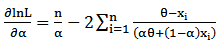 | (19) |
And an estimator of  is,
is,  | (20) |
Then the MLE of  (by using (19)) is,
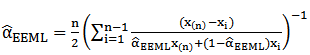 | (21) |
2. The exact estimators of moments method (EEMM)Here we provide the method of moments estimators of the parameters of a (MOEU) distribution when both are unknown. if X follows  , then,
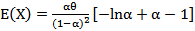 | (22) |
 | (23) |
And then the coefficient of variation is,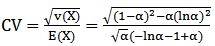 | (24) |
The  is independent of the scale parameter
  . Therefore equating the sample
  with the population
  , We obtain
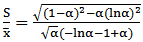 | (25) |
Where  We need to solve (25) to obtain the EEMM of
  , say
, say  . Once we estimate
  , we can use (22) to obtain the EEMM of
  . We need to use some iterative procedure to solve (25). So from (22) and the fact that
  one can get
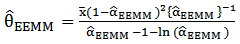 | (26) |
3. The approximate estimators of moments method (AEMM)If X follows  , then the median and mode of Xare, as in (11) and (12) respectively, now since,
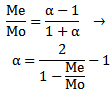 | (27) |
Is independent of the scale parameter  , then, after calculating the sample mode,
  and the sample median
  and substituting their values in (27), One can get the AEMM of
  , say,
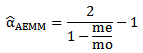 | (28) |
Once we estimate  , one can use (11) to obtain the AEMM of
  , as,
, as,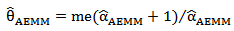 | (29) |
4. Estimators based on percentiles (PE)Kao in (1959) [5] originally explored this method by using the graphical approximation to the best linear unbiased estimators. The estimators can be obtained by fitting a straight line to the theoretical points obtained from the distribution function and the sample percentile points. In the case of a MOEU distribution, it is possible to use the same concept to obtain the estimators of  based on percentiles because of the structure of its distribution function. Since,
 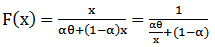 | (30) |
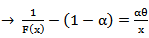 , then
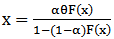 | (31) |
If  denotes some estimate of
  then the estimate of
  can be obtained by minimizing,
 | (32) |
With respect to  . Equation (32) is a nonlinear function of
  . It is possible to use some nonlinear regression techniques to estimate
  simultaneously. Actually,
  is the most used estimator of
  since it is equal to
  . We have also used this
  here. For some other choices of
  , see Mann, Schafer and singpurwalla (1974). [6]5. Least Squares Estimators (LSE)This method was originally suggested by swain, venkatraman and Wilson (1988) to estimate the parameters of beta distribution. [9], Suppose
  is a random sample of size n from a distribution function F (.) and suppose
  denotes the ordered sample. This method uses the distribution of
  . for a sample of size n, we have [9]
 and Cov
  for
for  So, one can obtain the LS estimators by minimizing,
  with respect to the unknown parameters. Therefore in the case of MOEU distribution, the least squares estimators of
  , Say
, Say  respectively, Can be obtained by minimizing,
 | (33) |
With respect to  .6. Weighted Least Squares Estimators (WLSE)The weighted least squares estimators of
  say
say  respectively, Can be obtained by minimizing,
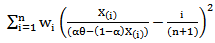 | (34) |
With respect to  , where,
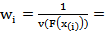
 .7. L – moment Estimators (LME)L– momentare expectations of certain linear combinations of order statistics. This method originally suggested by Hosking (1990) [3]. L–moment is similar to the method of moments in that we will be solving a system of equations whose order is equal to the number of parameters we are trying to estimate. However, the set of L–moments equations is instead defined as
 | (35) |
Where  is the cumulative distribution function of the density function
  , as we defined before, we will see this equal to an unbiased estimate of
  , which is defined as
 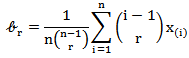 Where
Where 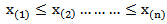 are the sorted values of the observations
  . Now, if X follows MOEU
  , then using (30) and (35) to write
 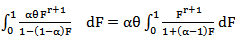 , since,
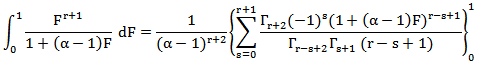
 Except where r-s+1=0, then the corresponding term in the square brackets is
 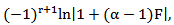 Also, one can get,
 | (36) |
 | (37) |
Since, 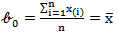 and
and 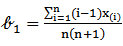 ,Then by equating
  with
with  and
and  with
with  , we obtained the LM estimators of
  as,
as,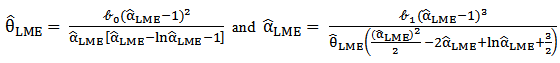 And then can get
  from observations numerically. 8. Regression Estimators (RE)Let
  be a random sample from MOEU
  . Since
 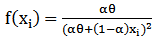 , then
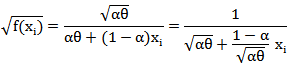
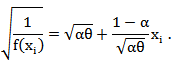 Where
Where 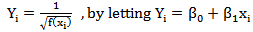 with
with 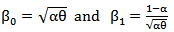 . And adding independent identically distributed (iid) random error (noise)
  then,
then,
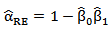 | (38) |
 | (39) |
5. The Empirical Study and Discussions
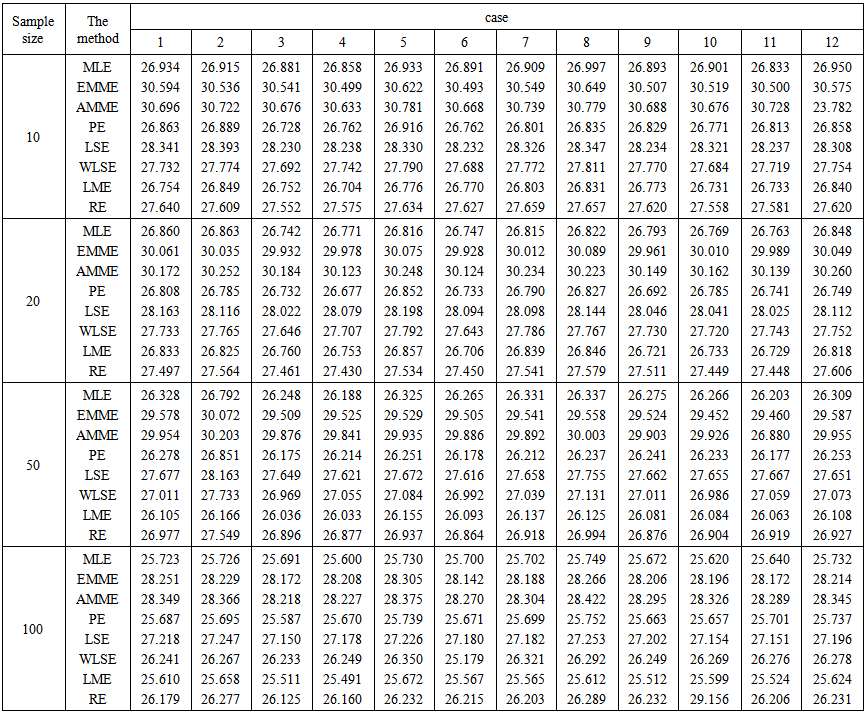
We conduct extensive simulations to compare the performances of the different methods, stated in section 4, mainly with respect to their mean square errors (MSE) for different sample sizes and for different parameters values.Actually, there are two essential experiments, the first one was to explore the best method(s) to estimate parameters of MOEU distribution, while the second experiment is to explore the best method (s) to estimate  which is defined in section(3).The experiments were conducted according to run size
  . We reported the results for
  (small sample),
  (moderate sample) and
  (large sample) and for,
1. The following different values of α and θ in the first experiment,
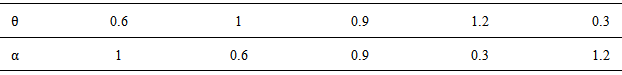 |
| |
|
2. The following different values of b, a, α and θ in the second experiments,
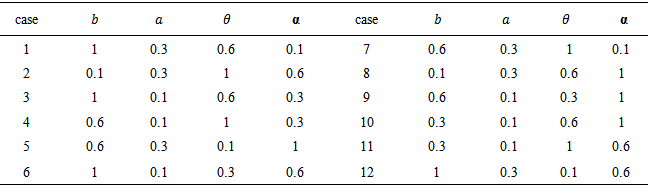 |
| |
|
Note that, for the second experiment, m=n, where m and n are the sample sizes drawn from stress and strength variables respectively. The results of the first experiment and the second experiment are reported in table (1) and table (2) respectively. Some of common points are very clear from tables for both of the two experiments,1) The MSE's decrease as sample size increases in all methods of estimation. It verifies the asymptotic unbiasedness and consistency of all the estimators.2) It can be said that the estimation of shape parameters are more accurate for the smaller values of those parameters whereas the estimation of scale parameters are more accurate for the larger values of those parameters. in other words, MSE's increase as shape parameter increases whereas MSE's increase as scale parameter decreases.3) The performances of RE, WLSE, LSE, EMME and AMME are according to their order.4) The performances of RE's and WLSE’s are close to each other. Also, the performances of EMME's and AMME’s are close to each other.For more detailed discussions, let us do that for each experiment, a) For the first experiment,For comparing the performances of all the eight methods under consideration to estimate the Parameters of MOEU distribution, the following points can be mentioned, i) in the cases of small (n=10) and moderate (n=20) sample sizes, for both scale and shape parameters, there is a clear superiority to PE method in comparative with MLE and MME methods, although in rare sometimes the Preference is alternated among three methods. actually, in most of cases, the results of three methods were closed to each others.ii) in the cases of large sample sizes (n=50,100), there is a clear superiority to PE method in comparative with MLE and LME methods to estimate the shape parameter, while the superiority was to MLE method in comparative with PE and LME methods to estimate the scale parameter.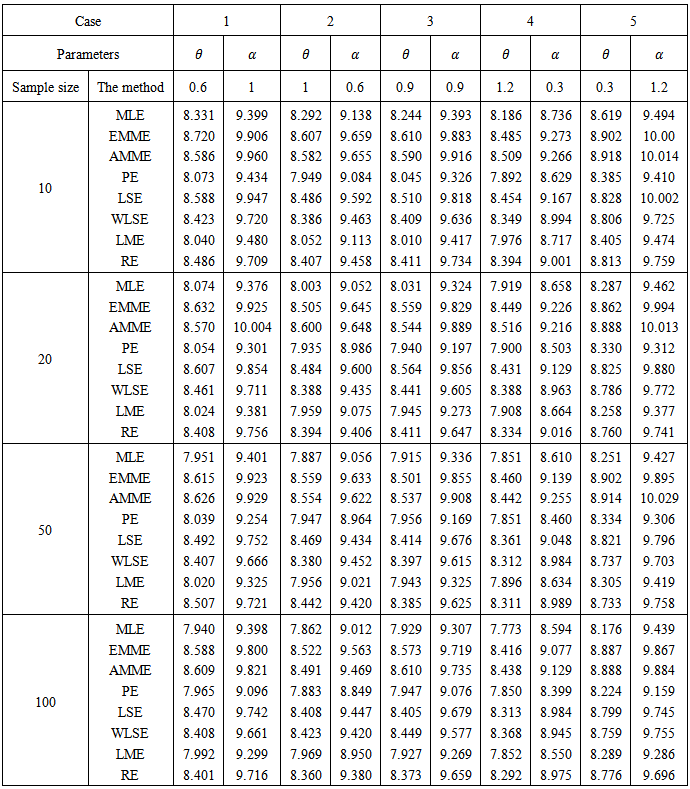 | Table 1. Empirical MSE to Estimate the MOEU Distribution Parameters  and and  |
b) For the second experimentb.1) the behavior effect of the shape and scale parameters is very clear on the results, as it stated in (2) of common points above. The results were amazing, since MSE's increase as the cases order increases as in the following table,
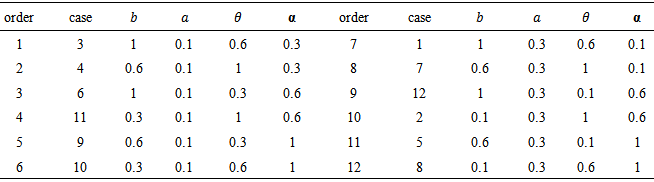 |
| |
|
 | Table 2. Empirical MSE to Estimate R = P(X<Y) for the MOEU Stress-Strength Model |
b.2) for comparing the performances of all the eight methods under consideration to estimate  , the following points can be mentioned,i) For small (n=10) sample size, it is observed that LME works the best for all cases. The performances of the PE's and MLE’s, respectively, are quite close to that of LME's. ii) For moderate (n=20) sample size, it is observed that PE works the best from all other Methods whereas the second and third best method are respectively, LME and MLE. The performances of MLE's and LME’s are close to each other.iii) For large (n=50, 100) sample size, it is observed that LME works the best from all other Methods whereas the second and third best method are respectively, PE and MLE. The performances of PE's and MLE’s are close to each other.
References
| [1] | Alice, T., Jose, K.K., Marshall- Olkin Pareto Processes, Far East Journal of Theoretical Statistics, (2003), 9(2), 117-132. |
| [2] | Alice, T., Jose, K.K., Marshall-Olkin logistic processes, STARS Int Journal, (2005),6, 1, 1-11. |
| [3] | Hosking, J. R. M., L-Moment: Analysis and estimation of distributions using linear combinations of order statistics. Journal of Royal Statistical Society, Ser. B, (1990), 52(1), 105 - 124. |
| [4] | Jose, K. and Krishna, E., Marshall-Olkin Extended Uniform Distribution., ProbStat Forum, (2011), Volume 04, October 2011, Pages 78-88. |
| [5] | Kao, J. H. K., A graphical estimation of mixed Weibull parameters in life testing electron tubes. , Technometrics, (1959) 1, 389 - 407. |
| [6] | Mann, N. R., Schafer, R. E. and Singpurwalla, N. D., Methods for Statistical Analysis of Reliability and Life Data. , New York, Wiley, (1974). |
| [7] | Marshall, A.W., Olkin, I., A new method for adding a parameter to a family of distributions with applications to the exponential and Weibull families. Biometrika, (1997), 84, 641-652. |
| [8] | Ristic, M., Popovic, _C., A new Uniform AR(1) time series Model (NUAR(1)). Publications De Linstitut Mathe_ amatique Nouvelle serie, (2000), 68(82), 145-152. |
| [9] | Swain, J., Venkatraman, S. and Wilson, J., Least squares estimation of distribution function in Johnson's translation system., Journal of Statistical Computation and Simulation, (1988), 29, 271 - 297. |
 Abstract
 Reference
 Full-Text PDF
 Full-text HTML