Joginder1, Akash Varshney1, Lalit Kumar1, S. C. Malik2
1Department of Statistics, Sri Venkateswara College, University of Delhi, Delhi, India
2Department of Statistics, M.D. University, Rohtak-124001, Haryana, India
Correspondence to: Joginder, Department of Statistics, Sri Venkateswara College, University of Delhi, Delhi, India.
| Email: |  |
Copyright © 2014 Scientific & Academic Publishing. All Rights Reserved.
Abstract
A single unit system has been analyzed stochastically in detail considering different repair policies. The system may fail completely either directly from normal mode or via partial failure. There is a single server who visits the system immediately and is subjected to failure while performing jobs. Repair of the system is done at its partial and complete failures. The system has been analyzed under two different inspection policies. In model1st, inspection of the unit is done at partial failure to see the feasibility of repair while in 2nd model; inspection is carried out at both partial and complete failure stages. The unit is replaced by new one if inspection reveals that repair of the unit is not feasible to the system. An expert person (may be a medical doctor) is called immediately for giving treatment to the failed server. The server is curable and resumes the job after getting treatment. All random variables are statistically independent. The distributions of failure time of the server and unit follow negative exponential while that of inspection; repair and treatment times are taken as arbitrary with different probability density functions. The comparative study of mean time to system failure (MTSF) and availability of both models have been made graphically with respect to treatment rate for fixed values of other parameters.
Keywords:
Single Unit System, Feasibility of Repair, Server Failure, Treatment, Inspection, Reliability Measures and Comparative Analysis
Cite this paper: Joginder, Akash Varshney, Lalit Kumar, S. C. Malik, Comparison of Reliability Measures of a System under Different Failure and Repair Policies, American Journal of Mathematics and Statistics, Vol. 4 No. 4, 2014, pp. 179-185. doi: 10.5923/j.ajms.20140404.01.
1. Introduction
No doubt that redundancy technique has been considered as one of the effective strategy to improve performance of repairable systems. But there are many systems in which redundancy cannot be provided either may because of high cost of the spare or due to complexity of the structure. Therefore, stochastic models of single -unit systems with different failure modes have been proposed and examined by the researchers including Malik and Bansal (2005), Chander (2007) and Malik (2008) keeping in view of their practical utility and common man’s affordability. In most of these models, it is assumed that the repair facility neither fails nor deteriorates. In fact, this assumption becomes unrealistic whenever service facility meets with an accident may because of one or more reasons such as mishandling of the system, carelessness on the part of the server and poor judgment skills of the server. And, in such a situation, the server may resume the job after taking some treatments. There are many systems in which repair of the unit at different levels of damages may or may not be possible which can be revealed by inspection. The system of an electric transformer can be cited as a good example of such type of systems. The repair of the electric transformer at its partial and complete failure is not possible respectively due to the damage of cooling fans of auxiliary system and due to excessive mechanical stresses like short circuit. In such situations transformer may be replaced by new one to enhance its capacity. Dhankar and Malik (2011, 2013) and Dhankar at al. (2012) investigated single unit reliability models with server failure and inspection to see the feasibility of repair at different failure stages.By considering all these facts, the present study is devoted to the comparative analysis of some reliability measures of a single-unit system under different repair policies and server failure. Two reliability models are developed for the system. The system may fail completely either directly from normal mode or via partial failure. The unit is repaired both at its partial and complete failure by a server who visits the system immediately whenever needed. In model 1st, inspection of the unit is done at partial failure to see the feasibility of repair while in model 2nd, inspection is carried out at both partial and complete failure stages. The unit is replaced by new one if inspection reveals that repair of the unit is not feasible to the system. The server is subjected to failure while performing jobs. An expert person (may be a medical doctor) is called immediately for giving treatment to the server. The server is curable and resumes the job after getting treatment. All random variables are statistically independent. The distributions of failure time of the unit and server follow negative exponential while that of inspection, repair and treatment times are taken as arbitrary with different probability density functions. Various reliability characteristics such as mean sojourn times, mean time to system failure (MTSF) and availability are evaluated for both models in steady state using semi-Markov process and regenerative point technique. The graphical behaviour of the differences of MTSF and availability of the models has been shown for a particular case.
2. Notations
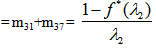
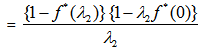
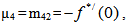
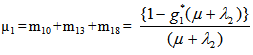
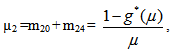
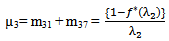
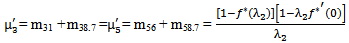
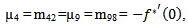
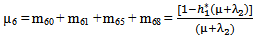
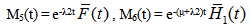
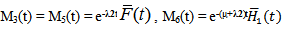
E: regenerative states.O: The unit is operative and in normal mode.SG: The server is good.λ / λ1 /λ2: Constant failure rate of the unit from normal mode tocomplete failure / normal mode to partial failure / partial failure mode to complete failure.PUi / PUr / PWi / PWr: The unit is partially failed and under inspection /under repair / waiting for inspection / waiting for repair.FUi / FUr / FWi /FWr: The unit is completely failed and under inspection / under repair / waiting for inspection / waiting for repair.SFUt / SFUT: The server is failed and under treatment / under treatment continuously from previous state.µ: Constant failure rate of the server.p / q: Probability that repair of the unit at partial failure is not feasible / feasible.m / n: Probability that repair of the unit at complete failure is not feasible / feasible.g(t) / G(t) / g1(t) / G1(t): pdf / cdf of repair time of the completely failed unit and partially failed unit. f(t) / F(t): pdf / cdf of treatment time of the server.h1(t) / H1(t): pdf / cdf of inspection time of the unit at partial failure.k(t) / K(t): pdf / cdf of inspection time of the unit at completefailure.qij(t)/ Qij(t): pdf and cdf of direct transition time from a regenerative state i to a regenerative state j without visiting any other regenerative state.qij.k(t) / Qij.k(t): pdf and cdf of first passage time from a regenerative state i to a regenerative state j or to a failed state j visiting state k once in (0,t].Mi(t): Probability that the system is up initially in state Si∈E is up at time t without visiting to any other regenerative state.Wi(t): Probability that the server is busy in state Si up to time t without making transition to any other regenerative state or returning to the same via one or more non regenerative states.mi: Contribution to mean sojourn time in state Si when system transits directly to state Sj (Si ,Sj∈E ) so that µi= where mij =
  = -qij*/(0) and µiis the mean sojourn time in state Si ∈ E(s) / ©: Symbol for Stieltjes convolution / Laplace convolution. ~ / *: Symbol for Laplace Stieltjes Transform (LST) / Laplace Transform (LT).The state transition diagrams for both models are shown respectively in figures 1 and 2.Model 1
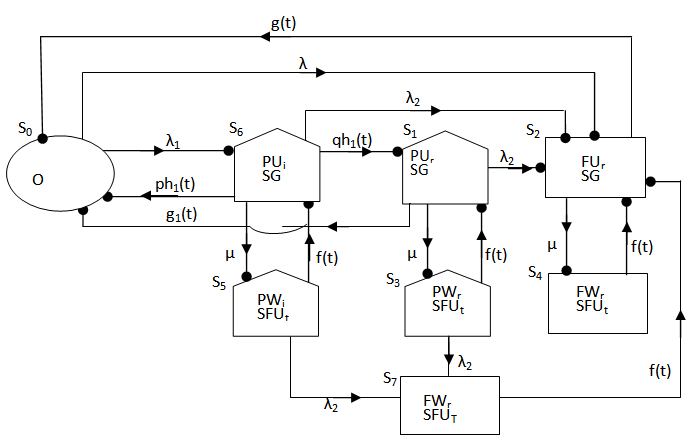 | Figure 1. |
Model 2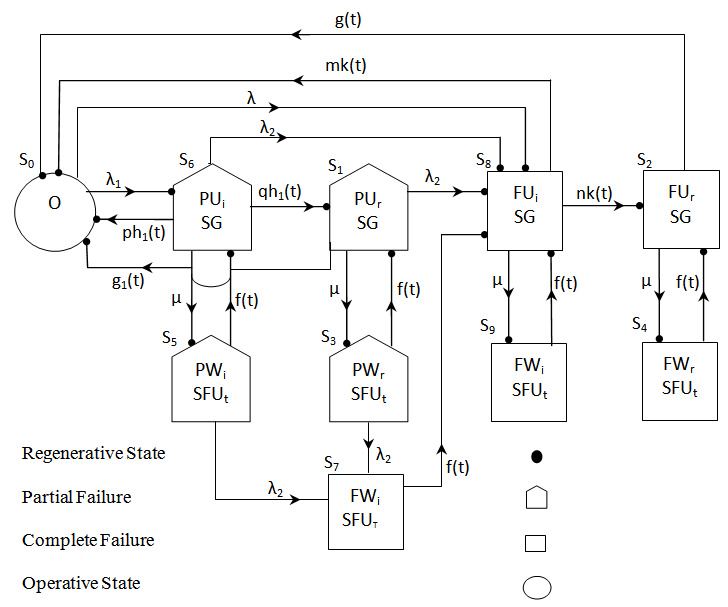 | Figure 2. |
3. Transition Probabilities and Mean Sojourn Times
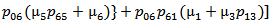
Simple probabilistic considerations yield the following expressions for the non-zero elements: asFor Model 1:
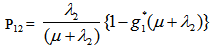
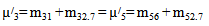
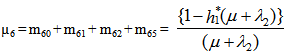
 It can be easily verified that p02 + p06 = p10 + p12 + p13 = p20+ p24 = p31 + p32.7 = p42 = p56 + p52.7 = 1Mean Sojourn times are:
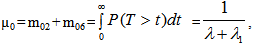
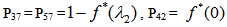
 For Model 2:

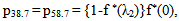
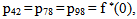
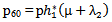
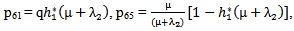
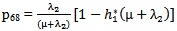
 It can be easily verified that p06 + p08 = p10 + p13+ p18 = p20 + p24 = p31+ p38.7 = p42 = p56 + p58.7 = p60+ p61 + p65 + p68 = p80+ p82+ p89 = p98 = 1Mean Sojourn times are:
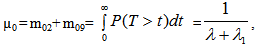
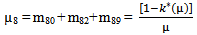
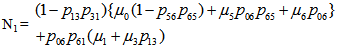
4. Reliability and Mean Time to System Failure (MTSF)
Let  be the cdf of the first passage time from regenerative state Si to a failed state. Regarding the failed state as absorbing state, we have the following recursive relations for
  :For Model 1:
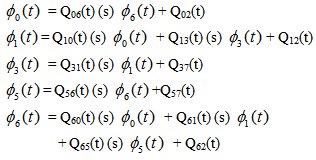 | (1) |
Taking LST of above relations (1) and solving for , we have
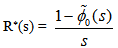 | (2) |
The reliability R(t) of the system model can be obtained by taking Inverse Laplace transform of (2). The mean time to system failure is given by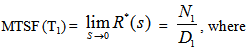 | (3) |
 For Model 2:
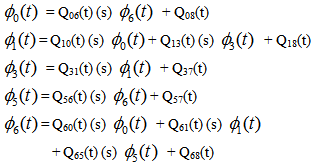 | (4) |
Taking LST of above relations (4) and solving for . Using this, we have
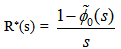 | (5) |
The reliability R(t) of the system model can be obtained by taking Inverse Laplace transform of (5). The mean time to system failure is given by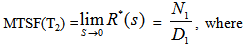 | (6) |


5. Steady State Availability
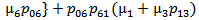
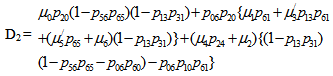
Let Ai(t) be the probability that the system is in upstate at instant t given that the system entered regenerative state Si at t = 0. The recursive relations for Ai(t) are as follows:For Model 1: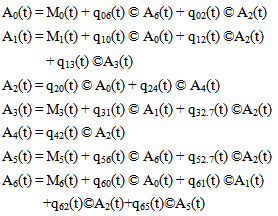 | (7) |
where,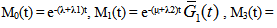
 Now taking LT of relations (7) and obtain the value of A0*(s). By using this, the steady state availability is given by
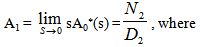 | (8) |
 For Model 2:
 | (9) |
where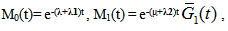
 Now taking LT of relations (9) and obtain the value of A0*(s). By using this, the steady state availability is given as
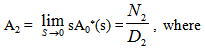 | (10) |


6. Comparative Study
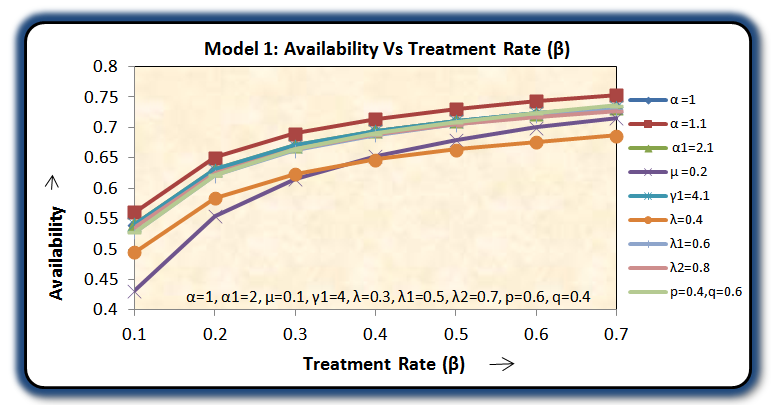
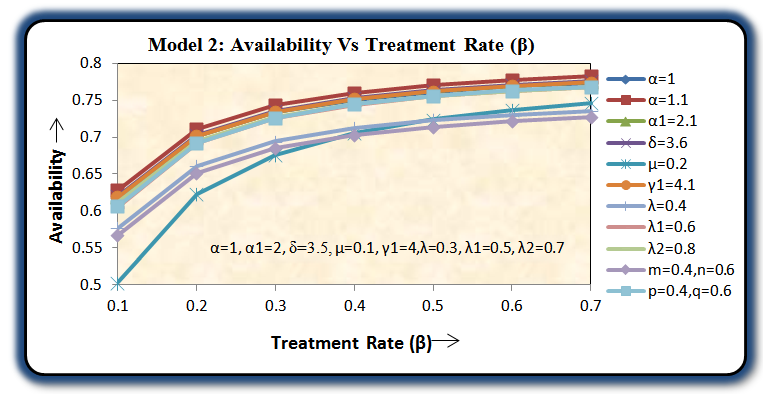
For a particular case g(t) = α e-αt, g1(t) =α1e-α1t, f(t) = β e-βt, h1(t) = γ1e-γ1t and k(t) = δ e-δt, various graphs are drawn respectively in figures 3, 4, 5 and 6.
6.1. Comparison of MTSF
The mean time to system failure (MTSF) of the model 1 and 2 is same as shown in figure 3.
6.2. Comparison of Availability
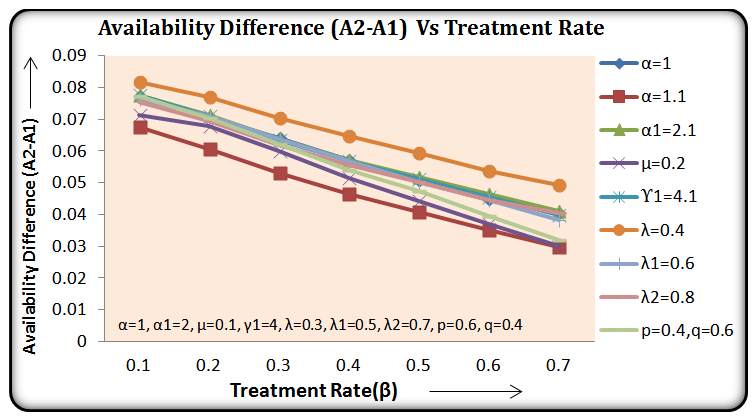
Availability of the model 2 is always more than that of the model 1 as shown in figure 6.Hence we conclude that the concept of inspection for replacement of the unit immediately by new one at its two stages of failure – partial and complete is more beneficial over the concept of inspection for replacement of the unit at its partial failure if preference is given to the replacement of the units over repair.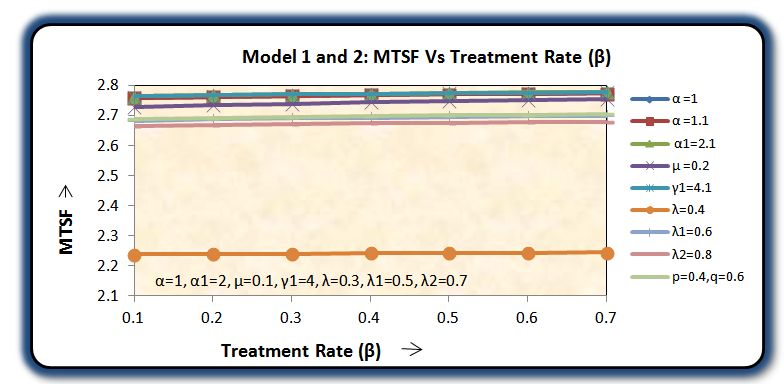 | Figure 3. |
 | Figure 4. |
 | Figure 5. |
 | Figure 6. |
References
| [1] | Malik, S.C. and Bansal, R.K. (2005): Profit Analysis of Single-Unit Reliability Models with Repair at Different Failure Modes. Proc. International Conference on Reliability and Safety Engineering, IIT Kharagpur (India), pp. 577-588. |
| [2] | Chander, S. (2007): Profit Analysis of Reliability Models with Priority in Operation as well as in Repair. Statistical Techniques in Life Testing, Reliability, Sampling theory and Quality Control, Narosa Publishing House, New Delhi, pp.153-162. |
| [3] | Malik, S.C. (2008): Reliability Modeling and Profit Analysis of a Single-Unit System with Inspection by a Server who Appears and Disappears Randomly. Journal of Pure and Applied Mathematika Sciences, Vol.LXVII(1-2), pp. 135-146. |
| [4] | Dhankar, A.K. and Malik, S.C. (2011): Cost- Benefit Analysis of System Reliability Models with Server Failure During Inspection and Repair. International Journal of Statistics & Analysis, Vol.1(3), pp. 265-278. |
| [5] | Dhankar, A.K., Malik, S.C. and Kumar, A. (2012): Cost-Benefit Analysis of a System with Server Failure and Replacement of the Unit at Different Failure Modes Subject to Inspection. International Journal of Computer Applications, Vol.47 (1), pp. 27-33. |
| [6] | Dhankar, A.K., Malik, S.C. (2013): Reliability Modeling and Cost-Analysis of a System with Replacement of the Server and Unit subject to Inspection. Journal of Statistics and Management Systems, Vol. 16, No. 2&3, pp. 137-162. |
 Abstract
 Reference
 Full-Text PDF
 Full-text HTML