-
Paper Information
- Paper Submission
-
Journal Information
- About This Journal
- Editorial Board
- Current Issue
- Archive
- Author Guidelines
- Contact Us
American Journal of Mathematics and Statistics
p-ISSN: 2162-948X e-ISSN: 2162-8475
2014; 4(3): 171-177
doi:10.5923/j.ajms.20140403.06
A Probability Model for Estimating the Force of Transmission of HIV Infection and Its Application
 Abstract
 Reference
 Full-Text PDF
 Full-text HTML
Mariamma Thomas1, Damodar Sahu1, Yujwal Raj2, Arvind Pandey1
1National Institute of Medical Statistics, Ansari Nagar, New Delhi, 110029, India
2Department of AIDS Control, National AIDS Control Organization, New Delhi, 110001, India
Correspondence to: Damodar Sahu, National Institute of Medical Statistics, Ansari Nagar, New Delhi, 110029, India.
| Email: |  |
Copyright © 2014 Scientific & Academic Publishing. All Rights Reserved.
Information on force of transmission of HIV infection is crucial for better understanding of the epidemic. It is useful for better programme planning and evaluation. The current study aims at fitting probabilistic models for estimating the force of transmission of HIV infection due to different risk behaviour, heterosexual/homosexual/IDUs. The force of transmission between the risk groups bridging the infection is obtained as the joint probability function of the growth probabilities of HIV positivity over time among them. The growth probabilities of HIV positivity is estimated by fitting appropriate probability distributions to observed data from HIV Sentinel Surveillance (HSS) in Andhra Pradesh, India. The joint probabilities are estimated assuming that the risk behavior among the groups is random and the growth of infection within each group is independent in a region. In the study population, the average force of transmission is estimated to be 3.4755E-09 among general population, 1.5508E-03 among MSMs and 4.8455E-03 among IDUs, and 2.132E-03 in the total population. The results are subsequently used to estimate the HIV burden and compared with the estimates derived by other approaches.
Keywords: Force of transmission, Distribution of incubation period, High risk behavior groups (HRGs), Men having sex with men (MSM), Injecting drug users (IDUs), Female sex workers (FSWs)
Cite this paper: Mariamma Thomas, Damodar Sahu, Yujwal Raj, Arvind Pandey, A Probability Model for Estimating the Force of Transmission of HIV Infection and Its Application, American Journal of Mathematics and Statistics, Vol. 4 No. 3, 2014, pp. 171-177. doi: 10.5923/j.ajms.20140403.06.
Article Outline
1. Introduction
- Information on the force of transmission of any infectious disease is important information for understanding and controlling the epidemic. In case of HIV/AIDS epidemic, the forces of transmission among the risk groups that bridge the infection are useful in understanding the risk behavior. Further, the knowledge of the force of transmission over time enables direct estimation of HIV/AIDS burden and other related parameters such as incidence, ART needs and AIDS related mortality. In the past, a number of models have been propounded to describe the complex phenomena of the human immunodeficiency virus/acquired immuno-deficiency syndrome (HIV/AIDS) [1, 2, 3]. These models under various assumptions illustrate possible epidemic process due to varying parametric conditions. The models on distribution of incubation period and its use for back projections [4, 5, 6] and regression analysis for understanding the process of AIDS spread and disease progression [7, 8] etc., are a few models to mention. In this article, an attempt has been made to estimate the force of transmission of HIV infection in a population by estimating the growth probability of HIV positivity rates observed among different risk groups over time and deriving the interaction probabilities between risk groups that transmit the infection.The article aims at developing a simple probability model to estimate the growth probabilities of HIV positivity in different risk groups over time. It also emphasizes the application of models for estimating the force of transmission of HIV infection among heterosexual high risk behavior groups and within homosexuals and injecting drug users (IDUs). It is assumed that the risk behavior between heterosexual groups and within homosexuals and IDUs are random and the growth of infection among each risk group is independent of each other in any region. The new HIV infections over time are estimated by applying the aggregate force of transmission to the adult (age above 15 years) population. The number of new infections developing to AIDS each year is estimated by applying the Weibull incubation time probabilities to develop AIDS since infection. In this process we get an estimate of new infections in the form of number developed to AIDS and that remaining as HIV in the following years. The multiple decrement life table framework is used to derive the annual cumulative number of cases developing AIDS and that remaining as HIV. The exercise has been done for one state, Andhra Pradesh in India.
2. Data and Methodology
2.1. Data
- The HIV infection is transmitted between the high risk behaviour population, i.e., (i) female sex workers (FSWs) and their clients (regular /casual) (ii) intravenous drug users (IDUs) and (iii) men having sex with men (MSMs). The path diagram explaining the transmission dynamics is presented in Figure 1.
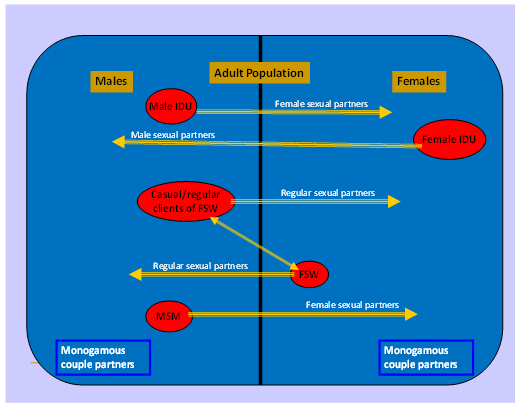 | Figure 1. HIV transmission dynamics |
2.2. Methodology
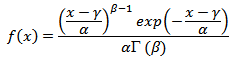
- Fitting of an appropriate probability distribution over time of the HIV positivity rate for each risk group is expected to provide growth probabilities of HIV infection among them. The force of transmission of HIV infection over time between two risk groups bridging the infection is thought of a function of the growth probabilities (joint probability function) of infection among the two groups.We consider the following three models to study growth probabilities of HIV infection in different risk groups:(i) Weibull DistributionThe general form of Weibull distribution [10, 11] with three parameters is given by,
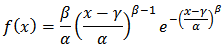 where β = shape parameter; α = scale parameter and γ = location parameter. Since the HIV positivity rate before the start of the epidemic was zero, the location parameter in the above model could be set at zero. If the location parameter γ is set to zero as the time when HIV infection initiated in the population is considered zero. Then the two parameter Weibull distribution becomes:
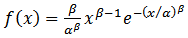 | (1) |
 where β = shape parameter; α = scale parameter and γ = location parameter. As explained above, if the location parameter is set to zero, the two parameter Gamma distribution function becomes:
 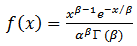 | (2) |
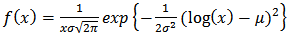 | (3) |
 are the population parameters of the model.
2.2.1. Estimation of Parameters and Fitting of Models
- Setting the initial year of infection in India as 1985 (in view of the fact that the first case of HIV positive in India was detected in 1986), the parameters of the models are estimated by the method of moments. With these estimates of parameters, the growth probability curves for each risk group are plotted using the aforesaid three models as presented in Figure 2.
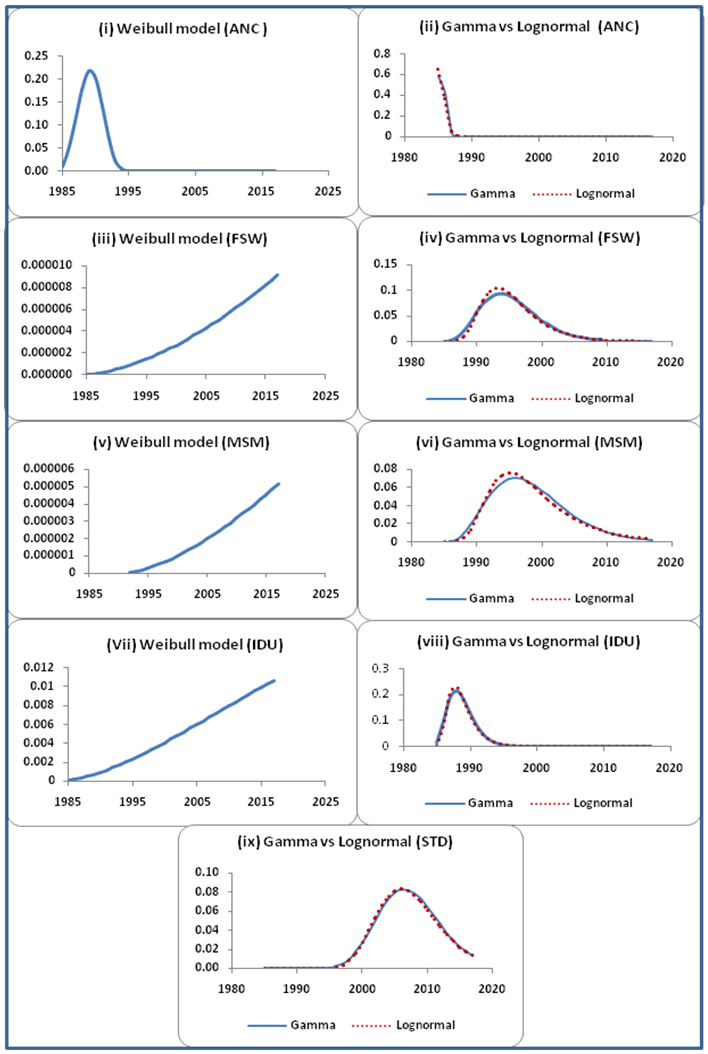 | Figure 2. Growth probability curves of HIV infection among different risk groups by three models |
2.2.2. Estimation of Transmission Probabilities
- The transmission probabilities of HIV infection over time between risk groups that bridge the population has been estimated as the joint probabilities of the growth probabilities among the respective risk groups over time under the following assumptions.(i) The HIV infection is transmitted through high risk behaviour – sexual/ intravenous drug use. (ii) The groups are mixing randomly in the total population.(iii) Growth of infection among each risk group in a region is independent.(iv) The HIV epidemic curves gradually rise to the peak, stays stable for some time and slowly declines. The transmission probabilities due to heterosexual risk behaviour have been derived as the product of the growth probabilities of infection among STI patients, FSWs and ANC women. Similarly, under the assumption that the risk behavior among MSMs and the needle exchange among IDUs are random, the transmission probabilities due to respective risk behaviour are derived as the product of the growth probabilities of infection within them over time. The three transmission probabilities are thereafter aggregated to obtain the force of transmission in the total population over time as presented in Figure 3.
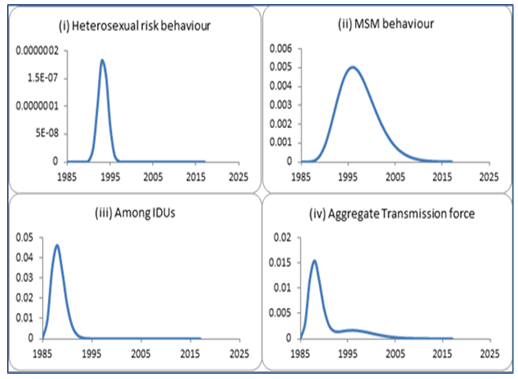 | Figure 3. Force of transmission of HIV infection in Andhra Pradesh due to different risk behaviour |
2.2.3. Estimation of HIV Burden
- The estimated force of transmission over time on the adult population is then used to derive the annual number of new infections. Other epidemiological parameters of HIV burden, like number of people living with HIV (PLHIV), need for antiretroviral treatment (ART) and number of HIV related deaths are also derived as illustrated fellows. Estimation of New InfectionsThe number of persons contracting HIV infection in each year from initial year of the epidemic t0 to tn, a specified future time is estimated by applying the force of transmission λ0 to λn to adult population (age 15 and above) exposed to risk. The population at risk, Rt at time t is taken from the Spectrum population projection, the data used for HIV estimation in India [12]. The initial year t0 is considered to be 1985 as the first case of HIV infection in India was detected in 1986. The steps for estimation of new infections are as follow:LetPt = P0, P1, P2, …, Pn the adult population at time t, t = 0 represents 1985.λt = λ0, λ1, λ2, …, λn the force of transmission of HIV infection at time t.Ptr = Pt – Pt-1 the new population entering to risk at time t. Dt = D0, D1, D2, …, Dn the proportion of adult deaths at time t.Rt = Rt-1 – Nt + Ptr the population exposed to risk at time t; where R0 = P0 and Nt is as given below.Nt = (Rt-1 – Rt-1Di-1) λi-1 the new infections in the beginning of time t out of Ri-1 exposed to risk.Estimation of PLHIV and ART needsAn HIV infected individual needs treatment when the disease progress to AIDS, i.e., when the CD4 counts reduce to 350 or less [13]. In order to estimate the ART needs the Weibull model for the incubation time distribution (time to develop AIDS) is applied to the estimated new infections over time. The median duration (8 years) and the shape (2.415) of the incubation period distribution is taken as the same as that considered by the spectrum model used globally for HIV estimation. The scale parameter is estimated using moment method. The incubation time distribution for progression to need for treatment since initial infection is presented in Figure 4.
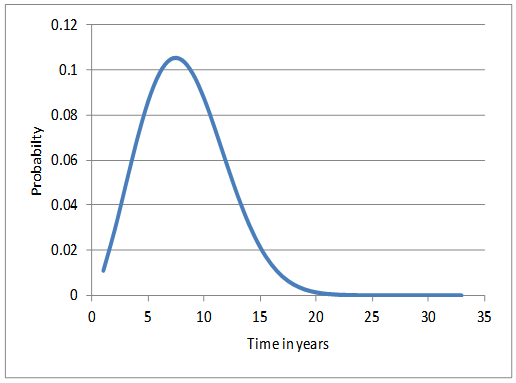 | Figure 4. Weibull probability curve for time to ART needs |
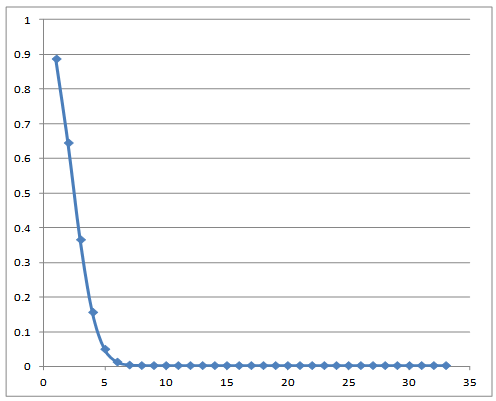 | Figure 5. Weibull survival probabilities of AIDS cases |
3. Results and Discussion
- The model based estimates of the force of transmission of HIV infection among different risk groups and at the aggregate level has been derived in the state of Andhra Pradesh, India. The force of transmission is estimated as the joint probability of the growth probabilities of HIV positivity in the risk groups that bridge the infection. The growth probabilities of HIV infection in different risk groups are estimated from a probability model fitted on respective HIV positivity data. Three probability models (Weibull, Gamma and Lognormal) have been fitted over the five risk groups viz, STI patients, FSWs, MSMs, IDUs and ANC women. While the Lognormal curve has been selected for all four high risk groups, viz. STI patients, FSW, MSM and IDU, the Weibull model is found epidemiologically plausible for the ANC group. The growth curves depict that the epidemic started rising in the early stage of the epidemic (1985-87) in the risk groups FSW, MSM, IDU, and ANC. However, in the STI group it started rising only around 1995. The curve reached the peak only in 2006 for STI group for others the peak was during 1989-95 (ANC-89, IDU-90, FSW-93, and MSM-95).While the curve for the force of HIV transmission among IDUs and MSMs started rising as early as in 1986 and 1989, it started rising in the general population due to heterosexual risk only in 1990.The average force of transmission in the general population due to heterosexual risk behaviour in the state is estimated to be 3.4755E-09 and the same among MSMs and IDUs are 1.5508E-03 and 4.8455E-03 respectively. The average force of transmission in the population of Andhra Pradesh is estimated to be at 2.132E-03.The force of transmission due to heterosexual risk in the population stated above includes the transmission among high risk behaviour population and their partners who are otherwise at low risk. In order to understand the programmatic relevance of heterosexual high risk behaviour, this parameter is further disaggregated to obtain a rough estimate of the force of transmission between FSWs and their clients. The mean force of transmission due to heterosexual high risk behaviour is estimated at 3.2072E-04. However, this is only a rough estimate as the STI patents may include homosexuals too.The aggregate force of transmission in the total population over time is further used to estimate the HIV burden. The results for the years 2007-11 are compared with the Spectrum estimates [14] and are presented in Table 1. The trends of all estimates of impact indicators (new HIV infections, adult HIV prevalence, PLHIV, ART needs and AIDS deaths) by both the methods are declining. However, the current method estimated smaller values for new infections, ART needs and AIDS deaths. Whereas the estimates for PLHIV and adult HIV prevalence are larger by the current method compared to Spectrum estimates. However, the Spectrum estimates include HIV positive children also. The current estimates are only for population above 15 years which accounts for a portion of the difference in all estimates.
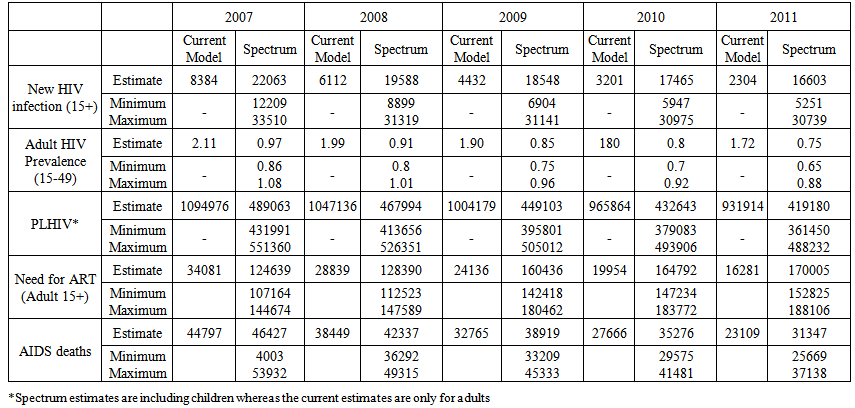 | Table 1. HIV/AIDS related estimates in Andhra Pradesh |
4. Conclusions
- The article has attempted to evolve a basic probabilistic model in order to estimate the force of transmission of HIV infection between heterosexual high risk behaviour groups and within homosexuals and IDUs. Growth probabilities of HIV infection over time among different risk groups are estimated in the process. The transmission probability function is estimated as joint probability function of the growth probabilities of the risk groups that bridge the population. Transmission probabilities due to various risk behaviours are important useful information from programmatic point of view. This could be an indicator of the epidemic control or otherwise. It also indicates the impact of intervention programmes and further needs for initiation of new programmes or modification of existing ones.As an application the aggregate force of transmission over time has further been used to estimate the annual new HIV infections. The number of new infections progressing to AIDS is estimated applying the Weibull incubation probability distribution and using the multiple decrement process. The deaths among estimated AIDS cases are also derived applying the Weibull survival probabilities for AIDS persons in the absence of treatment. Though the numbers are not tallying with the Spectrum results, the trend is declining in both the methods. Major reason for differences in the results is that the current method estimated only the population above 15 years of age whereas the Spectrum results include children. Others include the methodological differences mentioned in the results section.Improving the estimation process by adding, age-sex components, fertility among HIV positives and ART of various groups could improve the result. Since the basis of HIV estimation in this exercise is the force of transmission of HIV infection in the population, the methodology eliminates the use of population sizes of HRGs - an uncertain input in the Global methods.
ACKNOWLEDGEMENTS
- The article is an outcome of the ICMR Task Force project ‘Statistical Modeling of HIV/AIDS’ conducted by National Institute of Medical Statistics, ICMR. Thanks are due to the Department of AIDS Control, Ministry of Health & Family Welfare, Govt. of India for giving the National Institute of Medical Statistics, ICMR to work closely for HIV Sentinel Surveillance and Estimation which led to have good understanding of surveillance data. We are grateful to Prof. S. Biswas, Ex-Professor & Head, Department of Statistics, Delhi University, for his valuable advice on model development and unanimous referees of the journal for their valuable suggestions to improve the presentation. We would like to acknowledge the mentoring support of Knowledge Network project, a grant to the Population Council from the Bill & Melinda Gates Foundation through Avahan, the India AIDS Initiative. The views expressed herein are those of the authors and do not necessarily reflect the official policy or position of the Bill & Melinda Gates Foundation and Avahan.