E. P. Clement1, G. A. Udofia2, E. I. Enang2
1Department of Mathematics and Statistics, University of Uyo, Uyo, Nigeria
2Department of Mathematics, Statistics and Computer Science, University of Calabar, Calabar, Nigeria
Correspondence to: E. P. Clement, Department of Mathematics and Statistics, University of Uyo, Uyo, Nigeria.
| Email: |  |
Copyright © 2012 Scientific & Academic Publishing. All Rights Reserved.
Abstract
An analytical approach for finding the best sampling design subject to a cost constraint is developed. We consider stratified random sampling design when elements of the inclusion probabilities are not equal but are in same stratum and proposed estimators of totals for domains of study under nonresponse in the context of calibration estimation. We derived optimum stratum sample sizes for a given set of unit costs for the sample design and compared empirically the relative performances of the proposed calibration estimators with a corresponding global estimator. Analysis and evaluation are presented.
Keywords:
Calibration estimation, Domain estimation, GREG-estimator, Optimum allocation, Sampling design
Cite this paper: E. P. Clement, G. A. Udofia, E. I. Enang, Estimation for Domains in Stratified Sampling Design in the Presence of Nonresponse, American Journal of Mathematics and Statistics, Vol. 4 No. 2, 2014, pp. 65-71. doi: 10.5923/j.ajms.20140402.03.
1. Introduction
In sample survey, separate estimates of a parameter may be required for subpopulations into which a population is divided without separately sampling from these subpopulations. Such subpopulations are called domains of study [1]. The method of estimating the domain parameters is called domain estimation. [2] first considered in detail some of the problems associated with the estimation of domain totals, means and proportions in the case of a single-stage simple random sampling. He noted that the variance of an estimator of a domain parameter is increased by the fact that the number of the domain elements, and hence the number of those elements that can fall in a random sample of a fixed size, is unknown before the start of the survey. [3] gave a derivation of Yates’ results in multi-stage sampling. [3] paper is one of the first attempts to unify the theory of domain estimation. Hartley provided the theory for a number of sample designs where domain estimation was of interest. His paper mostly discussed estimations that did not make use of auxiliary information. He did, however, consider the case of ratio estimation where population totals were known for the domains.[4] extended Yates’ results to double sampling for probability proportional to size (PPS) when information on the size, X, of each sampling unit is unknown. [5] proposed an empirical Bayes estimation of domain means under nested error linear regression model with measurement errors in the covariates. The problem of allocation of resources when domains of study are of primary interest is discussed by [6].However, despite these vast extensions of Yates results, the phenomenon of nonresponse and its problems in domain estimation have not been adequately addressed. In many human surveys, information is in most cases not obtained from all the units in the survey even after some call-backs. An estimate obtained from such incomplete data may be misleading especially when the respondents differ from the non-respondents because the estimate can be biased.Nonresponse always exists when surveying human populations as people hesitate to respond in surveys; and increases notably while studying sensitive issues like family size. Nonresponse as an aspect in almost every type of sample survey creates problems for estimation which cannot simply be eliminated by increasing sample size.The phenomenon of nonresponse in a sample survey reduces the precision of parameters estimates and increases bias in estimates resulting in larger mean square error, thus ultimately reducing their efficiency.An important technique to address these problems is by calibration. Calibration as a tool for reweighting for nonresponse was first introduced by [7] for the estimation of finite population characteristics like means, ratios and totals. This calibration approach requires the formulation of suitable auxiliary variables. The calibration approach provides a unified treatment of the use of auxiliary information in surveys with nonresponse. In the presence of powerful auxiliary information, the calibration approach meets the objectives of reducing both the sampling error and the nonresponse error. In survey sampling many authors, such as [7-11] defined some calibration estimators using different constraints. In stratified random sampling, calibration approach is used to obtain optimum strata weights. [12-13] defined some calibration estimators in stratified random sampling. This article is an attempt to extend [7] results to stratified sampling design for domain estimation in the presence of nonresponse by calibration approach.
2. Sample Design and Estimation
2.1. Domain Characteristics
Consider the finite population under study  of size
  divided into
  domains;
  of sizes
  respectively. Domain membership of any population unit is unknown before sampling. It is assumed that domains are quite large. Following from [14], for a typical
  th domain
  several characteristics may be defined including the domain total:
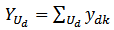 | (1) |
Domain mean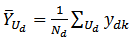 | (2) |
Domain variance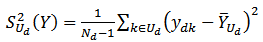 | (3) |
And domain covariance between two characteristics  and
and 
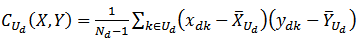 | (4) |
In this article the estimation of domain totals is considered.
2.2. Domain Estimation by Calibration
The technique of estimation by calibration is based on the idea to use auxiliary information to obtain a better estimate of a population statistic. Consider a finite population  of size
  with unites labels
  Let
Let  be the study variable and
  be the
  -dimensional vector of auxiliary variables associated with unit
  .Suppose we are interested in estimating the domain total
  . We draw a sample
  using a probability sampling design
  , with probability
  , where the first and second order inclusion probabilities are
  and
and  respectively.An estimate of
  is the Horvitz-Thompson (HT) estimator
 | (5) |
where  is the sampling weight defined as the inverse of the inclusion probability
  for unit
  .An attractive property of the HT-estimator is that it is guaranteed to be unbiased regardless of the sampling design
  [15]. It variance under
  is given as:
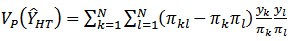 | (6) |
Suppose there are  auxiliary variables at unit
  and
and  may or may not be known a priori.
  is the domain total for
  , and is known a priori. Ideally, we would like
  | (7) |
but often times this is not true.The idea behind calibration estimation is to find weights  close to
  based on a distance function such that
 | (8) |
Expression (8) is the calibration constraint. We wish to find weights  similar to
  so as to preserve the unbiased property of the HT-estimator. Once
  is found, then our propose calibration estimator for
  is:
is: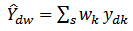 | (9) |
where  .Thus
.Thus 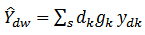 | (10) |
This can be written in regression form as: 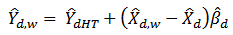 | (11) |
where 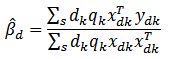 And its variance estimator is;
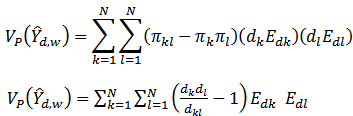 | (12) |
where 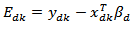
2.3. Sample Design for the Calibration Estimator
Consider a stratified random sampling design with  strata and such that
  elements are considered from
  in stratum
  . Then, the design weights needed for the point estimation are
  for all
  in stratum
  . However, the design weights
  needed for the variance estimation if
  and both
  and
and  are in stratum
  is:
is: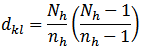 Using equation (12):
 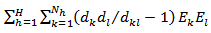 Then we have;
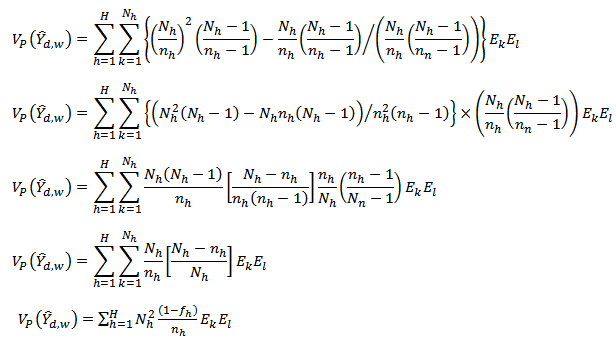 | (13) |
Therefore our variance estimator of (12) becomes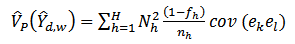 | (14) |
But  and from the principle of SRS
  .Therefore,
 | (15) |
and | (16) |
Substituting (16) into (14) we have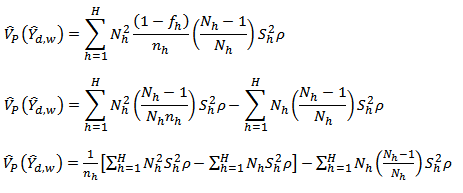 | (17) |
2.4. Optimal Sample Allocation
We shall now deduce the optimum  , that minimize the variances of the proposed calibration estimators for a specified cost, or that minimize the cost for a specified variance.Let us consider the simple linear sampling cost function of the form:
 | (18) |
where  is the overhead cost and
  is the cost per unit of obtaining the necessary information in
  -th stratum. We shall consider the following allocation methods in this article, namely:(i) Optimum allocationUsing the cost function of (18),
  , we have corresponding lagrangian as follows:
 | (19) |
The partial derivatives of (19) with respect to  and
and  are respectively:
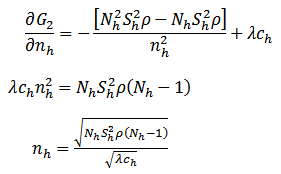 | (20) |
 | (21) |
substituting (20) into (21) and solving for  , we obtain
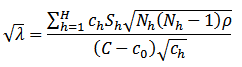 Finally to obtain a solution for
  , we substitute for
  into (20) as follows:
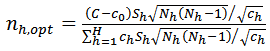 | (22) |
(ii) Neyman allocationIf the cost per unit is the same across strata (that is, 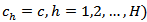 then;
then;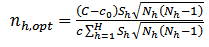 | (23) |
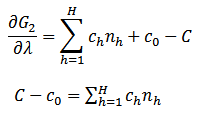
(iii) Optimal power allocationLet the loss function according to [16] be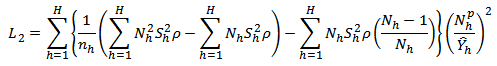 and the corresponding lagrangian is
 | (24) |
The partial derivatives of (24) with respect to  and
and  are respectively:
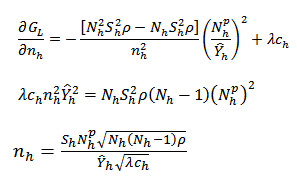 | (25) |
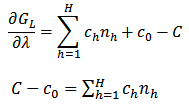 | (26) |
substituting (25) into (26) and solving for  we obtain
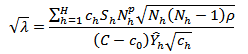 Finally to obtain a solution for
  , we substitute for
  into (25) to obtain:
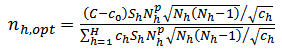 | (27) |
(iv) Neyman power allocationIf the cost per unit is the same across strata, then;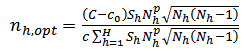 | (28) |
(v) Square root allocationIf the value of the power of the allocation is set to one-half (i.e. 0.5) then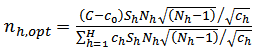 | (29) |
(vi) Neyman square root allocationIf the cost per unit is the same across strata, and the value of the power of allocation is set to one-half, then, we obtain 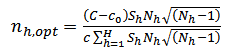 | (30) |
3. Data Analysis and Discussion
3.1. Background and Analytical Set-up
The data used is obtained from the 2005 socio-economic household survey of Akwa Ibom State conducted by the ministry of economic development, Uyo, Akwa Ibom State, Nigeria [17].The study variable,  , represents the household expenditure on food and auxiliary variable,
  , represents the household income. The statistic of interest is the total cost of food for household and its corresponding estimator for male and female heads of household.The population of household heads was stratified into two strata that constitute the domains; as the male household heads and the female household heads respectively. For the population of individual household heads, we want a separate estimates for male and female household heads defined as two domains of the population. The number of the male household heads and female household heads in the survey are known. We used the calibration estimator for the domain total
  and the following formulation is specified: The number of male household heads,
  and female household heads,
  are known and the auxiliary vector has two possible values; namely,
  for all male household heads and
  for all female household heads. The population total of the auxiliary vector
  is
is  which is also known and
  for all
  .An assisting model of the form
  was designed for the calibration estimators, where
  is the number of strata (domains) and
  are independently generated by the standard normal distribution.
3.2. The Sampling Design Variance Estimation
To obtain an optimum value of  that minimizes the design variance
  , a population was generated with the following parameters:


 .
.Table 1. Optimum value of
 |
| | Stratum | OA | NA | OPA | NPA | SRA | NSRA | | 1 | 674 | 805 | 770 | 952 | 737 | 900 | | 2 | 210 | 195 | 50 | 48 | 105 | 100 | | Total | 884 | 1,000 | 820 | 1,000 | 842 | 1,000 |
|
|
| Table 2. Optimum variance |
| | Allocation Method | Stratum 1 | Stratum 2 | Total | | Optimum Allocation | 18,452.5381 | 3,293.2926 | 21,745.8307 | | Neyman Allocation | 15,148.6151 | 3,586.2351 | 18,734.8502 | | Optimum Power Allocation | 15,921.2883 | 15,479.701 | 31,400.9895 | | Neyman Power Allocation | 12,523.7988 | 16,146.145 | 28,669.9442 | | Square Root Allocation | 16,717.0263 | 7,101.5452 | 23,818.5715 | | Neyman Square Root Allocation | 13,354.2962 | 7,482.3705 | 20,836.6667 |
|
|
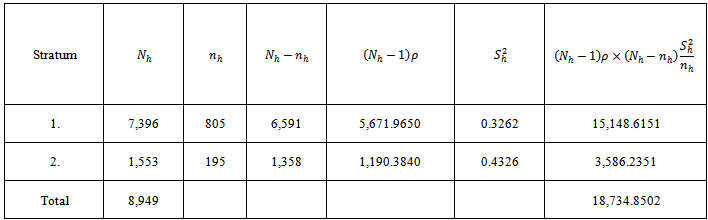
Table 1 shows the summary of values of  for the six allocation criteria. The variance for the calibration estimator using the optimum values of
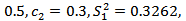
  from the six different allocation criteria are presented in table 2.The variance estimator from the stratified random sampling design is:
 where
where  and
and  and
and  is the stratum variance of the residuals
  where
where 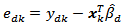 .The optimum value of
  for the Neyman allocation gave the minimum variance sought. The results of the design variance estimation are presented in table 3.
Table 3. Variance estimation
 |
| |
|
3.3. Comparison with Global Estimator
To compare the performance of each estimator we use the following criteria; bias (B), relative bias (RB), mean square error (MSE), average length of confidence interval (AL) and the coverage probability (CP) of  . Let
. Let  be the estimate of
  in the
  -th simulation run;
 we define
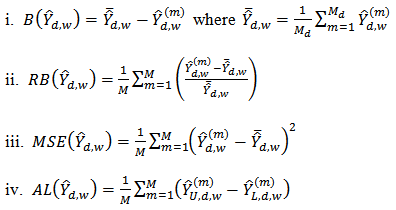 where
where  and
and  are the upper and lower confidence limit of the corresponding confidence interval.
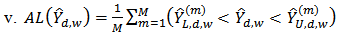 Coverage probability of 95% confidence interval is the ratio of the number of times the true domain total is included in the interval to the total number of runs or the number of replicates. For each estimator of
  , a 95% confidence interval
  is constructed, where
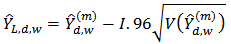 and
and 
 where
where  is the lower confidence limit ,
  is the upper confidence limit and
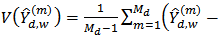
 .The analytical study was conducted using the R-statistical package. There were
  runs in total. For the
  -th run
  , a Bernoulli sample is drawn where each unit is selected into the sample independently, with inclusion probability
  where
where  . Following the results of analysis for optimum stratum sample sizes, we fixed
  and
and  and the corresponding calibration estimators of the domain totals were computed. For simplicity, the tuning parameter
  was set to unity
  .For each estimator of
  , a 95% confidence interval
  is constructed, where
  is the lower confidence limit, and
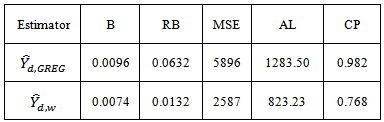
  is the upper confidence limit.The results of the analysis are given in table 4.
Table 4. Comparison of estimators from analytical study
 |
| |
|
3.4. Discussion
An assisting model of the form  where
where  is the number of strata (domains) and
  . The results of the residual diagnostics showed the
  value as 0.588 indicating that the model is significant and that the calibration estimators are unbiased with respect to the sampling design. The correlation between the study variable
  and the auxiliary variable
  is
is  is strong and sufficient implying that the calibration estimators would provide better estimates of the domain totals. The Neyman allocation criterion provides the optimum stratum sample sizes
  and
and  that minimized the variance of the calibration estimators as reflected in table 2. The design strata estimates are 15,148.6151 and 3,586.2351 for stratum 1 and stratum 2 respectively. Similarly, the variance estimate is 18,734.8502. Following from the above estimates, we deduced that the design strata estimates are minimized when the elements of the inclusion probability are not equal but are in the same stratum under calibration approach to domain estimation. We also deduced that design strata estimates sum up to the finite population estimates. Analysis for the comparison of performance of estimators showed that the biases of 0.74 percent and 0.96 percent respectively for the calibration estimator and the GREG-estimator are negligible. But the bias of the GREG-estimator though negligible is the most biased among the estimators considered. The relative bias for the calibration estimator is relatively smaller than that of the GREG-estimator. The variance for the GREG-estimator is significantly larger than the variance of the calibration estimators, as is indicated by their respective mean square errors in table 4. The average length of the confidence interval for the calibration estimator is significantly smaller than that of the GREG-estimator. The coverage probability of the calibration estimator is also smaller than that of the GREG-estimator. These results showed that there is greater variation in the estimates made by the GREG-estimator than the calibration estimator. In general, the calibration estimator is more efficient than the GREG-estimator and the variance reduction is about 50 percent which is consistent with theory as is reflected by the high population correlation between the study variable
  and the auxiliary variable
  .
.
4. Concluding Remarks
In calibration estimation the common practice is to generate artificial population (s) for simulation study and assign samples to the said population (s) by proxy. We have demonstrated the use of analytical approaches to allocate optimal samples to subpopulations by conducting real data analysis. We recommend analytical approaches for allocation of optimal samples to population (s) or subpopulation (s) through real data analysis as this guarantee the applicability of the proposed estimator (s) to real life situation (s). That is, focus should be on assessing the applicability of the proposed estimator (s) to real life situation (s) through real data analysis rather than on assessing the performance of the proposed estimator (s) against a given estimator (s) through simulation study. Though both cases, could be investigated as it is demonstrated in this article.
5. Conclusions
Calibration estimation for finite population by [7] is extended to domain estimation in the context of stratified random sampling design. We proposed calibration estimator based on the stratified random sampling design in the presence of nonresponse. The calibration assumption of reliant on implicit linear relationship between the study variable,  and the auxiliary variable
  is retained for the domain estimation.The problem of optimal allocation of sample sizes for domain estimation has received less attention than merited in the statistical sample survey theory literature. This article equally addressed this problem especially when it is feasible to select sample in every domain and we used the stratified random sampling design (STRS) where domains constitute strata in the sampling design to obtain optimal stratum sample sizes. Six optimal allocation criteria were considered, namely; optimum allocation, Neyman allocation, optimal power allocation, Neyman power allocation, square root allocation and Neyman square root allocation. Analysis showed that among this class of optimal allocation criteria, the Neyman allocation provided the optimal stratum sample sizes that minimized the variance of our proposed calibration estimator. The efficacy of our proposed calibration estimator was tested through a real data analysis. Five performance criteria, namely; bias (B), relative bias (RB), mean square error (MSE), average length of confidence interval (AL) and coverage probability (CP) were used to compare the relative performances of our proposed calibration estimator against the traditional GREG-estimator. Results of the analytical study using real data showed that our proposed calibration estimator is substantially superior to the traditional GREG-estimator with relatively small bias, mean square error and average length of confidence interval.
References
| [1] | Hidiroglou, M.A. and Patak, Z. 2006. Domain estimation using linear regression. Survey Methodology, 30(1), 67-78. |
| [2] | Yates, F. 1953. Sampling methods for censuses and surveys. London: Charles W. Griffin. |
| [3] | Hartley, H.O.1959. Analytical studies of survey data. Rome: Instituto di Statistica. |
| [4] | Udofia, G.A. 2002. Estimation for domains in double sampling for probabilities proportional to size. Sankhya, B64,82-89. |
| [5] | Torabi,M., Datta,G. and Rao ,J.N.K. 2009. Empirical Bayes estimation of small area means under nested error linear regression model with measurement errors in the covariates. Scandinavian Journal of Statistics,36,355-368. |
| [6] | Cochran, W.G. Sampling techniques. New York: Wiley and Sons. 1977 |
| [7] | Deville, J.C., and Sarndal, C.E., 1992, Calibration estimators in survey sampling, Journal of the American Statistical Association, 87, 376-382. |
| [8] | Estevao, V.M., and Sarndal, C.E., 2000, A functional form approach to calibration, Journal of Official Statistics, 16, 379-399. |
| [9] | Arnab, R.. and Singh, S. 2005, A note on variance estimation for the generalized regression predictor, Australian and New Zealand Journal of Statistics, 47, 2, 231–234. |
| [10] | Farrell, P.J., and Singh, S., 2005, Model-assisted higher order calibration of estimators of variance, Australian and New Zealand Journal of Statistics, 47, 3, 375–383. |
| [11] | Kim, J.K., and Park, M., 2010, Calibration estimation in survey sampling, International Statistical Review, 78, 1, 21-29. |
| [12] | Kim, J.M., Sungur, E.A., and Heo T.Y., 2007, Calibration approach estimators in stratified sampling, Statistics and Probability Letters, 77, 1, 99-103. |
| [13] | Koyuncu, N., 2012, Application of Calibration Method to Estimators in Sampling Theory, Hacettepe University Department of Statistics, PhD. Thesis. |
| [14] | Gamrot, W. 2006. Estimation of a domain total under nonresponse using double sampling. Statistics in Transition, 7(4), 831-840. |
| [15] | Horvitz,D.G. and Thompson, D.J. 1952. A generalization of sampling without replacement from a finite universe. Journal of the American Statistical Association, 47(260), 663-687. |
| [16] | Bankier, M.D. 1988. Power allocation: determining sample sizes for subnational areas. The American Statistician, 12 (3), 174-177. |
| [17] | Akwa Ibom State Government 2005. Report of the Socio-economic study of Akwa Ibom State. Ministry of Economic Development, Uyo, Akwa Ibom State - Nigeria. |
 Abstract
 Reference
 Full-Text PDF
 Full-text HTML