-
Paper Information
- Paper Submission
-
Journal Information
- About This Journal
- Editorial Board
- Current Issue
- Archive
- Author Guidelines
- Contact Us
American Journal of Mathematics and Statistics
p-ISSN: 2162-948X e-ISSN: 2162-8475
2013; 3(4): 237-248
doi:10.5923/j.ajms.20130304.08
On the Utilization of Bayesian Approach to Bass Growth Model in Power Consumption Capacity
 Abstract
 Reference
 Full-Text PDF
 Full-text HTML
T. O. Ojo, N. Forcheh, L. Mokgatlhe, D. K Shangodoyin
Department of Statistics, University of Botswana, Gaborone, Botswana
Correspondence to: D. K Shangodoyin, Department of Statistics, University of Botswana, Gaborone, Botswana.
| Email: |  |
Copyright © 2012 Scientific & Academic Publishing. All Rights Reserved.
This paper explores the Bayesian technique in evaluating the exterior and interior factors affecting power consumption using the perspective of experts’ given a particular level of saturation. The study in Nigeria reveals that  and
and for external (
 ) and internal (
 ) factors have equal annual rate of 0.526 on power consumption. The annual rates of
  on
on  are 0.260, 0.110 and 0.104 respectively, while that of
  on
on  are 0.241, 0.149 and 0.089 respectively and experts have the overall opinion that Nigeria power consumption capacity are influenced by the external factor (
 ) and internal factor
  at a rate of
  respectively. The external factor (
 ) effects are overestimated, but the internal factors
  falls within the purview of the Bass models howing that these factors have almost equal unconditional likelihood effects on the power sector in Nigeria. The growth curves indicate that saturation was achieved after the time
  =0.0035 with
  and
and  computed as 7.4 and 927.37 respectively. The point of undulation in terms of penetration rate for power consumption in Nigeria was achieved when
  =11.
=11.
Keywords: Power Consumption, Bayesian Technique, Experts, Exterior and Interior Factors, Growth Curve
Cite this paper: T. O. Ojo, N. Forcheh, L. Mokgatlhe, D. K Shangodoyin, On the Utilization of Bayesian Approach to Bass Growth Model in Power Consumption Capacity, American Journal of Mathematics and Statistics, Vol. 3 No. 4, 2013, pp. 237-248. doi: 10.5923/j.ajms.20130304.08.
Article Outline
1. Introduction
- Bayesian Approach is based on a conceptually simple collection of ideas, that is, if we are uncertain about the quantity of a parameter, we can quantify our uncertainties as subjective probabilities for the parameter, and also conditional probabilities for observations we might make given the true value of the parameter (likelihood function). When data arrives, Bayes’ theorem tells us how to move from our prior probabilities to the new conditional probabilities for the parameter[1]. Decision on external and internal factors affecting the power growth in terms of generation, distribution and consumption growth has caused contestation among a number of historically active social groups in power policy debate. In decision making, multiple perspectives of different individuals or sectoral stakeholders are needed more than ever before, this is particularly true when the decision environment becomes more complex such as accommodating aggregated interior and exterior factors affecting the desired growth in the power sector from the sectoral stakeholders’ when limited information are available to evaluating the needed growth as it affect the power generation, distribution and consumption. Hence, this chapter aims at eliciting the sectoral stakeholders opinion using Delphi techniques in the context of influencing external and internal factors affecting the anticipated growth in the power sector.Delphi techniques used in this study to elicit the sectoral stakeholders opinion incorporates an iterative survey method for eliciting information from sectoral stakeholders[2]. Delphi techniques allows the respondents to reevaluate their responses and it was predicated on the logic that “two heads are better than one”[3]. Delphi techniques are developed to reach a consensus from an expert panel for a complex problem where knowledge/information is limited[4, 5 & 6 ]. Delphi techniques can be used for a plethora of cases, such as sustainable tourism[7 & 8], human resources development [9], government planning[10], environmental management [11], medicine[12, 13] and strategic management[14], while it is applied to select performance indicators in several fields [15]. Typically, Delphi techniques give sectoral stakeholders panel opportunity, to reconsider their responses and anonymity of the sectoral stakeholders panel is guaranteed. There is no agreement on what a sectoral stakeholder is, as different definitions are proposed[13, 16] and whatever definition is given seems arbitrary[23]. Many authors propose an appropriate size of sectoral stakeholders panel varying from a few to a few hundred experts[17, 18]. However, there is no standard number of sectoral stakeholder[4] as it depends on the nature of the problem[19]. For this study, thirty-five (35) sectoral stakeholders cum key informant in charge of power sector, academicians, customers/consumers and union representatives are selected for two main reasons. They perceive the needs of stakeholders in the power sector better than other types of power consumers/customers and the personal experience of companies’ executives could be considered as an important criterion[19]. On the other hand, power sector in Nigeria needs total overhauling and power consumers have higher expectations standards[20] .In power sector, decision maker usually have some advanced information about the states of nature that can be described in terms of a prior distribution, then the Bayes’ approach can be applied to the decision process because it provides another means of defining optimality for decision rules, due to the nature of data in power sector, and, after obtaining the sectora stakeholders’ opinion on factors affecting power consumption, the prior distribution can be updated by using more timely information about the probability distribution of the state of nature. Such updated information is called the posterior distribution of
 , given the prior distribution and the data
  . The posterior distribution of
  is just the conditional distribution of
  , given
  . A procedure for utilizing the prior distribution to aid in the selection of an action is the Bayes’ Criterion. In this study, if
  is a discrete bivariate random variable, with joint probability distribution given by
  , the random variables
  each have marginal distributions. The model given by (equation 5.3) is the prior distributions of
  , the sequence
  follows a Bernoulli distribution since each factors can have two possible outcomes
  , thus for
  (aggregating sectoral stakeholder’s opinion), we assumed a Binomial distribution (likelihood function) such that;
  and for a given
  sectoral stakeholder classification where zero (0) means no presence of the factor and one (1) means factor presence is confirmed by an sectoral stakeholder's opinion. The scenario models use the combination of
  measures of influences
  and as such they either “occurs” or “does not occurs” for factors, {
 };
};  For this study, the probability of each state
  are computed under the independence of each scenarios (or sectoral stakeholders’) and factors influencing the key factors are assessed independently as to whether they occur or not.The basic scenario probability (external factors (
 )) chat is as follows:
 | (1) |
 And the basic scenario probability (internal factors (
 )) chat is as follows:
 | (2) |
 Assume that the probability of occurrence of
  for either
  is
is  for occurrence and
  for non-occurrence respectively ; then we derives the prior probability
  for the key factors using the model:
 | (3) |
 is the weight that is to be sum to unity,
  is obtained from equations (1 & 2) for external and internal factors respectively.By using the models (3) defined above to compute the prior probabilities and consider a random vector of classified observations on sectoral stakeholder’s (Y) opinion,
  whose density for a given factor vectors parameters;
  is
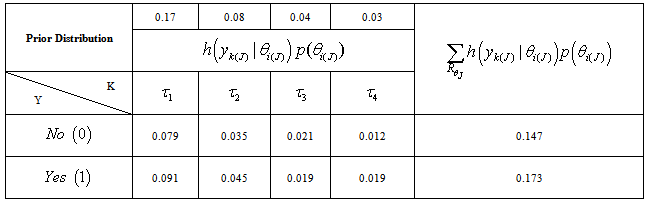
is  referred to as likelihood function. The posterior distribution is computed using the conventional formula:
 | (4) |
 | (5) |
 | (6) |
2. Model Formulation
- The posterior distribution is derived as follows: Let us denote the posterior distribution as
 then by definition we have the general formula as:
 | (7) |
 Where:
 Where
Where  is as defined in equations (3). The sequence
  follows a Bernoulli distribution since each factor can have two possible values 0 and 1; thus for
  factors we assume a Binomial distribution such that:For a given J-th sectoral stakeholders classification where zero (0) means no influence of factor is present and one (1) means factor influence is present. The posterior distribution in general is therefore derived as;
 | (9) |

 | (10) |
 If
If  then it reduces to;
 | (11) |
 ) and internal (
 ) factors (Given in Table 11) which will subsequently be used in Bass model to determine in power consumption growth for a given
3. Empirircal Illustration
- In formulating a general framework for making decision as it affect power consumption, the decision maker must choose an action from a set of possible actions. In power sector, the set
 of two points
  corresponding to absence of influencing factor (0) and presence of factor (1). In taking an action the decision maker must be aware of its consequences, which will usually also be a function of the “state of nature” A state of nature
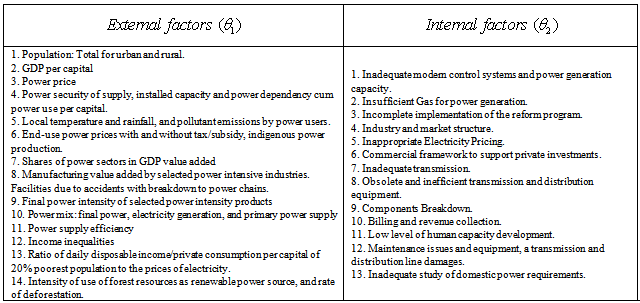
  is a representation of the influencing factors i.e. external and internal affecting power consumption growth to which action must be taken. Generally, these factors are possible alternative representations of the physical phenomenon to be studied. Based on a worldwide set recommended power indicators for sustainable development by[21], the Nigeria power demand and supply projection covering 2005-2030 by[22] and the outcomes and findings of the survey conducted on the factors affecting power consumption growth by this study. The information on external and internal factors (Table 11) affecting the power sectors are also classified into two (2) that is external and internal factors, the fourteen (14) external factors are grouped in order of importance requiring urgent attention, they are thus translated into the prior distribution as follows:
  | (12) |
 | (13) |
 can assume are denoted by
  for external factors (
 ) and internal factors (
 ) respectively. The probability that
  and also the probability that
  . Then
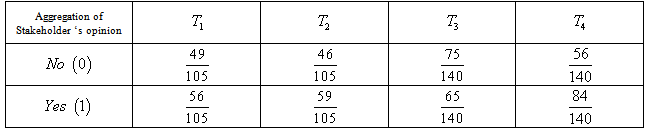
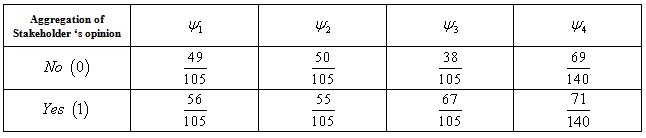
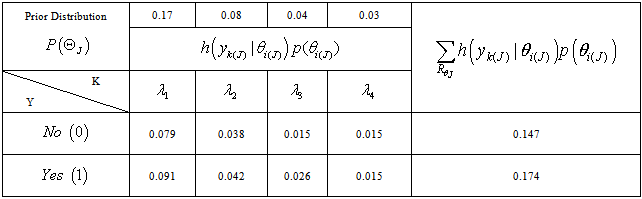
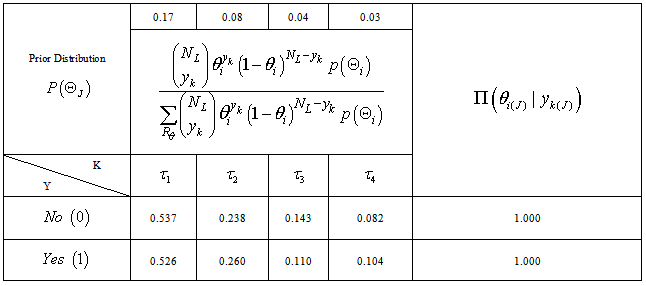
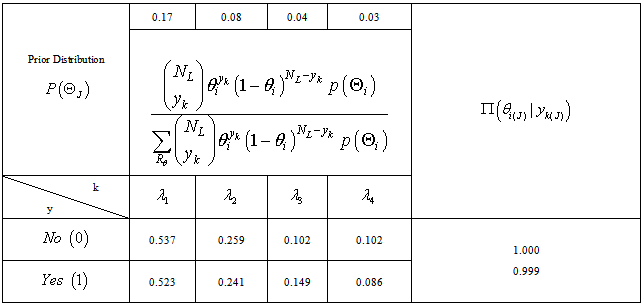
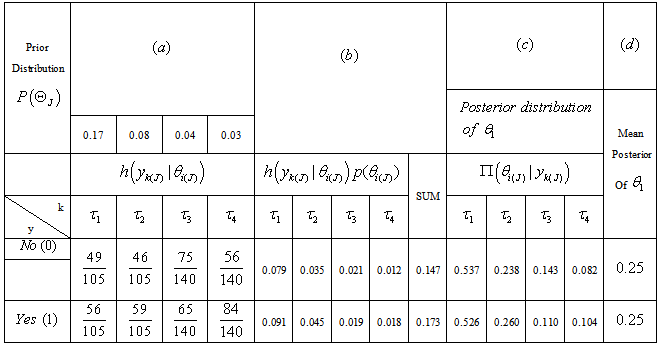
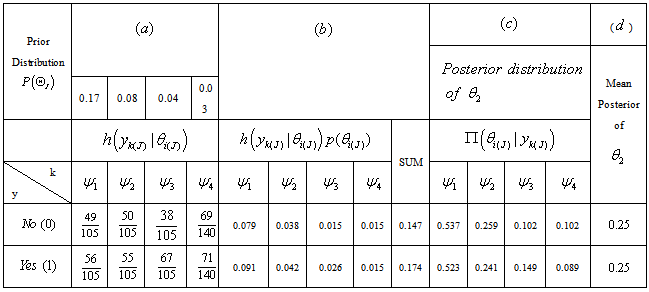
  are ranked as the most critical, very critical, critical and less critical requiring urgent attention.The opinions of sectoral stakeholders on the influence of external and internal factors are displayed in tables 1 and 2. The actual proportion of the influencing factors falling into four categories as show in tables 3 and 4 differs slightly from the prior distribution given in tables 5 and 6. The posterior distribution showed in table 7 and 8 are more representative of what to expect in the power sector as revealed by the sectoral stakeholders’.
4. Results and Discussions
- The stakeholders’ opinion on factors affecting power consumption in Nigeria as shown in Table 11, classified as external (
 ), internal (
 ) and showed by equations 12 & 13 requires urgent attention and the results of eliciting stakeholders’ opinion using Delphi techniques resulted in the posterior distribution given in Table 9 & 10 for external and internal factors respectively. For the external (
 ) factors, the results reveals that
  (Population total for both urban and rural; GDP per capital and Power prices) contributed 0.526 rates in affecting power consumption.
  (Power security of supply; dependency cum power use per capital; local temperature and rainfall combined with pollutant emissions by power users; and end-use power prices with and without tax/subsidy, indigenous power production) contributed 0.260 rates in affecting power consumption.
  (Shares of power sectors in GDP value added; manufacturing value added by selected power intensities industries, facilities due to accidents with breakdown to power chain; final power intensity of selected power intensity products, power mix i.e. final power, electricity generation and primary power supply) contributed 0.110 rates in affecting power supply in Nigeria, while,
  (Power supply efficiency; income inequalities; rate of deforestation; ratio of daily disposable income/private consumption per capital of 20% poorest population to the prices of electricity and intensity of use of forest resources as renewable power source) contributed 0.104 rates in affecting power consumption in Nigeria. The internal factors (
 ) also have effects on power consumption, because
  (inadequate modern control systems with power generation capacity; insufficient gas for power generation and incomplete implementation of the government reform program) contributed 0.526 rates,
  (industry and market structure; inappropriate electricity prices; commercial framework to support private investment) contributed 0.241, while
  (inadequate transmission, obsolete and inefficient transmission and distribution equipment combined with low access to electricity supply) contributed 0.149 and finally
  (billing and revenue collection; low level of human capacity development; vandalization of equipment, transmission and distribution lines with inadequate study of domestic power requirement) contributed 0.089 in affecting power consumption in Nigeria. Internal factor (
 ) based on the posterior mean computation contributed 0.251 rates in affecting power consumption. The unconditional likelihood of influencing factors classified as external (
 ) and internal (
 ) affecting power consumption in Nigeria occurred at time
  given in Table 11, and as shown by growth curve in figures 1 to 4, the most important part of these curves is that the changes are fast and close to point of inflection. Because in general, inflection point is a point on the curve at which the sign of the curvature changes and this may be stationary point but are not local maximal or local minima. For power consumption, an inflection point is critical in time, since it determines whether the next phase of power consumption will be one growth, stagnation or decline. In this study, growth is recorded immediately after the point of inflection
  = 0.0035, when
  are 7.4, 16, 20 and 32 and when
  are 927.37, 2000.8, 2501 and 4001. The cumulative effects of these factors on power consumption should attract the primary attention of power stakeholders which should be centered on the peak and decline pattern of these growth curves[25].
 5. Conclusions
- In this research study we proposed the usage of Bayesian techniques for the quantification of the frequency and severity distributions of eliciting sectoral stakeholders opinions on external (
 ) and internal (
 ) factors affecting the growth in power sectors in terms of power generation/distribution/consumption and sales. The method is based on specifying the prior distributions for the parameters on the frequency and severity distributions of these factors using sectoral stakeholders opinions. Then, the prior distributions are weighted with the actual sectoral stakeholders opinions to estimate the posterior distributions of the model parameters. These are used to estimate the mean posterior distribution for the external and internal factors affecting the power sector in Nigeria. The estimation of mean posterior distribution has several appealing features such as: stable estimators, and the ability to take into account sectoral stakeholders opinions on factors affecting growth in the power sector. There are other aspects of the Bayesian techniques that are useful for modeling sectoral stakeholders opinions, such as the hierarchical Bayesian approach which can be used to estimate the prior distribution by combining several sectoral stakeholders opinions on external and internal factors. As a whole, the mean posterior as expressed by the experts’ on external factor contributed 0.25 rates in affecting power consumption in Nigeria. This reveals that power consumption capacity in Nigeria are influences by the external factor (
 ) and internal factor
  at a rate of
  respectively, showing that these factors have equal influencing effects on the power sector, and hence, requires urgent attention, the diffusion growth curve also revealed the penetration rate of these factors. The sectoral/stakeholder are of the opinion that external factors affecting the power sector in Nigeria exhibit relatively higher effect on the sector compared to internal effects.
APPENDIX
- Computation of the posterior distribution for external and internal factors affecting power consumption in Nigeria
|

|

|
|
|
|
|
|
|
|
|
|
 ) and internal (
 ) factors affecting power consumption in Nigeria
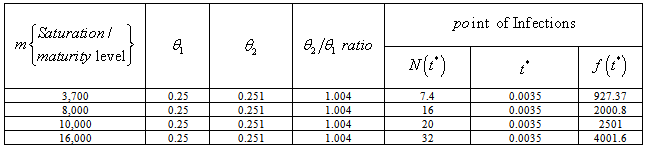
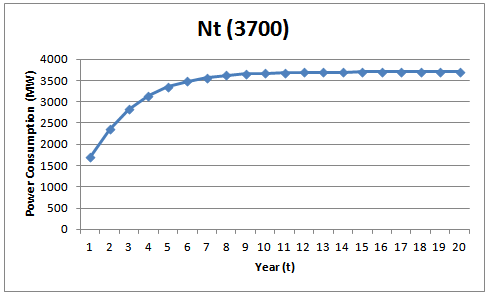 | Figure 1. The diffusion Curve Capturing the Sectoral stakeholders’ Opinion on External and Internal Factors affecting the Power Consumption Capacity in Nigeria when m= 3700 MW |
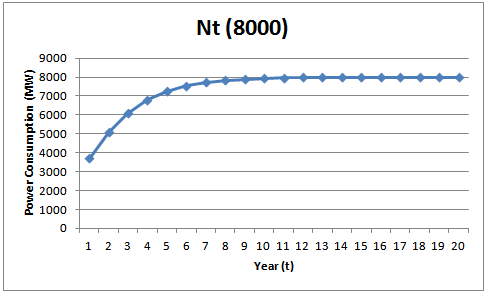 | Figure 2. The diffusion Curve Capturing the Sectoral stakeholders’ Opinion on External and Internal Factors affecting the Power Consumption Capacity in Nigeria when m= 8000 MW |
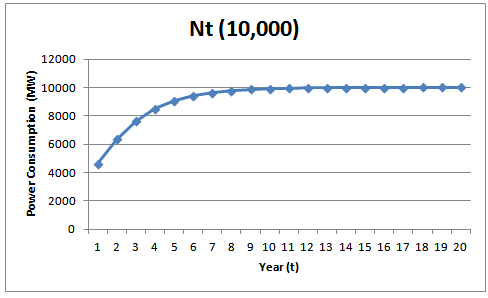 | Figure 3. The diffusion Curve Capturing the Sectoral stakeholders’ Opinion on External and Internal Factors affecting the Power Consumption Capacity in Nigeria when m=10,000 MW |
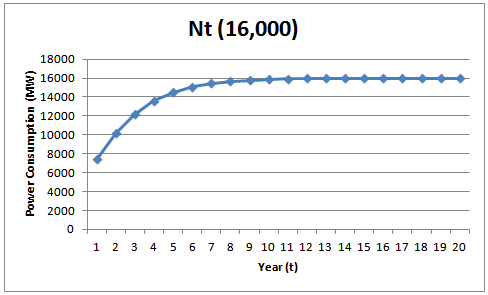 | Figure 4. The diffusion Curve Capturing the Sectoral stakeholders’ Opinion on External and Internal Factors affecting the Power Consumption Capacity in Nigeria when m=16,000 MW |