A. R. Sudamani Ramasamy1, R. Sutharani2
1Department of Mathematics, Avinashilingam University, Coimbatore, 641043(T. N), India
2Department of Mathematics, Coimbatore Institute of Technology, Coimbatore, 641014(T. N), India
Correspondence to: R. Sutharani, Department of Mathematics, Coimbatore Institute of Technology, Coimbatore, 641014(T. N), India.
| Email: |  |
Copyright © 2012 Scientific & Academic Publishing. All Rights Reserved.
Abstract
In this paper double sampling plans for truncated life tests are developed using minimum angle method when the lifetimes of the items follows Rayleigh distribution. The values of operating ratio corresponding to the consumer’s risk and producer’s risk are calculated and using minimum angle method, the value θ is found. Tables are constructed and examples are provided. By applying Minimum angle method for Designing Double Acceptance Sampling Plans under Reliegh Distribution it is found to be more economic in saving cost, energy and time. It also minimizes the consumers and producers risk simultaneously.
Keywords:
Probability of Acceptance, Rayleigh Distribution, Producer’s Risk, Consumer’s Risk, Minimum Angle Method
Cite this paper: A. R. Sudamani Ramasamy, R. Sutharani, Designing Double Acceptance Sampling Plans Based on Truncated Life Tests in Rayleigh Distribution Using Minimum Angle Method, American Journal of Mathematics and Statistics, Vol. 3 No. 4, 2013, pp. 227-236. doi: 10.5923/j.ajms.20130304.07.
1. Introduction
Acceptance sampling procedures play an important role in improving the quality. The basic aim of all companies in this world is to improve the quality of their products. The high quality product has the high probability of acceptance. In a time- truncated sampling plan, a random sample is selected from a lot of products and put on the test where the number of failures is recorded until the pre – specified time. If the number of failures observed is not greater than the specified acceptance number, then the lot will be accepted. Two risks are always attached to an acceptance sampling. The probability of rejecting the good lot is known as the type – 1 error (producer’s risk) and it is denoted by α. The probability of accepting the bad lot is known as the type – 2 error (consumer’s risk) and it is denoted by β. An acceptance sampling plan should be designed so that both risks are smaller than the required values. An acceptance sampling plan involves quality contracting on product orders between the producer’s risk and consumer’s risk. These life tests are discussed by many authors Goode and Kao (1961).[1] Ayman Baklizi (2003),[2] Baklizi A,,EI Qader, and EI Masri (2004).[3] Rosaiah and Kantam (2005) [4] Tsai, Tzong and Shuo (2006).[5] and Mohammad Aslam [6] have designed double acceptance sampling plan based on truncated life tests in Rayliegh distribution. Srinivasa Rao[8] have designed double acceptance sampling plan based on truncated life tests for the Marshall – Olkin extended exponential distribution.The intent of this paper is to design double sampling plans for truncated life tests using minimum angle method, when life times of the items follows Rayleigh distribution.It is known that the double acceptance sampling plan (DASP) is more efficient than the single sampling plan in terms of the sample size required. Further, a DASP is expected to reduce the producer’s risk when specifying the consumer’s risk.
2. Operating Procedure for Double Sampling Plan
1) From a lot, take a first sample of size n1 and observe the number of nonconforming units, d1.2) If d1 ≤ c1, accept the lot; if d1 ≥ c2, reject the lot. If c1 < d1 < c2 take a second sample of size n2 and observe the number of nonconforming units, d2.3) If d1 + d2 ≤ c2, accept the lot; otherwise reject the lot.Thus the double sampling plan is characterized by the parameters n1, n2, c1, c2, and designated as DASP – (n1, n2, c1, c2).
3. Double Sampling Plans in Life Tests
We propose the following Double sampling plan procedure based on a truncated life test:1. Draw the first sample of size n1 and put them on test during time t02. Accept the lot if there are no more than c1 failures. Reject the lot and terminate the test if there are more than c2 failures.3. If the number of failures is between c1 and c2, then draw the second sample of size n2 and put them on test during time t0.4. Accept the lot if the total number of failures not more than c2 during the time t0 .DECISION FLOWCHART FOR DOUBLE SAMPLING PLAN IN LIFE TESTS.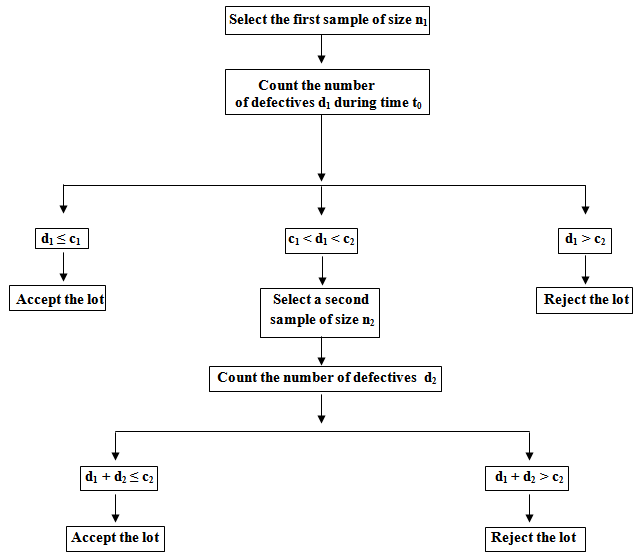 The DASP is composed of four parameters of (n1, n2, c1, c2) if t0 is specified. Here n1 and n2 are sample sizes of the first and second sample, whereas c1 and c2 are the acceptance numbers associated with the first and the second sample, respectively. Let λ be the unknown average life and λ0 be the specified average life. A lot is considered to be good if the true unknown average life is more than the specified average life.We assume that the lot size is large enough to use the binomial distribution to find the probability of acceptance of the lot. In this paper we have considered c1= 0 and c2= 2, ie. DASP (c1= 0 and c2= 2).Where, P = F (t, λ) = F (
 ) is the function CDF of the Rayleigh distribution and the Cumulative Distribution Function (CDF) is,F(t,λ) =
  t >0, λ >0Then,
 | (1) |
For different time ratio t/λ0 = 0.628, 0.942, 1.257, 1.571, 2.356, 3.141 and different mean ratios λ/λ0 = 4 ,6, 8, 10 and 12, the cumulative distribution function of the Rayleigh distribution is calculated using the formula (1).The probability of acceptance L(p1) and L(p2) of DASP are calculated using above values. The probability of acceptance for DASP is given by P (A) = P (no failure occur in sample 1) + P (1 failure occur in sample 1 and 0, 1 failure occur in sample 2) + P (2 failures occur in sample 1 and 0 failure occurs in sample 2).The probability of acceptance DASP (n1, n2, 0,2) is given in formula( 2) | (2) |
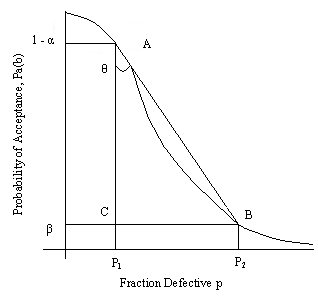 | Figure 1. Minimal angle for given P1 and P2 |
4. Operating Characteristics Function
The probability of acceptance can be regarded as a function of the deviation of the unknown average life λ0 from its specified average life λ. This function is called Operating Characteristic (OC) function of the sampling plan. For different time ratio t/λ0 = 0.628, 0.942, 1.257, 1.571,2.356 and 3.141 the parameters n1 and n2 are determined using minimum angle method.Notation: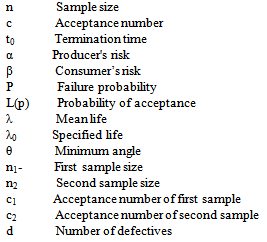
5. Minimum Angle Method
The practical performance of a sampling plan is revealed by it operating characteristic curve. Norman Bush et. al.[7] have used different techniques involving comparison of some portion of the OC curve to that of the ideal curve. The approach of minimum angle method by considering the tangent of the angle between the lines joining the points Acceptable Quality Level (AQL, 1- α) and Limiting Quality Level (LQL β) is shown in Figure 1, where p1 = AQL, p2 = LQL. By employing this method one can get a better discriminating plan with the minimum angle. Tangent of angle made by lines AB and AC is | (3) |
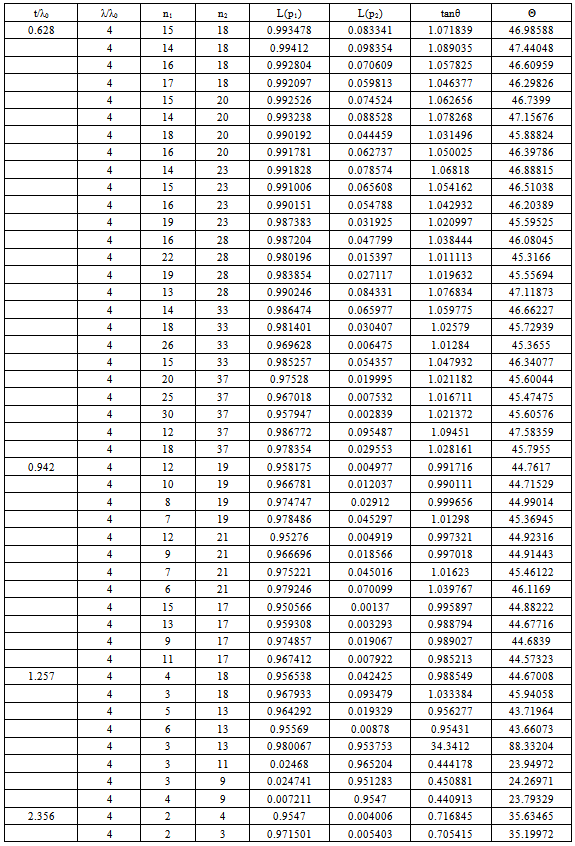
The smaller the value of this tan θ, closer is the angle θ approaching zero and the chord AB approaching AC, the ideal condition through (AQL, 1-α). This criterion minimizes simultaneously the consumer’s and producer’s risks. Thus both the producer and consumer favor the plans evolved by the criterion. In this paper we design parameters of the double acceptance sampling plan based on truncated life tests for Rayleigh distribution, using minimum angle method. The minimum angle method of the double sampling plan under Rayleigh distribution for truncated life test is given below. Let us assume mean ratio λ/λ0 (4,6,8,10,12) and the consumer’s risk β ≤ .10 and producer’s risk α = 0.05 are specified. The probability of acceptance L (p1) and L (p2) is placed in Table 1 to Table 5 for c1 = 0 and c2 = 2 and the time ratios t/λ0 = 0.628, 0.942, 1.257, 1.571,2.356, 3.141.From the Tables 1, 2, 3, 4 and 5 it can be noted that from the given values for fixed mean ratio and various time ratios. We select the parameters corresponding to minimum angle.Table 1. Minimum Angle Double Sampling Plan Under Rayleigh Distribution for C1 = 0 & C2 = 2
 |
| |
|
Table 2. Minimum Angle Double Sampling Plan Under Rayleigh Distribution for C1 = 0 & C2 = 2
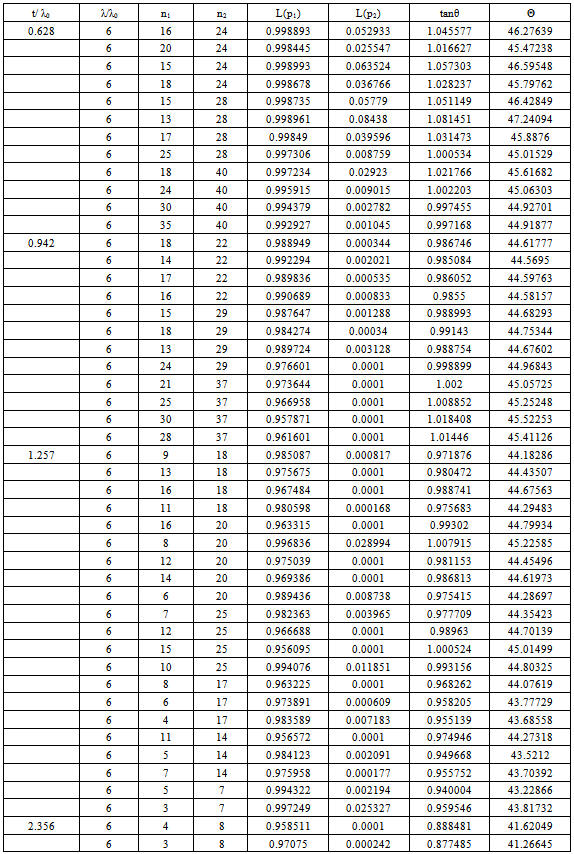 |
| |
|
Table 3. Minimum Angle Double Sampling Plan Under Rayleigh Distribution for C1 = 0 & C2 = 2
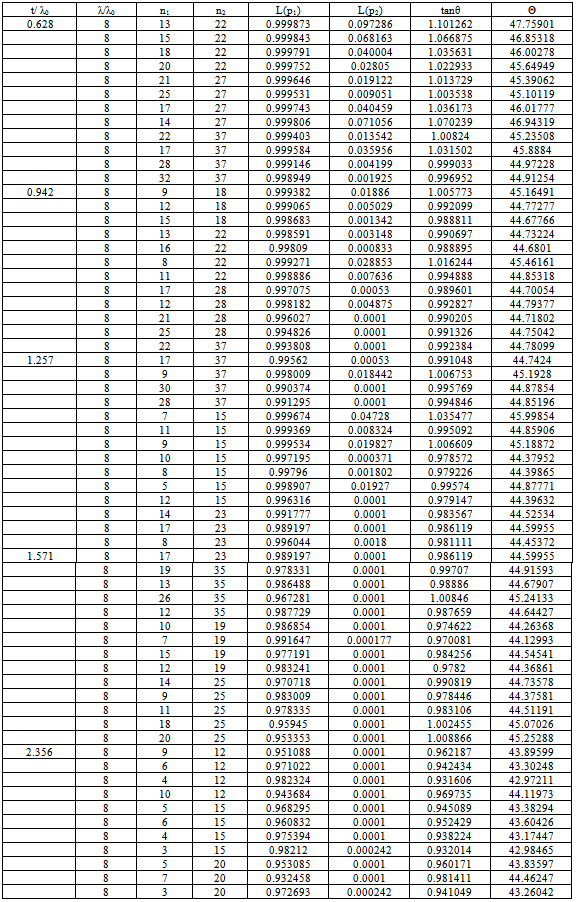 |
| |
|
Table 4. Minimum Angle Double Sampling Plan Under Rayleigh Distribution for C1 = 0 & C2 = 2
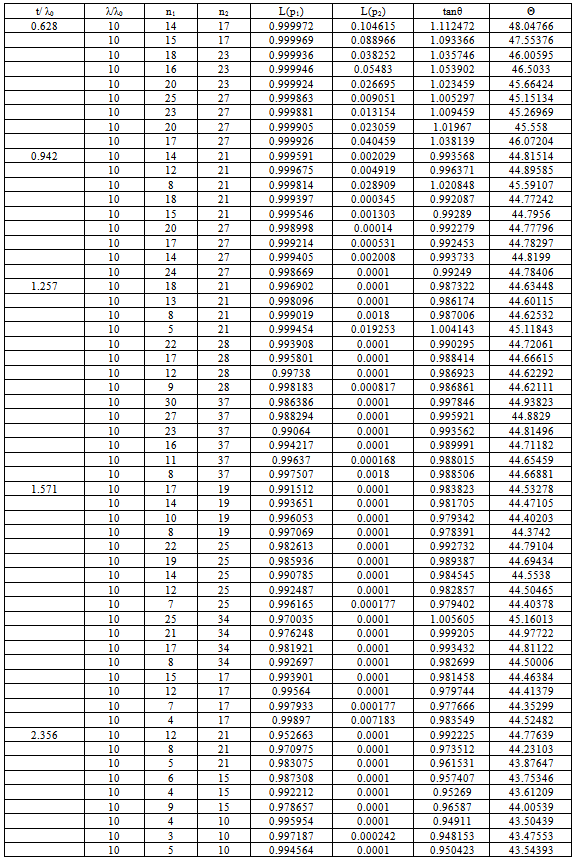 |
| |
|
Table 5. Minimum Angle Double Sampling Plan Under Rayleigh Distribution for C1 = 0 & C2 = 2
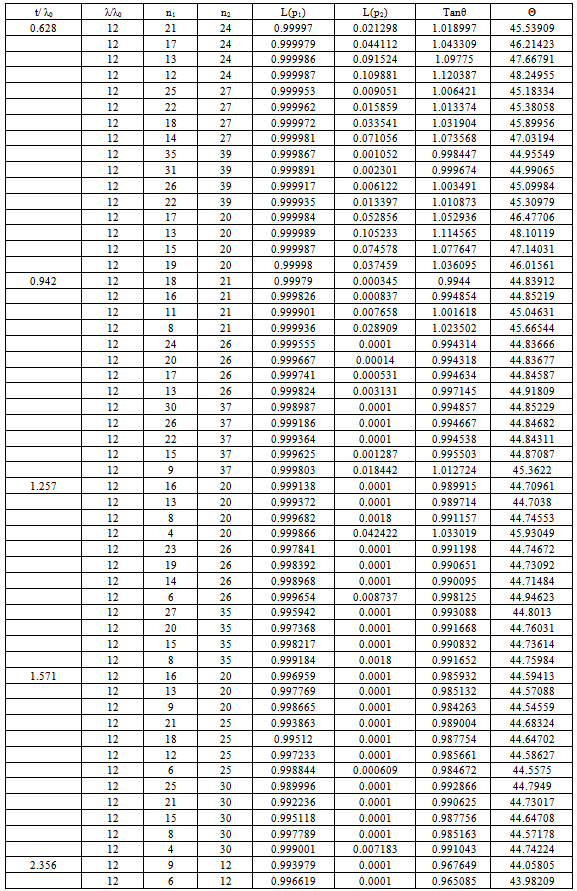 |
| |
|
6. Designing DSP Based on Truncated Life Tests for the Rayleigh Distribution Using Minimum Angle Method
First let us fix the value of time ratio t/λ0 and mean ratio λ/λ0 corresponding to c1 = 0 and c2 = 2. Where the mean ratio λ/λ0 = 2,4,6,8,10 and 12 be the acceptable reliability level (ARL) at the producer’s risk and the mean ratio λ/λ0 which is equal to 1, be the Lot Tolerance Reliability Level (LTRL) at the consumer’s risk.♦ The parameters n1 & n 2 can be obtained from the table along with producers and consumers risk. ♦ First select the time ratio the t/λ0♦ Select the parameter of the sampling plan corresponding to smallest value of θ.♦ Construction of TablesThe Tables are constructed using OC function for Double sampling plans under Rayleigh distribution is given by the equations (1), (2) & (3). Using the above values the minimum angle tan θ is calculated using the equation (3). For various time ratios t/λ0 and mean ratios λ/λ0 the parameter values n1 and n2 are obtained by DASP under Rayleigh Distribution for c1 = 0 and c2 = 2 and are presented in Table 1 to Table 5. Numerical value in these tables reveals the following facts.For given mean ratio and time ratio c1 = 0 and c2 = 2, values in Tables 1-5 can be used to select the parameters of Double sampling plan under Rayleigh distribution for certain specified values of AQL and LQL. The parameters n1, n2 and θ can be obtained from the selected table corresponding to λ/λ0 along with producer’s risk and consumer’s risk.Example 1: Suppose one wants to design Double sampling plan under Rayleigh distribution for given α = .02, β = .01, λ/λ0 = 4, given t/λ0 = 0.628, c1 = 0, c2 = 2. From Table 1, one can observe that the minimum angle is θ = 45.3166° it corresponds to n1= 22 n2=28. Thus the required sampling plan has parameters (22, 28, 0, 2).Example 2: For given λ/λ0 = 6, α = 0.007, β = 0.001 from Table 2, one can observe the minimum angle is θ = 44.918770. It corresponds to n1 = 35 n2 = 40. Thus the required sample plan has parameters (35, 40, 0, 2).Example 3: For givenλ/λ0 = 8, α = 0.001, β = 0.002 from Table 3, one can observe the minimum angle is θ = 44.91254°. It corresponds to n1 = 32 n2 = 37. Thus the required sample plan has parameters (32, 37, 0, 2).Example 4: For given λ/λ0 = 10, α = 0.001, β = 0.009 from Table 4, one can observe the minimum angle is θ = 45.151340. It corresponds to n1 = 25 n2 = 27. Thus the required sample plan has parameters (25, 27, 0, 2).Example 5: For given λ/λ0 = 12, α = 0.0002, β = 0.071 from Table 5, one can observe the minimum angle is θ = 44.995490. It corresponds to n1 = 35 n2 = 39. Thus the required sample plan has parameters (35, 39, 0, 2).
7. Conclusions
In this paper designing of double sampling plan for truncated life tests by using minimum angle method is presented. It is assumed that life times of the items follow Rayleigh distribution. It can be seen that by applying minimum angle method there is a great reduction in the sample sizes and at the same time this criterion minimizes simultaneously the consumer’s and producer’s risk. This minimum angle method plan provides better discrimination of accepting good lots
References
| [1] | Goode, H. P., & Kao, J.H.K (1961). Sampling plans based on the distribution. In Proceeding of the Seventh National Symposium on Reliability and Quality Control (pp. 24-40). Philadelphia. |
| [2] | Ayman Baklizi, (2003). Acceptance sampling based on truncated life tests in the Pareto distribution of the second kind. Advances and Applications in Statistics, 3 (1), 33-48. |
| [3] | Baklizi A, EI Qader & EI Masri A (2004), Acceptance sampling based on truncated life tests in the Birnbaum Saunders model. Risk Analysis, 24(6), 1453. |
| [4] | Rosaiah, K., Kantam, R. R. L. (2005). Acceptance sampling based on inverse Rayleigh distribution. Econo. Qual. Control 20:277-286. |
| [5] | Tsai, Tzong-Ru., Wu & Shuo- Jye (2006). Acceptance sampling based on truncated life for generalized Rayleigh distribution. Journal of applied statistics, 33 (6), 595 – 600. |
| [6] | Muhammad Aslam, (2007). Double Acceptance Sampling Based on Truncated Life tests in Rayleigh Distribution. European Journal of Scientific Research, Vol.17 pp.605-610. |
| [7] | Bush N. Leonard E.J., and Merchant M.Q.M.Jr.,(1953) A Method od Single and Double Sampling OC curves Utilizing the Tangent of the Point of the Inflexion, (ENASR), No,PR-7, 1-77. |
| [8] | Srinivasa Rao (2009) “Reliability test plans for Marshall – Olkin extended exponential distribution” Appliedmathematical sciences, Vol. 3 (2009), Number 55, 2745-2755. |

 The DASP is composed of four parameters of (n1, n2, c1, c2) if t0 is specified. Here n1 and n2 are sample sizes of the first and second sample, whereas c1 and c2 are the acceptance numbers associated with the first and the second sample, respectively. Let λ be the unknown average life and λ0 be the specified average life. A lot is considered to be good if the true unknown average life is more than the specified average life.We assume that the lot size is large enough to use the binomial distribution to find the probability of acceptance of the lot. In this paper we have considered c1= 0 and c2= 2, ie. DASP (c1= 0 and c2= 2).Where, P = F (t, λ) = F (
 ) is the function CDF of the Rayleigh distribution and the Cumulative Distribution Function (CDF) is,F(t,λ) =
  t >0, λ >0Then,


 Abstract
 Reference
 Full-Text PDF
 Full-text HTML


