-
Paper Information
- Next Paper
- Previous Paper
- Paper Submission
-
Journal Information
- About This Journal
- Editorial Board
- Current Issue
- Archive
- Author Guidelines
- Contact Us
American Journal of Mathematics and Statistics
p-ISSN: 2162-948X e-ISSN: 2162-8475
2013; 3(4): 194-203
doi:10.5923/j.ajms.20130304.03
Percentiles Based Construction of Acceptance Sampling Plans for the Truncated Type-I Generalized Logistic Distribution
 Abstract
 Reference
 Full-Text PDF
 Full-text HTML
P. Rama Mohana Rao1, G. Srinivasa Rao2
1Department of Mathematics, JKC College, Guntur-522006, India
2Department of Statistics, Dilla University, Dilla, Po Box: 419, Ethiopia
Correspondence to: G. Srinivasa Rao, Department of Statistics, Dilla University, Dilla, Po Box: 419, Ethiopia.
| Email: |  |
Copyright © 2012 Scientific & Academic Publishing. All Rights Reserved.
In this article, acceptance sampling plans are developed for the truncated type-I generalized logistic distribution percentiles when the life test is truncated at a pre-specified time. The minimum sample size necessary to ensure the specified life percentile is obtained under a given customer’s risk. The operating characteristic values (and curves) of the sampling plans as well as the producer’s risk are presented. Two examples with real data sets are also given as illustration.
Keywords: Acceptance Sampling, Consumer’s Risk, Operating Characteristic Function, Producer’s Risk, Truncated Life Tests, Producer’s Risk
Cite this paper: P. Rama Mohana Rao, G. Srinivasa Rao, Percentiles Based Construction of Acceptance Sampling Plans for the Truncated Type-I Generalized Logistic Distribution, American Journal of Mathematics and Statistics, Vol. 3 No. 4, 2013, pp. 194-203. doi: 10.5923/j.ajms.20130304.03.
Article Outline
1. Introduction
- Acceptance sampling is concerned with inspection and decision making regarding products and is one of the oldest aspects of quality assurance. A typical application of acceptance sampling is as follows. A company receives a shipment of product from a vendor. This product is often a component or raw material used in the company’s manufacturing process. A sample is taken from the lot and some quality characteristic of the units in the sample is inspected. On the basis of the information in this sample, a decision is made regarding lot disposition. Usually, this decision is either to accept or to reject the lot. Accepted lots are put into production; rejected lots may be returned to the vendor or may be subjected to some other lot disposition action. While it is customary to think of acceptance sampling as a receiving inspection activity, there are other uses of sampling methods. For example, frequently a manufacturer will sample and inspect its own product at various stages of production. Lots that are accepted are sent forward for further processing, while rejected lots may be reworked or scrapped. For the purpose of reducing the test time and cost, a truncated life test may be conducted to determine the smallest sample size to ensure a certain mean life of products when the life test is terminated at a pre-assigned time
 , and the number of failures observed does not exceed a given acceptance number c.A sampling inspection plans in the case that the sample observations are lifetimes of products put to test aims at verifying that the actual population mean exceeds a required minimum. The population mean stands for the mean lifetime of the product, say
  . If
. If  is a specified minimum value, then one would like to verify that
  , this means that the true unknown population mean lifetime of the product exceeds the specified value. On the basis of a random sample of size n, the lot is accepted, if by means of a suitable decision criterion, the acceptance sampling plan decides in favor of
  . Otherwise the lot is rejected. The decision criterion is naturally based on the number of observed failures in the sample of, n products during a specified time
  from which a lower bound for the unknown mean lifetime is derived. If the observed number of failures is large, say larger than a number c, the derived lower bound is smaller than
  and the hypothesis
  is not verified. Hence, the lot cannot be accepted. Such a sampling plan is named Reliability test plan or Acceptance sampling plans on life tests.A common practice in life testing is to terminate the life test by a pre-determined time
  and note the number of failures (assuming that a failure is well defined). One of the objectives of these experiments is to set a lower confidence limit on the mean life. It is then to establish a specified mean life with a given probability of at least
  which provides protection to consumers. The decision to accept the specified mean life occurs if and only if the number of observed failures at the end of the fixed time
  does not exceed a given number ‘c’- called the acceptance number. The test may get terminated before the time
  is reached when the number of failures exceeds ‘c’ in which case the decision is to reject the lot. For such a truncated life test and the associated decision rule; we are interested in obtaining the smallest sample size to arrive at a decision. The acceptance sampling plans were developed based on the mean lifetime of items for assuring the quality and reliability of products. These type of acceptance sampling plans for truncated life tests can be found in Epstein[3], Sobel and Tischendrof[20], Goode and Kao[5], Gupta and Groll[7], Gupta[6], Fertig and Mann[4], Kantam and Rosaiah[8], Kantam et al.[9], Baklizi[1], Wu and Tsai[24], Rosaiah and Kantam[18], Tsai and Wu[22], Rao et.al.[15] and Rao et al.[16]. However, the sampling plans based on the population mean may not catch the specific percentile of product lifetime required for engineering design considerations. When the quality of interest is a low percentile, the sampling plans based on the population mean could pass the lot that has the low percentile below the pre-specified standard required by the customer. Therefore, engineers pay more attention to the percentile of lifetime than the mean life in life-testing applications. In view of this, recently more authors proposed the acceptance sampling plans based on percentile, see for example, Balakrishnan et al.[2], Lio et al.[11], Lio et al.[12], Rao and Kantam[14], Rao et al.[17] and Rao[13]. They argued that the sampling plans proposed at the mean life in a skewed distribution will pass out the product with lower percentiles. Gupta[6] also pointed that for a skewed distribution, median life as a quality parameter performs better than the mean lifetime. These reasons motivate to develop acceptance sampling plans based on the percentiles of the truncated type-I generalized logistic distribution under a truncated life test.The rest of the article is organized as follows. The proposed sampling plans are established for the truncated type-I generalized logistic percentiles under a truncated life test, along with the operating characteristic (OC) and some relevant tables, is given in Section 2. Two examples based on real fatigue life data sets are provided for the illustration in Section 3 and discussion and some conclusions are made in Section 4.
2. Acceptance Sampling Plans
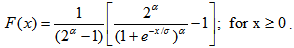
- Recently truncated type-I generalized logistic distribution (TTGLD) has been proposed by Rosaiah et al.[19] and they have studied estimation of scale parameter. The two-parameter truncated type-I generalized logistic distribution has the following density function
 | (1) |
 | (2) |
 and
and  are shape and scale parameters respectively. The survival and hazard functions of truncated type-I generalized logistic distribution are respectively given by
 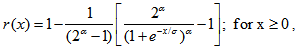 | (3) |
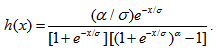 | (4) |
 and scale parameter
  will be denoted by TTGLD
 .Given
  the 100qth percentile (or the qth quantile) is given by
 | (5) |
 is increasing with respect to
  and q. Therefore, the 100qth percentile,
  , is depend upon
  . When q=0.5, then
  and
and  is also the median of truncated type-I generalized logistic distribution. Let
  . Then, Eq. (5) implies that
  | (6) |
 in the truncated type-I generalized logistic cdf is replaced by Eq. (6) and the truncated type-I generalized logistic cdf is rewritten as
  Letting
  , F(t) can be rewritten emphasizing its dependence on
  as
as .
. A common practice in life testing is to terminate the life test by a pre-determined time t, the probability of rejecting a bad lot be at least
 , and the maximum number of allowable bad items to accept the lot be c. The acceptance sampling plan for percentiles under a truncated life test is to set up the minimum sample size n for this given acceptance number c such that the consumer’s risk, the probability of accepting a bad lot, does not exceed 1-
 . A bad lot means that the true 100qth percentile,
  , is below the specified percentile,
  . Thus, the probability
  is a confidence level in the sense that the chance of rejecting a bad lot with
  is at least equal to
  . Therefore, for a given
  , the proposed acceptance sampling plan can be characterized by the triplet
  .
.2.1. Minimum Sample Size
- For a fixed
 our sampling plan is characterized by
  . Here we consider sufficiently large sized lots so that the binomial distribution can be applied. The problem is to determine for given values of
  (0 <
(0 < <1),
<1),  and c, the smallest positive integer, n required to assert that
  must satisfy
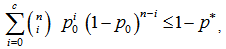 | (7) |
 is the probability of a failure during the time t given a specified 100 qth percentile of lifetime
  and depends only on
  , since
  is a non-decreasing function of
  . Accordingly, we have
  , Or equivalently,
  .The smallest sample size n satisfying the inequality (7) can be obtained for any given q,
  ,
,  and
and  . To save space, only the results of small sample sizes for q=0.1, =0.7, 0.9, 1.0, 1.5, 2.0, 2.5, 3.0, 3.5;
  =0.75, 0.90, 0.95, 0.99; c = 0, 1, 2, 3, 4, 5, 6, 7, 8, 9, 10 and
  =2 are reported in Tables 1.If
  is small and n is large the binomial probability may be approximated by Poisson probability with parameter λ = n p so that the left side of (7) can be written as
 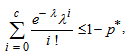 | (8) |
 . The minimum values of n satisfying (8) are obtained for the same combination of q,
  ,
,  and
and  values as those used for (7). The results are reported in Table 2.
2.2. Operating Characteristic of the Sampling Plan
- The operating characteristic (OC) function of the sampling plan
 is the probability of accepting a lot. It is given as
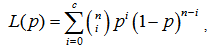 | (9) |
 . It should be noticed that
  can be represented as a function of
  . Therefore,
  where
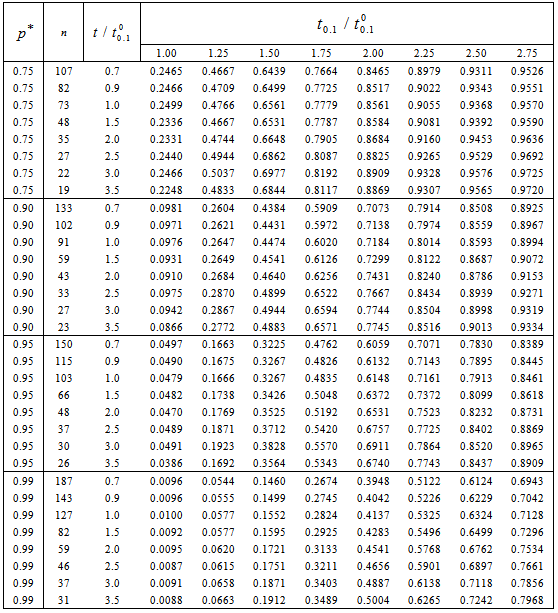
where  . Using Eq. (9), the OC values and OC curves can be obtained for any sampling plan,
  , and any
  . To save space, we present Tables 3 to show the OC values for the sampling plan
 with
with  =2. Figure 1 shows the OC curves for the sampling plan
 with
with  =0.90 for
  , where c = 0, 1, 2, 3, 4, 5, 6, 7, 8, 9, 10.
2.3. Producer’s Risk
- The producer’s risk is defined as the probability of rejecting the lot when
 . For a given value of the producer’s risk, say
  , we are interested in knowing the value of
  to ensure the producer’s risk is less than or equal to
  if a sampling plan
  is developed at a specified confidence level
  . Thus, one needs to find the smallest value
  according to Eq. (9) as
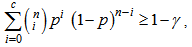 | (10) |
 ,
, . To save space, based on sampling plans
  established in Tables 1 the minimum ratios of
  for the acceptability of a lot under
  =2, at the producer’s risk of
  =0.05 are presented in Table 4.
 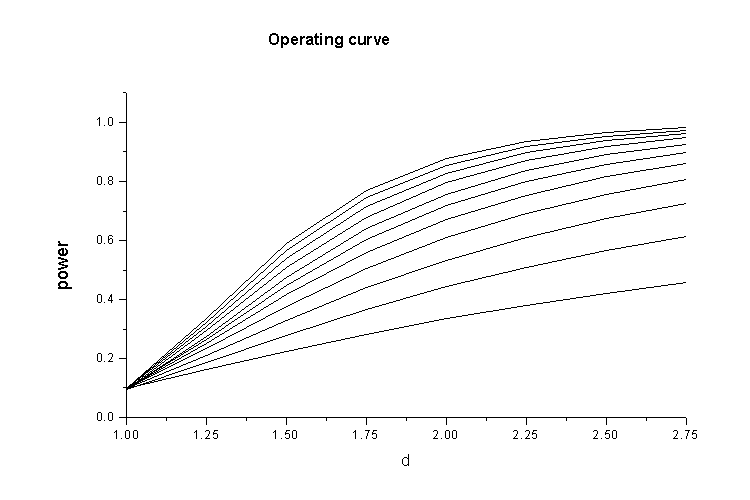 | Figure 1. OC curves for c = 0, 1, 2, 3, 4, 5, 6, 7, 8, 9, 10, respectively under =0.90, =0.90,  and and  , based on the 10th percentile, , based on the 10th percentile,  , of truncated type-I generalized logistic distribution , of truncated type-I generalized logistic distribution |
 , with probability
  and the corresponding acceptance number, c, for the truncated type-I generalized logistic distribution with
  using the binomial approximation
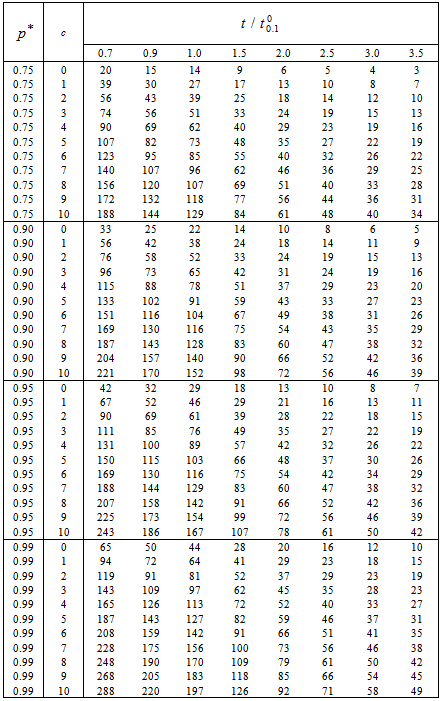
|
 , with probability
  and the corresponding acceptance number, c, for the truncated type-I generalized logistic distribution with
  using the Poisson approximation
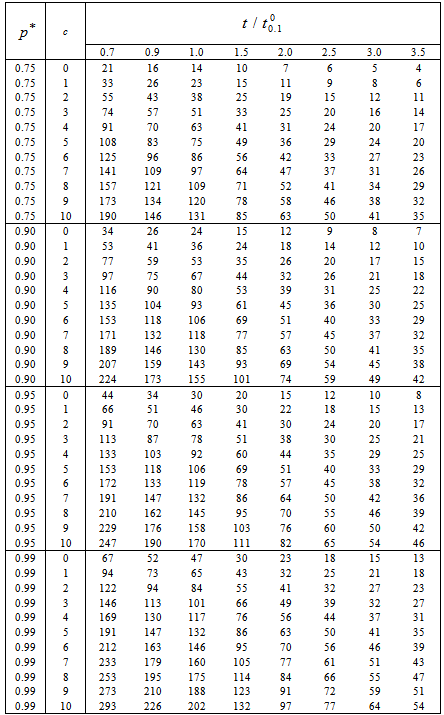
|
 for a given
  under truncated type-I generalized logistic distribution with
|
 for the acceptability of a lot for the truncated type-I generalized logistic distribution with
  and producer’s risk of 0.05
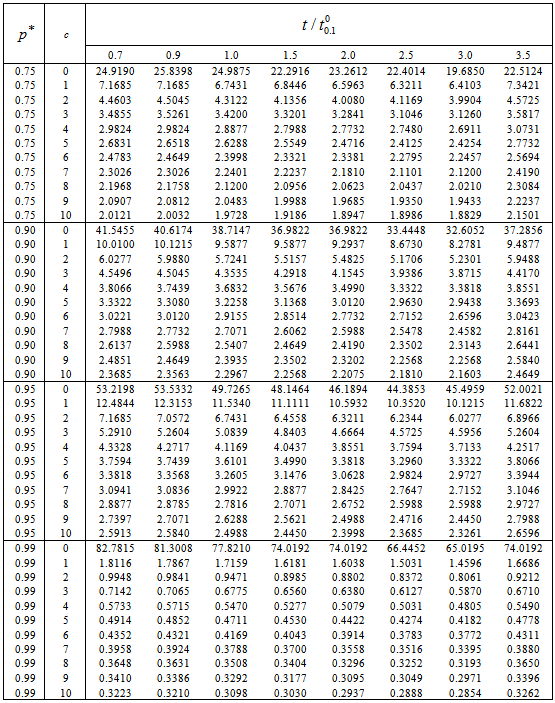
3. Illustrative Examples
- In this section, we consider two examples with real data sets are given to illustrate the proposed acceptance sampling plans. The first data set is of the data given arisen in tests on endurance of deep groove ball bearings ([10], p.28). The data are the number of million revolutions before failure for each of the 23 ball bearings in life test and they are: 51.84, 51.96, 54.12, 55.56, 67.80, 68.44, 68.64, 68.88, 84.12, 93.12, 98.64, 105.12, 105.84, 127.92, 128.04 and 173.40. The second data set regarding the software reliability was presented by Wood[23], analyzed via the acceptance sampling viewpoint by Rosaiah and Kantam[18], Balakrishnan et al.[2], Lio et al.[11] and Rao and Kantam[14]. The software reliability data set was reported in hours as 519, 968, 1430, 1893, 2490, 3058, 3625, 4422, and 5218. As the confidence level is assured by this acceptance sampling plan only if the lifetimes are from the truncated type-I generalized logistic distribution. Then, we should check if it is reasonable to admit that the given sample comes from the truncated type-I generalized logistic distribution by the goodness of fit test and model selection criteria. The first data set was used by Sultan[21] to demonstrate the goodness of fit for generalized exponential distribution. Balakrishnan et al.[2] compared the goodness of fits among the Rayleigh, generalized BS, and BS distributions for the software reliability data set presented here using probability plots and showed that the generalized BS model (R-square (RS) = 0.97) was slightly better than the BS model (RS = 0.96) and both models were much better than the Rayleigh model (RS=0.87). However, the acceptance sampling plans under the truncated life test based on the truncated type-I generalized logistic distribution for percentiles have not yet been developed. We have applied QQ plot and RS method to test the goodness of fit for both data sets for truncated type-I generalized logistic distribution and we got RS= 0.9811 for first data set and RS= 0.9896 for second data set. Hence, the truncated type-I generalized logistic distribution could also provide reasonable goodness of fits for both data sets.
3.1. Example 1
- Assume that the lifetime distribution is truncated type-I generalized logistic distribution with
 =2 and that the experimenter is interested to establish the true unknown 10th percentile lifetime for the ball bearings to be at least 20 million revolutions with confidence
  =0.75 and the life test would be ended at 50 million revolutions, which should have led to the ratio
  = 2.5. Thus, for an acceptance number c = 4 and the confidence level
  =0.75, the required sample size n found from Table 1 should be at least 23. Therefore, in this case, the acceptance sampling plan from truncated life tests for the truncated type-I generalized logistic distribution 10th percentile should be
  = (23, 4, 2.5). Based on the ball bearings data, the experimenter must have decided whether to accept or reject the lot. The lot should be accepted only if the number of items of which lifetimes were less than or equal to the scheduled test lifetime, 50 million revolutions, was at most 4 among the first 23 observations. Since there is no failure time less than or equal to 50 million revolutions in the given sample of n =23 observations, the experimenter would accept the lot, assuming the 10th percentile lifetime
  of at least 20 million revolutions with a confidence level of
  =0.75. The OC values for the acceptance sampling plan
  = (23,4,2.5) and confidence level
  =0.75 under truncated type-I generalized logistic distribution with
  =2 from Table 3 is as follows:
 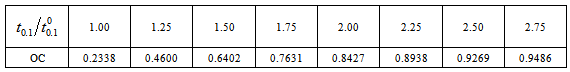 This shows that if the true 10th percentile is equal to the required 10th percentile (
 = 1.00) the producer’s risk is approximately 0.7662 (=1- 0.2338). The producer’s risk is almost equal to 0.0731 when the true 10th percentile is greater than or equal to 2.5 times the specified 10th percentile. From Table 4, the experimenter could get the values of
  for different choices of c and
  in order to assert that the producer’s risk was less than 0.05. In this example, the value of
  should be 2.8877 for c = 4,
  =1.0 and
  =0.75. This means the product can have a 10th percentile life of 2.8877 times the required 10th percentile lifetime in order that under the above acceptance sampling plan the product is accepted with probability of at least 0.95. Alternatively, assume that products have a truncated type-I generalized logistic distribution with
  =2, and consumers wish to reject a bad lot with probability of
  =0.75. What should the true 10th percentile life of products be so that the producer’s risk is 0.05 if the acceptance sampling plan is based on an acceptance number c=3 and
  =0.7? From Table 4, we can find that the entry for
  =2,
=2,  =0.75, c=3, and
  =0.7 is
  =3.4855. Thus, the manufacturer’s product should have a 10th percentile life at least 3.4855 times the specified 10th percentile life in order for the products to be accepted with probability 0.75 under the above acceptance sampling plan. Table 1 indicates that the number of products required to be tested is n=74 so that the sampling plan is
  = (74, 3, 0.7).
3.2. Example 2
- Suppose an experimenter would like to establish the true unknown 10th percentile lifetime for the software mentioned above to be at least 100h and the life test would be ended at 350 h, which should have led to the ratio
 =3.5. The goodness of fit test for these nine observations were verified and showed that truncated type-I generalized logistic model as a reasonable goodness of fit for these nine observations. Thus, with c=1 and
  =0.90, the experimenter should find from Table 1 the sample size n must be at least 9 and the sampling plan to be
  = (9, 1, 3.5). Since there were no items with a failure time less than or equal to 350h in the given sample of n =9 observations, the experimenter would accept the lot, assuming the 10th percentile lifetime
  of at least 100h with a confidence level of
  =0.90.
4. Discussion and Conclusions
- The acceptance sampling plans based on the truncated type-I generalized logistic population mean could have less chance to report a failure than the acceptance sampling plans based on 10th percentile. The acceptance sampling plans based on population mean could accept the lot of bad quality of the 10th percentiles. The minimum sample sizes are reported in Table 1 of this article for the 10th percentiles are compared with the minimum sample sizes are reported in Table 1 of Lio et al.[11] and Rao and Kantam[14]. It shows that the minimum sample sizes using truncated type-I generalized logistic population are smaller than those reported in Tables 1 of Lio et al.[11] whereas, the minimum sample sizes using truncated type-I generalized logistic population are smaller than those reported in Tables 1 of Rao and Kantam[14] for the 10th percentile when
 and larger than those reported in Tables 1 of Rao and Kantam[14] for log-logistic population for the 10th percentile when
 .This article has derived the acceptance sampling plans based on the truncated type-I generalized logistic percentiles when the life test is truncated at a pre-fixed time. The procedure is provided to construct the proposed sampling plans for the percentiles of the truncated type-I generalized logistic distribution with known parameter
  =2. To ensure that the life quality of products exceeds a specified one in terms of the life percentile, the acceptance sampling plans based on percentiles should be used. Some useful tables are provided and applied to establish acceptance sampling plans for two examples.
References
| [1] | Baklizi, A. (2003). Acceptance sampling based on truncated life tests in the Pareto distribution of the second kind. Advances and Applications in Statistics, 3(1), 33-48. |
| [2] | Balakrishnan, N., Leiva, V., Lopez, J. (2007). Acceptance sampling plans from truncated life tests based on the generalized Birnbaum-Saunders distribution.Communications in Statistics-Simulation and Computation, 36, 643-656. |
| [3] | Epstein, B. (1954). Truncated life tests in the exponential case. Annals of Mathematical Statistics, 25, 555-564. |
| [4] | Fertig, F.W. and Mann, N.R. (1980). Life-test sampling plans for two-parameter Weibull populations, Technometrics, 22(2), 165-177. |
| [5] | Goode, H.P., Kao, J.H.K. (1961). Sampling plans based on the Weibull distribution. Proceedings of Seventh National Symposium on Reliability and Quality Control, Philadelphia, pp. 24-40. |
| [6] | Gupta, S. S. (1962). Life test sampling plans for normal and lognormal distribution. Technometrics, 4, 151- 175. |
| [7] | Gupta, S.S., Groll, P.A. (1961). Gamma distribution in acceptance sampling based on life tests. Journal of the American Statistical Association 56, 942-970. |
| [8] | Kantam, R.R.L., Rosaiah, K. (1998) Half logistic distribution in acceptance sampling based on life tests. IAPQR Transactions 23,117-125. |
| [9] | Kantam, R.R.L., Rosaiah, K., Rao, G.S. (2001). Acceptance sampling based on life tests: Log-logistic model. Journal of Applied Statistics, 28(1),121-128. |
| [10] | Lawless. J.F. (1982). Statistical Models and Methods for Lifetime Data. New York: John Wiley & Sons. |
| [11] | Lio, Y.L., Tsai, T.-R., Wu, S.-J. (2010a). Acceptance sampling plans from truncated life tests based on the Birnbaum-Saunders distribution for percentiles. Communications in Statistics-Simulation and Computation, 39,119-136. |
| [12] | Lio, Y.L., Tsai, T-R and Wu, S-J. (2010b). Acceptance sampling plans from truncated life tests based on the Burr type XII percentiles, Journal of the Chinese Institute of Industrial Engineers, 27 (4), 270-280. |
| [13] | Rao, G.S. (2013). Acceptance sampling plans for percentiles based on the Marshall-Olkin extended Lomax distribution, International Journal of Statistics and Economics, 11(2), 83-96. |
| [14] | Rao, G.S., Kantam, R.R.L. (2010). Acceptance sampling plans from truncated life tests based on the log-logistic distribution for percentiles. Economic Quality Control, 25(2): 153- 167. |
| [15] | Rao, G.S., Ghitany, M.E., Kantam, R.R.L. (2008). Acceptance sampling plans for Marshall-Olkin extended Lomax distribution. International Journal of Applied Mathematics, 21(2): 315-325. |
| [16] | Rao, G.S., Ghitany, M.E., Kantam, R.R.L. (2009). Reliability Test Plans for Marshall-Olkin extended exponential distribution. Applied Mathematical Sciences, 3, No. 55: 2745-2755. |
| [17] | Rao, G.S., Kantam, R.R.L., Rosaiah, K. and Reddy, J.P. (2012). Acceptance sampling plans for percentiles based on the Inverse Rayleigh Distribution, Electronic Journal of Applied Statistical Analysis, 5(2), 164-177. |
| [18] | Rosaiah, K., Kantam, R.R.L. (2005). Acceptance sampling based on the inverse Rayleigh distribution. Economic Quality Control, 20: 277-286. |
| [19] | Rosaiah, K., Kantam, R.R.L., Rao, G.S., Rao, P.M. (2009). Estimation in truncated type-I generalized logistic distribution. International Journal of Agricultural Statistical Sciences, 5(2), 317-325. |
| [20] | Sobel, M., Tischendrof, J.A. (1959). Acceptance sampling with sew life test objective. Proceedings of Fifth National Symposium on Reliability and Quality Control, Philadelphia, pp. 108-118. |
| [21] | Sultan, K.S. (2007). Order statistics from the generalized exponential distribution and applications. Communications in Statistics-Theory and Methods, 36: 1409-1418. |
| [22] | Tsai, T.-R., Wu, S.-J. (2006). Acceptance sampling based on truncated life tests for generalized Rayleigh distribution. Journal of Applied Statistics 33:595-600. |
| [23] | Wood, A. (1996). Predicting software reliability, IEEE Transactions on Software Engineering, 22: 69-77. |
| [24] | Wu, C.-J., Tsai, T.-R. (2005). Acceptance sampling plans for Birnbaum-Saunders distribution under truncated life tests. International Journal of Reliability, Quality and Safety Engineering, 12:507-519. |