Jahar L Bhowmik
Faculty of Life and Social Sciences, Swinburne University of Technology, Melbourne, 3122, Australia
Correspondence to: Jahar L Bhowmik , Faculty of Life and Social Sciences, Swinburne University of Technology, Melbourne, 3122, Australia.
| Email: |  |
Copyright © 2012 Scientific & Academic Publishing. All Rights Reserved.
Abstract
In the context of the linear regression model in which some regression coefficients are of interest and others are purely nuisance parameters, we derive the density function of a maximal invariant statistic after eliminating the nuisance parameters by the principle of invariance argument. This allows the construction of a range of optimal test statistics including the locally best invariant (LBI) test which is equivalent to the well-known one-sided t-test. The resultant LBI test is also found to be uniformly most powerful invariant (UMPI).
Keywords:
Invariance, Maximal Invariant Statistic, Nuisance Parameters, t-Test, Uniformly Most Powerful Invariant (UMPI)
Cite this paper: Jahar L Bhowmik , Constructing Locally Best Invariant Tests of the Linear Regression Model Using the Density Function of a Maximal Invariant, American Journal of Mathematics and Statistics, Vol. 3 No. 1, 2013, pp. 45-52. doi: 10.5923/j.ajms.20130301.07.
1. Introduction
This paper is concerned with the problem of testing the null hypothesis that one regressor coefficient is zero, against the alternative that it is non-negative, in the context of linear model. Statistical models and particularly those used by econometricians, involve a large number of influences. These kinds of models contain two types of parameters, those of interest and those not of immediate interest that are known as nuisance parameters. Their presence can cause unexpected complications in statistical inference.Kalbfleisch and Sprott[6] discussed methods of eliminating nuisance parameters from the likelihood function so that inference can be made about the parameters of interest. Bhowmik and King[7] used invariance arguments in order to deal with nuisance parameters and derived maximal invariant likelihoods for semi-linear regression models with the aim of testing for the inclusion of regressors (either linear or non-linear) in linear or semi-linear models.In practice, many statistical problems including testing of hypotheses, display symmetries, which impose additional restrictions for the choice of proper statistical procedure. In the statistical testing literature the idea of invariance dates back half a century. Among others, Lehmann[3,4,5], King[10,12,13], and Bhowmik and King[7,8,9] suggested the use of invariance arguments to overcome the problem of nuisance parameters. It is a generally accepted principle that if a problem with a unique solution is invariant under a certain group of transformations, then the solution should be invariant under those transformations. A hypothesis testing problem is invariant under a group of transformations acting on the sample space of the observed data vector if for any transformation the probability distribution of transformed data vector belongs to the same set (null or alternative hypothesis) as the original data vector. The idea behind invariance is that if the hypothesis testing problem under consideration has a particular invariance property, then we should restrict attention to only those tests that share this invariance property. The class of all invariant functions can be obtained as the totality of functions of a maximal invariant. A maximal invariant is a statistic which takes the same value for the observed data vectors that are connected by transformations and different values for those data vectors that are not connected by transformations. Consequently any invariant test statistic can be written as a function of the maximal invariant. This means, we can treat the maximal invariant as the observed data, find its density and then construct appropriate tests based on this density.The performance of a statistical test is assessed by its size and power properties. Econometricians are always interested in optimality of power and for any testing problem they would like to use a uniformly most powerful (UMP) test. Many testing problems involving the linear regression model can be reduced, either by conditioning on sufficient statistics or by invariance arguments to testing a simple null hypothesis against one sided alternatives. Ideally we would then like to use a UMP test but unfortunately it is rarely possible to find a UMP test when the alternative hypothesis is composite and/or in the presence of nuisance parameters. Cox and Hinkley[2] discuss three approaches for constructing tests of simple hypotheses against composite alternative hypotheses when no UMP test exits. They involve choosing a point at which the power is optimised:(i) “to pick, somewhat arbitrarily, a ‘typical’ point” in the alternative parameter space and use it in test construction in order to find a test that at least has optimal power for the chosen point;(ii) removing this arbitrariness by choosing a point to be close to the null hypothesis which leads to the locally best (LB) test, i.e. to maximize the power locally near the null hypothesis;(iii) choosing a test which maximizes some weighted average of the powers over the alternative parameter space.Option (i), labelled by King[15] as the point optimal (PO) approach, uses the most powerful test against a specific alternative solution. Option (ii) is the most popular for a single parameter and leads us to a LB or a locally most powerful test. These tests are constructed by maximizing power locally at the null hypothesis. The LB test is also optimal in the sense that its power curve has the steepest slope, at the null hypothesis, of all power curves from tests with the same size. Following Neyman and Pearson[10], a number of authors, notably Ferguson[21], Efron[1], King[16,17], King and Hillier[18] and Wu and King[19] among others, have recommended the use of LB tests.Our interest in this paper is to derive the density function of the maximal invariant statistic in the context of linear regression model and then construct a locally best invariant test for linear regressors, which is called the Locally Best Invariant (LBI) test. Also we show that this LBI test is equivalent to the one-sided t-test in the case of testing linear regression coefficients.The plan of this paper is as follows. First of all we derive the density function of the maximal invariant statistic in section 2 and in section 3 we construct the LBI test statistic which is shown to be equivalent to the one-sided t-test. Finally, some concluding remarks are made in section 4.
2. The Density Function
Let us consider the linear model,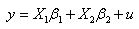 | (1) |
where  is
is  is an
is an  nonstochastic matrix,
  is an
is an  nonstochastic matrix,
  is a
is a  vector and
  vector. Here
  is a full column rank matrix.Considering first the case of
  , our interest is in testing
  against
  in the context of the above linear regression model. It is assumed that
  where
where  is unknown. This problem is invariant under the class of transformations
 | (2) |
where  is a positive scalar and
  is a
is a  vector.Let
 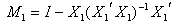 and
and  be any
  matrix such that
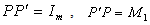 where
where  .Multiplying both sides of (1) by
  and noting that
  and
and  we get
  .Thus
.Thus  Then the joint density function of z is
 | (3) |
Let  be the usual squared distance of
  from the origin. Now, we change
  to the m-dimensional polar co-ordinates
  as follows:
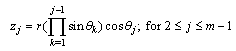 | (4) |
 where
where 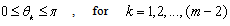 and
and .The Jacobian of the transformation is
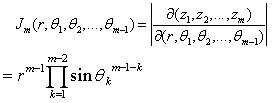 Note tha
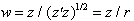
 .Now the joint density function of z becomes, after the above change of variables,
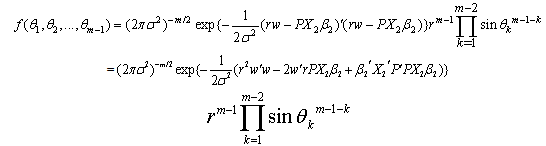 | (5) |
To find the density function of  from the above joint density function of
  , first we have to find the marginal density function of
 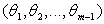 . The components of
  are
are  and they are defined by equation (4). Therefore the marginal density function of
  is
is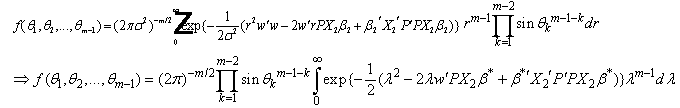 | (6) |
where 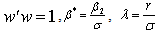 , and
, and  . If weset
 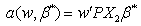 | (7) |
 | (8) |
and  is sum of squared errors of the OLS regression of
  on
on  and
and | (9) |
Using Mathematica (see[21]) we found that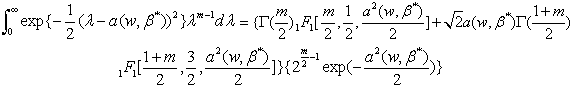 where
where is the confluent hyper-geometric Function, which has the form
 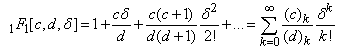 | (10) |
Therefore the marginal density function of  is,
is,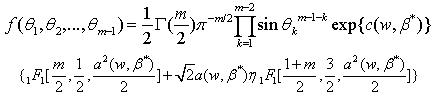 | (11) |
where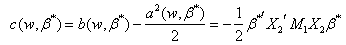 | (12) |
 | (13) |
Now the transformation from  is straightforward since the components of w are defined by equation (4).Therefore the density function of w is,
 | (14) |
where  and
and  are defined by equations (12) and (13). Using this density function we can construct the LBI test statistic for testing
  .
.
3. Construction of the Test
We are interested in testing the hypothesis  against
  in the context of the linear regression model given in equation (1). Let us first consider
  , i.e.
  is a scalar. A LBI test of
  against
  is that with critical region of the form
  | (15) |
The density function of the maximal invariant w is given by equation (14). Taking logs on both sides of equation (14) we get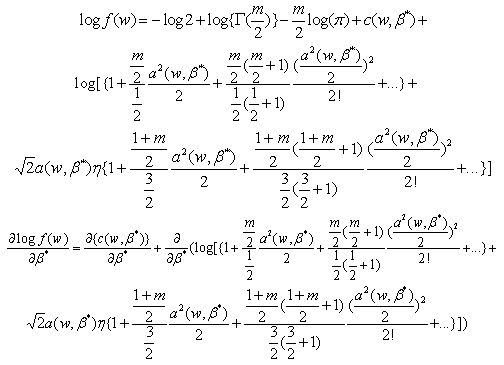 where
where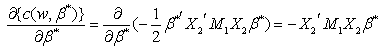 and
and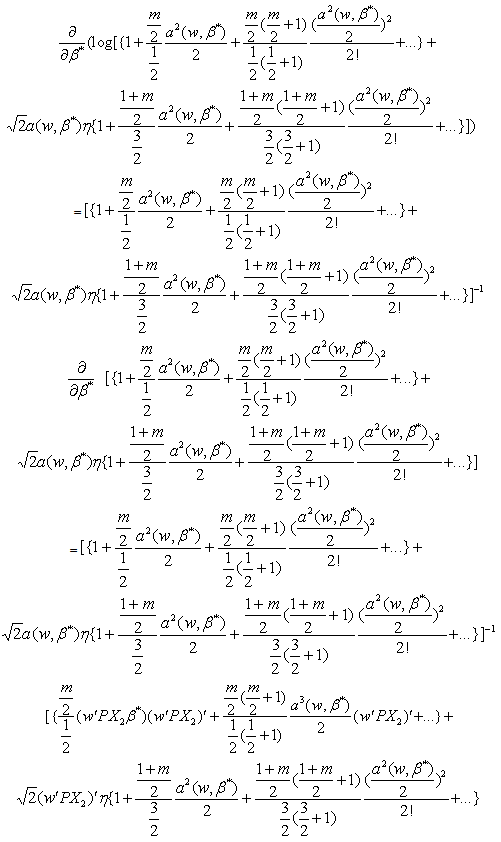
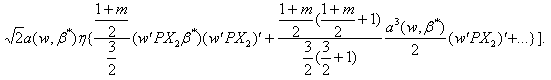 Now
Now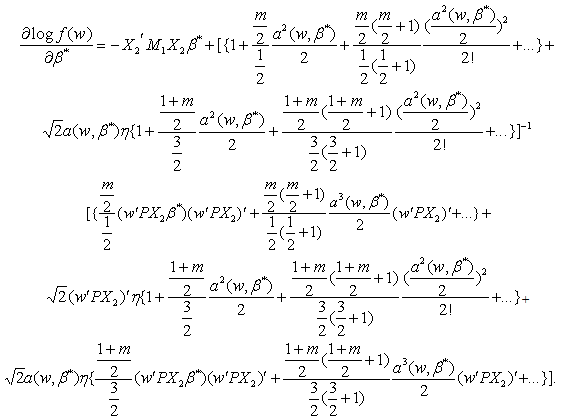 Note that because
 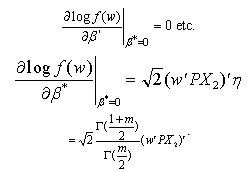 Hence the LBI test rejects
  for
for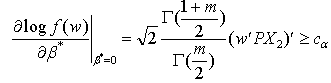 | (16) |
or 
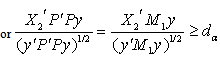 | (17) |
where  is an appropriate critical value.Therefore
  is the LBI test statistic.
3.1. Relationship between the t-test and the LBI Test
From the above discussion we can say that the LBI test rejects  for large values of
  | (18) |
for testing  against
 in the linear model defined by equation (1) if
 is a vector , i.e.
  .The ordinary least squares (OLS) estimator of
  in equation (1) is
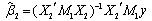 and the unbiased OLS estimator of the error variance is
  .Thus the
  test statistic is
 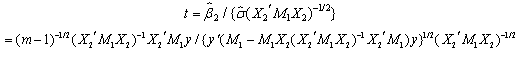 or
or | (19) |
where  is a positive scalar. So, clearly equation (19) is a monotonic increasing function of the test statistic s. Therefore we may conclude that the LBI test
  is equivalent to the t-test.
3.2. The LBI Test Statistic is UMPI
We have 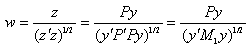 | (20) |
Replacing equation (20) and equation (18) in equation (14) we get,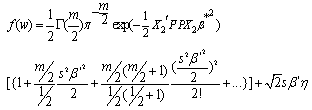
 | (21) |
We observe that equation (21) is a monotonic increasing function of s. Since the density function of the maximal invariant statistic is a monotonic increasing function of the LBI test s, there exists therefore a UMPI test of  against
  . Hence the LBI test statistic s is a UMPI test.
4. Conclusions
In this paper, having derived the density function of the maximal invariant statistic, an LBI test is constructed in the linear regression model against one-sided alternatives. The principle of invariance is used to eliminate nuisance parameters in multi-parameter one-sided testing problems. This allows the construction of the LBI test. The resultant LBI test is found to be UMPI and equivalent to the one-sided t-test.
ACKNOWLEDGEMENTS
I am grateful to Max L. King, Rob J. Hyndman and Simone D. Grose for their helpful suggestions. An earlier version of this paper was presented at the 2012 Australian Statistical Society Conference held in Adelaide, Australia.
References
| [1] | D. Efron,Defining the Curvature of a Statistical Problem (with Application to Second Order Efficiency), The Annals of Statistics 3 (1975), 1189-1242. |
| [2] | D.R. Cox and D.V. Hinkley, Theoretical Statistics, London: Chapman and Hall(1974). |
| [3] | E.L. Lehmann, Optimum invariant tests, Annals of Mathematical Statistics30 (1959), 881-884. |
| [4] | E.L. Lehmann, Testing Statistical Hypotheses, Wiley, New York(1959). |
| [5] | E.L. Lehmann, Testing Statistical Hypotheses, Sec. Edn. Wiley, New York(1986). |
| [6] | J.D. Kalbfleisch and Sprott, D.A., Application of Likelihood Methods to Models Involving Large Numbers of Parameters, Journal of the Royal Statistical Society B 32 (1970), 175-208. |
| [7] | J.L. Bhowmik and M.L. King, Maximal invariant likelihood based testing of semi-linear models,Statistical Papers48 (2007), 357-383. |
| [8] | J.L. Bhowmik and M.L. King Bhowmik, Parameter estimation in semi-linear models using a maximal invariant likelihood function, Journal of Statistical Planning and Inference, 139 (2009), 1276-1285. |
| [9] | J.L. Bhowmik and M.L. King, Deriving tests of the semi-linear regression model using the density function of a maximal invariant.Journal of Statistical Theory and Practice, 6 (2012), 251-259. |
| [10] | J. Neyman and E.S. Pearson, Contribution to the Theory of Testing Statistical Hypotheses. I. Unbiased Critical Regions of Type A and Type A1, Statistical Research Memoirs 1 (1936), 1-37. |
| [11] | K.S. Miller, Multidimensional Gaussian Distributions,John Wiley and Sons, New York (1964). |
| [12] | M.L. King, Robust tests for spherical symmetry and their application to least squares regression, The Annals of Statistics 8 (1980), 1265-1271. |
| [13] | M.L. King, Testing for autoregressive against moving average errors in the linear regression model, Journal of Econometrics 21 (1983), 35-51. |
| [14] | M.L. King, Jointone-sided tests of linear regression coefficients, Journal of Econometrics, 32 (1986), 367-383. |
| [15] | M.L. King, Towards a theory of point optimal testing, Econometric Reviews 6 (1987), 169-218. |
| [16] | M.L King, A Small Sample Property of the Cliff-Ord Test for Spatial Correlation, Journal of Royal Statistical Society B 43 (1981), 263-264. |
| [17] | M.L King, An Alternative Test for Regression Coefficient Stability, Review of Econometrics and Statistics, 69 (1987), 379-381. |
| [18] | M.L. King and G.H. Hillier, Locally Best Invariant Tests of the Error Covariance Matrix of the Linear Regression Model, Journal of Royal Statistical Society B 47 (1985), 98-102. |
| [19] | P.X. Wu and M.L. King, One-sided hypothesis testing in econometrics: A survey, Pakistan Journal of Statistics, 10 (1994), 261-300. |
| [20] | S. Wolfram, Mathematica, A System for Doing Mathematics by Computer, Sec. Edn. Addison-Wesley Publishing Company (1993). |
| [21] | T.S. Ferguson, Mathematical Statistics: A Decision Theoretic Approach, New York: Academic Press (1967). |
 Abstract
 Reference
 Full-Text PDF
 Full-text HTML