-
Paper Information
- Paper Submission
-
Journal Information
- About This Journal
- Editorial Board
- Current Issue
- Archive
- Author Guidelines
- Contact Us
American Journal of Mathematics and Statistics
p-ISSN: 2162-948X e-ISSN: 2162-8475
2013; 3(1): 1-16
doi:10.5923/j.ajms.20130301.01
Multilevel Modelling of Modern Contraceptive Use among Rural and Urban Population of Ethiopia
 Abstract
 Reference
 Full-Text PDF
 Full-text HTML
Tilahun Ferede
Department of Statistics, ArbaMinch University, 21, Arba Minch, Ethiopia
Correspondence to: Tilahun Ferede, Department of Statistics, ArbaMinch University, 21, Arba Minch, Ethiopia.
| Email: |  |
Copyright © 2012 Scientific & Academic Publishing. All Rights Reserved.
The present data set has a two-level hierarchical structure, with over 16,700 women nested within eleven geographical regions in Ethiopia. The bivariate analysis result showed that Place of residence, Working status, exposure to media messages, educational status, and women religion had shown a significant variation. Women use of contraceptive was also considerably varied among regions in the preliminary bivariate analysis. In Ethiopia, Women desire for more children was found to be the main reason that woman’s do not practice contraceptives. Because of Our response variable is a binary indicator of whether a woman uses modern contraceptives we are restricted to model the probability of a women’s use of contraceptive with its odd. Accordingly, from the multilevel logistic regression model it was found that all the three models are found to be significant indicating that there is real multilevel variation among contraceptive users in Ethiopia. The deviance-based chi-square value is significant for multilevel random intercept model implies that in comparison to the model with multilevel random intercept and fixed slope model the multilevel random intercept and random coefficients model has a better fit. This further implied that multilevel logistic regression model is best fit over the ordinary multiple logistic regression models, further from the model fit diagnostics statistics, Deviance, AIC and BIC presented on Table 2. We can see that the model fit statistics values for random intercept are much smaller than the other multilevel models therefore the random coefficient model best fits the data in comparison with other multilevel models. From the random coefficient estimates for intercepts and the slopes vary significantly, which implies that there is a considerable variation in the effects of religion, place of residence and radio messages, these variables also found to differ significantly across the regions. The variance component for the variance of intercept in the random slope model is large compared to its standard error. Thus, there remains some regional-level variance unaccounted for in the model. Generally, this study revealed that socio-economic, demographic and proximate variables are important factors that affect contraceptives use in Ethiopia. In line with this regional differentials shows that women in more urbanized regions such as Addis Ababa, Dire Dawa, and Harari are more likely to use modern contraceptives than respondents in regions that are more rural. The effect of regional variations for religion, place of residence and radio messages further implies that there exist considerable deference in modern contraceptive use among regions and a model with a random coefficient or slope is more appropriate to explain the regional variation than a model with fixed coefficients or without random effects. As there is variation and differences in use of Modern contraceptives across regions in Ethiopia, it is recommended to balance the effect of those factors across rural regions in Ethiopia. Researchers should use multilevel models than traditional regression methods when their data structure is hierarchal as like in EDHS data.
Keywords: High Fertility, Modern Contraceptives, Heterogeneity, Regional Variations, EDHS, Multilevel Logistic Regression Models, Ethiopia
Cite this paper: Tilahun Ferede, Multilevel Modelling of Modern Contraceptive Use among Rural and Urban Population of Ethiopia, American Journal of Mathematics and Statistics, Vol. 3 No. 1, 2013, pp. 1-16. doi: 10.5923/j.ajms.20130301.01.
Article Outline
1. Introduction
- Ethiopia is the second-largest country in Africa, with an estimated population of nearly 79 million and a growth rate of 2.6 percent per year. Ethiopia is a predominantly rural and young society, with 84 percent living mainly in densely populated highland settlements. While the urban population is growing at around 4 percent per year, the rural population is still growing at around 2.3 percent. The proportion of the population under age 15 is 45 percent, with only 3.2 percent above age 65 as in[1]. The Government of Ethiopia is giving greater attention to demographic actors in formulating multisectoral development strategies, and has recognized population growth as one of the main challenges to poverty reduction. Intensified efforts are being made to implement the 2005-2010 Plan for Accelerated and Sustained Development to End Poverty/PASDEP, including reducing the total fertility rate (TFR) to 4 lifetime births per woman by 2010 and closing the gap between boys’ and girls’ education. These efforts are driven in part by concerns over food insecurity, population pressure on the land, low incomes in rural areas, and youth unemployment in urban areas as in[2].Contraceptive use is seen as pivotal to protecting women’s health and rights, influencing upon fertility and population growth, and promoting economic development particularly in much of sub-Saharan Africa. Globally, contraceptives help prevent an estimated 2.7 million infant deaths and the loss of 60 million years of healthy life as in[3]. Over the past 30 years the use of family planning methods has increased dramatically in the developing world, leading to a fall in fertility rates. Yet there are still significant levels of demand for family planning that are unmet. If this unmet need were met, unintended pregnancies would be fewer, women’s health and lives would be improved, and the consequent impact on fertility would result in lower population growth and measured development benefits as in[4].With the expansion of the family planning programme and the continuing wide gap between the set target and actual achievement of the family planning programme, there has been considerable interest in determining what factors influence women’s decision to use contraception. Several research studies in Ethiopia have revealed a number of relevant socio-economic, demographic and cultural factors. However, most studies used bivariate analysis to determine the relationship of two variables rather than multiple variables, and most of them done were based on restricted samples, limited data, or inadequate methodology. Thus the previous studies on modern contraceptive use may not be representatives for the whole country; hence it is important to consider representative survey data which might represent the whole country.Studies showed that satisfying women’s need for family planning reduces the total fertility rate (TFR) by a considerable amount as in[5,6,7]. In Ethiopia, meeting the demand for family planning is likely to lead to achieving one of the fifth Millennium Development Goal (MDG) as an indicator for tracking progress on improving maternal health national population policy objectives, i.e., reducing the total fertility rate (TFR) to 4.0 children per woman in 2015. Moreover, meeting unmet need for family planning would avert unwanted or mistimed pregnancies and thereby reduce unsafe abortion as in[8,9]. It is also likely to prevent high-risk births as in[10,11]. Ethiopia is one of the developing countries where population issue has become a major area of concern during the last few decades. The country began family planning services through Family Guidance Association of Ethiopia, established in 1966. However, the fertility regulation efforts made so far in Ethiopia through Family Guidance Association and other organizations are minimal as in[12]. Ethiopian Demographic and Health Survey of 2005 report revealed that knowledge of contraception has remained consistently high in Ethiopia over the past five years with 88% of currently married women having heard of at least one method of contraception. However, actual contraceptive practice among women of reproductive age group remained very low as in[13]. This high knowledge with low utilization rate is mainly because of different barriers to decision on use of contraceptives.In 1993, an explicit National Population Policy was adopted by the government of Ethiopia with an objective of harmonizing the country’s population growth rate with that of the economy to improve the well-being of Ethiopia’s people as in[14]. However, the country’s total fertility rate (TFR) from 1970 to 1975 was 6.8, and this number did not change between 1995 and 2000 as in[15]. The TFR has remained well above the mean ideal number of children of 4.8 as in[16]. With low use of family planning, fertility has remained high in the last decades. According to the first national survey on fertility and family planning in 1990, only 29 percent of currently married women were using FP methods, of which fewer than 27 percent were using modern methods (CSA, 2011). The contraceptive prevalence rate (CPR) though remains low, it has doubled in the last decade and by 2000 it was estimated at 8 percent using all methods and 6 percent using modern methods as in[17].There have not been many studies conducted on modelling of determinants of modern contraceptive use in Ethiopia. The few studies done were based on restricted samples, limited data, or inadequate methodology. Thus the previous studies on modern contraceptive use may not be representatives for the whole country, Despite its importance, very few population-based studies have been carried out in Ethiopia regarding determinants of Contraceptive use in Ethiopia as in[18, 9, 19, 20]. Most Contraceptive studies in the country have been institution-based as in[18]. Most of the population-based studies were small-scale research, focusing on a handful of communities, it is important to examine the factors that may explain this regional variation. Besides being able to identify variation at different levels of the hierarchy, multilevel models also, enable the investigation of effects of variables measured at different hierarchical levels.
2. Statement of the Problem
- It is believed that fertility decline continues if the wider use of contraception continues in all levels and groups of peoples. It is critical for family planning workers to continue to meet the needs of existing contraceptive users, and also to address barriers for contraceptive users in the society since, individual tastes, interests, behaviors, etc. differ from one unit to another within each level, owing to variability among various socioeconomic and geographical factors such as religion, culture, income, place of residence, education, occupation, mass media access, administrative and social facilities, and so on. That is why their efforts and approaches do not seem to be equally effective, evenly served or acknowledged in the some areas. This is an indicator for the effectiveness of the program to vary considerably.Most Contraceptive studies in the country have been institution-based and are small-scale research, focusing on a handful of communities, usually small-sized rural communities. Their geographic scope limits the applicability of their result on a large scale, particularly considering the complex multi-regional and multi-ethnic setting of Ethiopia. In addition, most do not control for important confounding variables, drawing from a nationally representative survey.It is necessary to assess the within-group and between-group level variation, and to estimate the true effect of the above-mentioned factors on multilevel determinants of Contraceptive use in order to implement more effective future family planning policies that target particular units at various levels of the hierarchy. The extent of acceptance of contraceptive methods varies within societies and among different clusters and religious groups. The factors responsible for the variation are at different hierarchy (individual, family (cluster), and community (regional levels), embedded in socio-economic, demographic and cultural Society of Ethiopia. Therefore, this study has been motivated to address the identified research gaps by answering the following research questions:i. What are the key factors that affect use of modern contraceptive methods at each level within each region? ii. To what extent does contact with family planning workers and visiting health centres affect modern contraceptive.iii. How much of the variation of usage is accounted for regional level and women level?iv. How important is this factor in relation to other socio-economic, demographic and cultural factors?
3. Objective of the Study
- The main purpose of this study is to model determinants of modern contraceptive use among rural and urban population of Ethiopia using multilevel modelling approach. The Specific objectives are:1. To identify socioeconomic, demographic and cultural determinant associated with use of modern contraceptives.2. To investigate how covariates (Socio-economic, demographic and proximate variables) measured at different levels of a hierarchical structure affect modern contraceptive use in of Ethiopia.3. To compare variations due to the random effects (religion, place of residence and effect of radio messages) at women and regional levels.4. To determine within and between regional differences in Contraceptive use by accounting for regional variation.5. To compare results from traditional (single level) and multilevel approach in identifying determinants of contraceptive use.6. To provide relevant recommendations for policy makers and suggest directions for future studies.
4. Data and Methodology
4.1. Data Source
- This study used the 2011 Ethiopia Demographic and Health Survey as in[22]. The 2011 EDHS was conducted under the aegis of the ministry of health and was implemented by the Central Statistical Agency and partner organizations from September 2010 through June 2011 with a nationally representative sample of nearly 18,500 households. All women age 15-49 and all men age 15-59 in these households were eligible for individual interview.The sample for the 2011 EDHS was designed to provide population and health indicators at the national and regional levels. The sampling frame used for the 2011 EDHS was the Population and Housing Census conducted by the Central Statistical Agency (CSA) in 2007. The 2011 EDHS sample was selected using a stratified, two-stage cluster design, and EAs were the sampling units for the first stage sampling. The 2011 EDHS sample included 624 EAs, 187 in urban areas and 437 in rural areas.Households comprised the second stage of sampling. A complete listing of households was carried out in each of the 624 selected EAs from September 2010 through January 2011. A representative sample of 17,817 households was selected for the 2011 EDHS survey. Because the sample is not self weighting at the national level, all data in this report have been weighted unless otherwise specified.
4.2. Variables Considered in the Study
- The variable considered in this study includes both the dependent variable and the independent variable which affect women use of modern contraceptives in Ethiopia.
4.2.1. Dependent Variable
- The outcome variable in this study is use of modern contraception (MCU). All currently-married women in the sample were asked whether they are currently using modern contraceptives or not. Hence, all pregnant women are considered as the non-users in this study. Thus, for the study purpose the response variable modern contraceptive use (MCU) is recoded as follows, those women currently using modern contraceptive are coded as 1 and those who are not currently using modern contraceptive are coded as 0. A woman is characterized as modern method user if she uses Pill, IUD, Injectables, condom, or LAM.
4.2.2. Explanatory Variables/Factors
- The primary choice of explanatory variables for this study was based on literature reviews on the factors influencing modern contraceptive uses at the global level and in the country. Therefore, those variables, which are reviewed from literature as determinants of modern contraceptive uses (MUC), are classified into demographic, socioeconomic and other proximate variables.
4.2.2.1. Demographic Variables
- A demographic characteristic of woman which affects the use of modern contraceptives includes, age of a woman, number of living children, age at first marriage, urban-rural residence, region of residence and marital status of a woman.
4.2.2.2. Socio-Economic Variables
- As socio-economic factors the following variables are included in the model, economic status (wealth index), Religious belief, Employment status of a women (working or not working), Women’s education, and Exposure to mass media.
4.2.2.3. Other Proximate (Health Related) Variable
- As proxy indicators, the following variables are included: Knowledge of any method, Women’s approval of FP, Husband’s approval of FP, Discussed family planning (FP) with partner, visited by family planning worker, and told of family planning.
5. Multilevel Logistic Regression
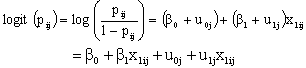
- Multilevel statistical techniques can be used to predict a binary dependent variable from a set of independent variables. It can be employed in the simplest case without explanatory variables (usually called the empty model) and also with explanatory variables by allowing only the intercept term or both the intercept and slopes (regression coefficients) to vary randomly, and the coefficients are assumed to follow a multivariate normal.To keep the discussion on multilevel logistic regression models simple and taking into account the data to be analysed in this study we concentrate on the case of two-levels. We note that extensions to the case of three or higher levels is straightforward (see Snijders and Bosker, 1999). In this study the basic data structure of the two-level logistic regression is a collection of N groups (regions) and within-group j ( j =1, 2,…, N) a random sample of
 level-one units (Women). The outcome variable, use of maternal health care service, is dichotomous and is denoted by
  (not using the service) and
  (using the service) for women i in region j (i=1, 2,…,
  , j=1, 2, …, N). For the proper application of multilevel analysis, the first logical step is to test heterogeneity of proportions between the groups or regions. For this purpose we use two tests: a chi-square based nonparametric test and a parametric test. The parametric test will be discussed in the subsequent sections. In this section, we present the nonparametric test. To test whether there are indeed systematic differences between the groups, the well-known chi-square test for contingency table can be used. First, we consider the chi-square test and then discuss the results we obtain based on the test. The test statistic is
 | (1) |
 the proportion of women who are using maternal health service in region j,
 | (2) |
 This statistic (
 chi-square statistic) follows approximately central chi-square distribution with N −1 degrees of freedom. Further note that
  is an estimate for the group-dependant probability
 and an estimator for the variance of
  can be obtained by using
  | (3) |


5.1. The Random Coefficients Logistic Regression Model
- Consider k explanatory variables
 The values of
 are indicated in the usual way by ,
  . Since some or all of these variables could be level-one variables, the success probability is not necessarily the same for all individuals in a given group. Therefore, the success probability depends on the individual as well as on the group, and is denoted by
  The outcome variable is expressed as the sum of success probability (expected value of the outcome variable) and a residual term
  That is,
 | (4) |
 are assumed to have mean zero and variance
  The logistic regression models with random coefficients express the log-odds, i.e., the logit of
  , as a sum of a linear function of the explanatory variables with randomly varying coefficients. That is,

 The
The  can be solved as
 | (5) |
 values of two individuals in the same group is associated with a difference of
  in their log-odds, or equivalently, a ratio of
  in their odds. Equation (5) does not include a level-one residual because it is an equation for the probability
 rather than for the outcome
  Note, that in the above equation
  is the fixed part of the model. The remaining
  is called the random part of the model. It is assumed that the residual
  are mutually independent and normally distributed with mean zero and variance
 .
.5.2. The Random Slope Model
- In logistic regression analysis, linear models are constructed for the log-odds. The multilevel analogue, random coefficient logistic regression, is based on linear models for the log-odds that include random effects for the groups or other higher-level units. Consider explanatory variables, which are potential explanations for the observed outcomes. Denote these variables by
 . The values of
  are indicated in the usual way by
 . Since some or all of these variables could be level-one variables, the success probability is not necessarily the same for all individuals in a given group. Therefore, the success probability depends on the individual as well as the group, and is denoted by
 .Now consider a model with group-specific regressions of logit of the success probability,
  , on a single level-one explanatory variable X,
 | (6) |
 as well as the regression coefficients, or slopes,
  are group-dependent. These group-dependent coefficients can be split into an average coefficient and the group dependent deviation:
 | (7) |
 | (8) |
 and the random slope
 . It is assumed that the level-two residuals
  and
and  have means zero given the value of the explanatory variable X. Thus,
  is the average regression coefficient and
  is the average regression intercept. The first term,
  , is called the fixed part of the model and the second part
  , is called the random part.The term
  can be regarded as a random interaction between group and X. This model implies that two random effects characterize the groups: their intercept and their slope. These two group effects
  and
and  will not be independent, but correlated. Further, it is assumed that, for different groups, the pairs of random effects
  are independent and identically distributed. Thus, the variances and covariance of the level-two random effects
 are denoted as follows:

 The model for a single explanatory variable discussed above can be extended by including more variables that have random effects. Suppose that there are k level one explanatory
 , and consider the model where all X-variables have varying slopes and random intercept. That is
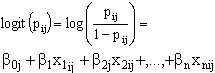 | (9) |
 and
and 
 We will get,
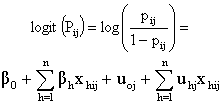 | (10) |
 , is the fixed part and the second part,
  , is the random part of the model.As parameter estimation in hierarchical generalized linear models is more complicated than the hierarchical linear models inevitably, some kind of approximation is involved, and various kinds of approximation have been proposed. The most frequently used methods are based on a first order or second-order Taylor series expansion of the link function.
6. Results and Discussion
- The present data set has a two-level hierarchical structure, with 16,700 women nested within eleven geographical regions. In this study, we examined determinants of modern contraceptive use with respect to their demographic, socio-economic and proximate factors. The total number of woman covered in present study is 9,115 married women only who are currently in reproductive age group. Among these, 5318 (58.3 percent) resides in rural areas whereas 3797 (41.7 percent) resides in urban centres. The analysis is carried out in two parts. In the first part, we present determinants of modern contraceptive use among women by using ordinary logistic regressions. Finally, we identify modern contraceptive factors and variations in modern contraceptive use across regions using multilevel logistic regressions model.
6.1. Determinants of Modern Contraceptives:-Result of Bivariate Analysis
- Place of residence was significantly associated with use of modern contraception. Women who reside in rural areas had lower rate of modern contraceptive use (23.9 percent) than those who lives in urban area (20.7 percent). it is observed that out the total respondents about (39.3 percent) who are currently in reproductive age group had no education, about 39.5 percent are at primary level of education and only 21.2 percent of women had secondary and higher education. The result also indicates that modern contraceptive use for no educations is 23.3 percent, while 21.1 percent for primary education and 39.3 percent when a women has secondary and higher educational level. Among Women who were orthodox believers, about 27 percent are found to be modern contraceptive users. Among 9,115 respondents, 15.5 percent and 22.6 percent samples who are using modern contraceptives are Muslim and protestant believers respectively.Working status of a woman is an important predictor (x2=47.188, P-value<0.001) predictor and which is associated with use of modern contraception. Table 1 shows that about 19.6 percent of women who are not currently working had reported as they are not using modern contraceptives, where as the rest 25.7 percent who had a work are using modern contraceptives. Whether a woman receives mass media messages by promoting family planning is highly associated with modern use of contraception. Among 9115 respondents about 60.0 percent of women receive FP messages using Radio. Majority of women who receives FP messages in radios (19.6 percent) had used modern contraceptives higher than those who do not have exposure to media messages.Use of modern contraceptive varied from one region to other. The result shows that region of residence is significantly associated with modern contraceptives (P<0.001). Amhara region had the highest (30.8 percent) percentage of modern contraceptive use followed by Gambella 29.4 percent. Somalia and Afar had the lowest percentages (4.7 percent and 9.5 percent) respectively for modern contraceptives use in Ethiopia. Woman desire for other children may prevent a woman to use contraceptives. Respondents were asked whether they want another child in the next two years, the result indicates that 25.8 percent those doesn’t need more children while 74.2 percent of them wants one or more children in the next two years. About 17.6 percent of the respondents who uses modern contraceptives want more than one child and 82.4 percent of them who wants no more children, are not using modern contraception.
6.2. Multilevel Modelling of Modern Contraceptives
- Our response variable is a binary indicator of whether a woman uses modern contraceptives. For research purpose, the study was restricted to married woman only who are currently using modern contraceptives within five years of the survey. For this reason, the sample is restricted to women who had been currently married and within the five-year period who are using modern contraceptives prior to the survey. In this study we consider multilevel models to allow for and to explore between-region variance of modern contraceptives use. The data have a two-level hierarchical structure with 9115 women at level 1, nested within 11 regions at level 2. The multilevel logistic regression analysis was used for comparisons and analysis of the effect of socio-economic and demographic variables on modern contraceptive use among women and to estimate any residual correlations across regions in predicting modern contraceptive use in Ethiopia.The multilevel process was stepwise. The first step examined the null model of overall probability of modern contraceptive use without adjustment for predictors. Second step included both the analysis of single and multilevel model for random intercept and fixed slope multilevel analysis. Third step considered a model for two level random intercept and random slope (random coefficient) multilevel logistic regression analysis. The Wald χ2 test was used to determine significance of each model as a whole as well as to determine significance of individual β coefficients.
6.3. Multilevel Logistic Regression Model Comparison
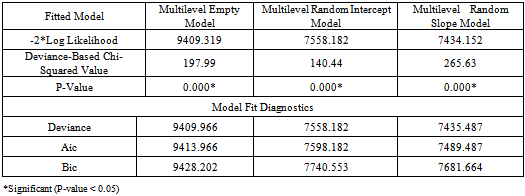
- The deviance-based chi-square value (χ2 = 197.99, d.f =1, p-value<0.001) for the empty model is shown in the above Table 1. The deviance-based chi-square is calculated as the difference of log likelihoods between an empty model for single level logistic regression (Appendix B, fitted model 3 :) and empty model for multilevel logistic regression (Appendix B, fitted model 4 :), which is to be compared with the critical value from the chi-square distribution with 1 degree of freedom. The significance of this test further implies that an empty model with random intercept is more appropriate than an empty model without random intercept.The deviance-based chi-square value (χ2 = 140.44, df =1, p-value< χ2=0.001) is significant for multilevel random intercept model implies that the multilevel random intercept and fixed slope model fits better as compared to the multilevel empty model. Also the deviance-based chi-square value for random effects (χ2 = 265.63, df =4, p-value<=0.001) for multilevel random slope model (random coefficient model) is also statistically significant. This further implies that in comparison to the model with multilevel random intercept, fixed slope model the multilevel random intercept, and random coefficients model has a better fit. Thus, the deviance-based chi-square test shown in Table 1 implies that among the multilevel logistic regression models, the multilevel random intercept and random slope model fits the data better than the others models to predict use of modern contraception in Ethiopia for the contraceptive data set as in[22].
6.3.1. Selecting Model which Best Fitted to the Data (Testing for Group Effects)
- We can test the null hypothesis that there are no group differencesHypothesis

 (Multiple logistic regressions is best fits to the data
 (Multilevel logistic regression is best fits to the data.Where
  is level-2 error variance. The test statistics likelihood ratio is compared with a chi-squared distribution with degrees of freedom equal to the number of extra parameters in the more complex model. Rejection of the null hypothesis implies that there are real group differences. The likelihood ratio test statistic is difference between -2 log-likelihood value of multiple logistic regression and multilevel logistic regression is calculated as 7698.621-7435.487=265.63, with 4 d.f and P-value <0.001. The d.f is 4 because there are four more parameters in multilevel random slope logistic regression model (Appendix B, fitted model 7). The tabulated values (critical value) is
  =9.4877. Since the test statistic based on deviance (-2*log likelihood) =265.63 is greater than the tabulated value or the P-value is very small (p<0.001) implied that multilevel logistic regression model is best fit over the ordinary multiple logistic regression models. Further from the model fit diagnostics statistics Deviance, AIC and BIC presented on Table 2. We can see that the model fit statistics values (Deviance=7435.485, AIC=7489.487 and BIC=7681.664) for random intercept are much smaller than the other multilevel models therefore the random coefficient model best fits the data in comparison with other multilevel models.
6.4. Multilevel Empty Model Analysis
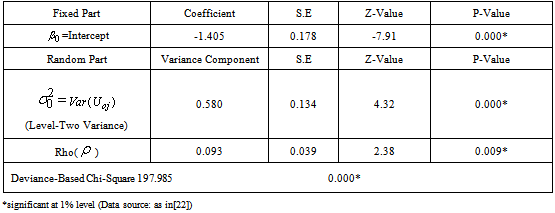
- The empty model is considered as a parametric version of assessing heterogeneity of regions for modern use of contraceptives. According to the result (Table 2) the variance of the random factor (
 0.579889, S.E=0.1343654, p<0.001), and the Wald test statistic is (the square of the Z-ratio), Z= (0.579889/0.1343654)2=18.92, which is compared with a chi-squared distribution on 1 degree of freedom, gives a p-value less than 0.001. Therefore, we conclude that there is significant variation between regions in using modern contraceptives among regions. Multilevel Empty model results are shown in Table 2, From the fitted model it is observed that within region variations are higher than between region variations for modern contraceptive use (ICC=0.092, S.E=0.0389, p-value<0.009). Because of the Intraclass, correlation coefficient shows a fair amount of variation across regions, we add regional level variables in random intercept model. The variance partition coefficient which measures the proportion of the total variance that is due to differences between regions is 0.092, in empty model the variance partition coefficient is equivalent with intra class correlation coefficient. Thus 9.2% of the residual variation in the propensity to use modern contraceptive use is attributable to unobserved regional characteristics. This implies that use of modern contraception within region is less homogenous than between regions in Ethiopia. In other words, the variance is low at woman level and high at regional level for modern contraceptive use.The deviance-based Chi-square (
 = 197.985, d.f=1, p-value<0.001) indicated in Table 2 above is the difference in -2*log likelihood between an empty model without random effect (-2*log likelihood = 9607.304 (see Appendix B, Fitted Model 4) and an empty model with random effect (-2*log likelihood =9409.319 see Appendix). This implies that an empty model with random intercept is much better than an empty model without random intercept. The variance of the random factor in empty model is significant (and also non zero) which indicates that there are regional differences in using modern contraceptive use across regions in Ethiopia. The likelihood ratio statistic for testing the null hypothesis that
  = 0 is reported in the final line of the output (fitted model: 3 in appendix). The test statistics is 197.34 (P<0.001) hence, there is strong evidence that the between region variance is non-zero. From Table 2, we can say that the odds of using modern contraceptives in an ‘average’ region (one with
 =0) is estimated as
  =-1.404948. The intercept, representing the expected change in modern contraceptive use for a woman is significant at 5% level of significance, implies the intercept estimate of -1.4049 is now the estimated log-odds of using modern contraceptives for an individual woman living in an 'average' region. The variance component corresponding to the intercept for region j is 0.579889 with standard error of 0.1343654, demonstrating that the inclusion of intercept in regional-level variables will explain much of the level-2 variation. However, the estimate is still more than three times larger than its standard error, suggesting that there remains a significant amount of unexplained regional-level variance.
|
 obtained from the null model. We calculate the residuals and produce a caterpillar plot with the regional effects shown in rank order together with their 95% confidence intervals. The plot shows regional residuals, with 95% confidence intervals, for modern contraceptives dataset. There are eleven residuals one for each region. The width of the confidence interval associated with a particular region depends on the standard error of that region’s residual estimate, which is inversely related to the size of the sample. Here, the intervals are narrow and of a similar width because a large sample was taken from each region. The residuals represent regional departures from the overall mean, so a region whose confidence interval does not overlap the line at zero (representing the mean usage of modern contraceptives value across all regions) is said to differ significantly from the average at the 5% level. At the left-hand side of the plot, there is a cluster of regions whose mean usage of modern contraceptives is lower than average
|
6.5. Multilevel Random Intercept Model Analysis
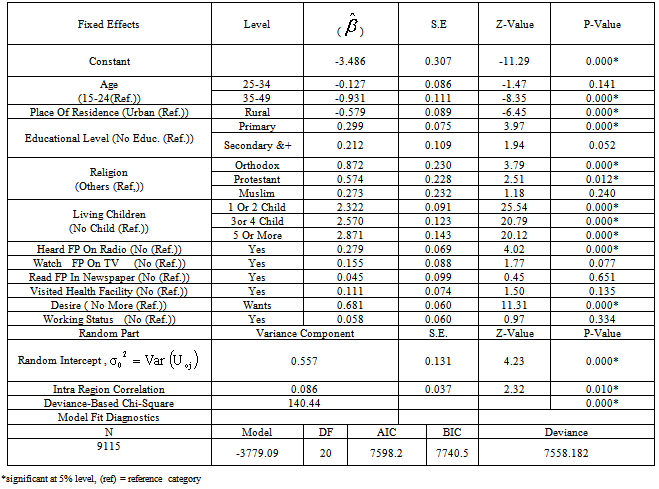
- To relax the assumption of conditional independence among the responses for the same region given the covariates, we included a region specific random intercept
 in the linear predictor to obtain a random-intercept logistic regression model. The random intercept and fixed slope logistic regression model is a multilevel model which have random intercept and fixed coefficients of predictors. As it can be seen from Table 3, the analysis of multilevel logistic regression revealed that use of modern contraceptive in woman’s varied among regions. The deviance based chi-square test for the random effects in random intercept model is
  140.44 ( d.f. =1, P<0.001). Which indicate that the random intercept model with fixed slope is found to give a better fit as compared to the empty model for predicting use of modern contraceptives among regions in Ethiopia (see appendix B, fitted model 6).
|
6.6. Multilevel Random Slope Model Analysis
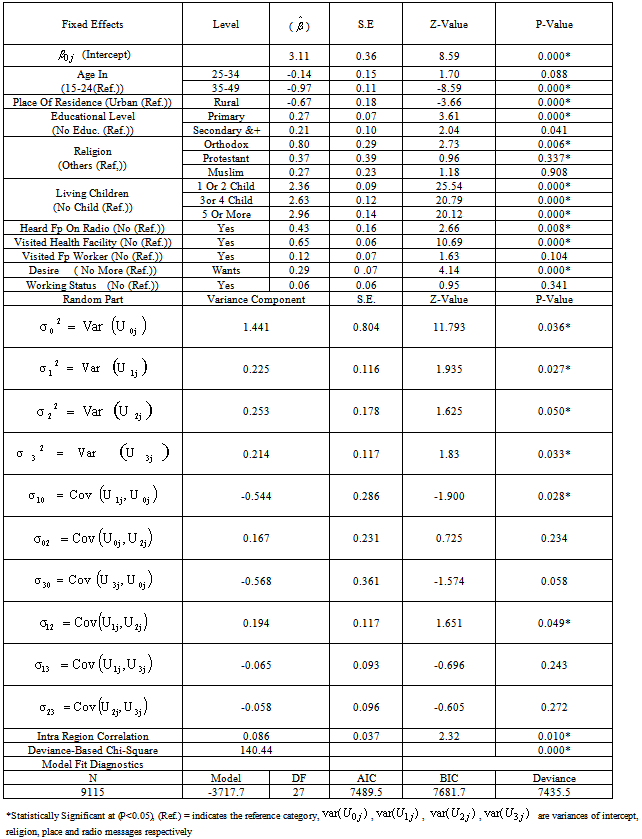
- It is possible to generalize the model so that the effect of level-1 covariates is different in each region. This can be done by adding random coefficients in front of some of the individual-level covariates of the model. In random intercept model we allowed the intercept only to vary across regions by fixing explanatory covariates, But the relation between explanatory and dependent variables can differ between groups (regions in our case) in many ways, for example, in contraceptive use (nesting structure: women within regions) it is possible that the effect of religious belief of a woman on contraceptive use is stronger in some regions than in others. In the analysis of covariance, this phenomenon is known as heterogeneity of regression across groups by covariate interaction. In the hierarchical linear models it is modelled by random slopes as in[22].Models fitted previously have allowed the probability of using modern contraceptives to depend on the region of residence through individual characteristics. This was achieved by allowing the model intercept to vary randomly across regions in a random intercept model. We have assumed, however, that the effects of individual characteristics such as religion, radio messages, and place of residence are the same in each region, i.e. the coefficients of all explanatory variables are fixed across regions. Because it is possible that the effect of individual religious belief, status of hearing radio messages and the effect of place of residence varies across regions these slopes are treated as random. We will now extend the random intercept model by allowing both the intercept and the coefficient of religion, radio messages, and place of residence to vary randomly across regions. From Table 4 the random coefficient estimates for intercepts and the slopes vary significantly at 5% significance level, which implies that there is a considerable variation in the effects of religion, place of residence and radio messages, these variables differ significantly across the regions. The variance component for the variance of intercept in the random slope model is 1.441054, which is still large relative to its standard error of 0.8038027. Thus there remains some regional-level variance unaccounted for in the model. The variance component corresponding to the slope of religion is 0.2254517, which is also relatively large with respect to its standard error, thus, this suggests that the effect of religion may be justified in constructing the effect to be random. The effect of orthodox religion as log-odds of use of modern contraceptive in region j is estimated as 0.8017296+
 , and the between-regions variance in the effect of religion is estimated as 0.2254517. The negative intercept-religion covariance estimate (
 =-0.5436457, S.E=0.2861097) implies that regions with above-average use of modern contraceptive (intercept residual
  > 0) tend also to have below-average effects of religion (slope residual
  < 0). The random effect of place on the log-odds of use of modern contraceptive in region j is also estimated as -0.6711194+
 , and the between-regions variance in the effect of place is estimated as 0.2531976. The deviance-based Chi-square value of 265.63, shown on Table 4, is the difference between the model with and without random effects models. The significance of this difference further indicates that a model with a random coefficient is more appropriate to explain regional variation than a model with fixed coefficients.The correlation between the intercept and random slope of place of residence is -0.9419006. This implies that women who reside in rural areas uses modern contraceptives less than those in urban areas by a larger factor at regions with higher intercepts compared to regions with lower intercepts. In general, Positive correlation between intercepts and slopes implies that regions with higher intercepts tend to have on average higher slopes and the negative sign for the correlation between intercepts and slopes implies that regions with higher intercepts tend to have on average lower slopes on the corresponding predictors.The intra-class correlation coefficient (ICC) shows that roughly about 64% of use of contraceptive variations in religion is due to the random factor of religion (level two factor) whereas about 35% 0f variations in contraceptive use are due to fixed factors. About 93-94% variations in modern contraceptive use are due to fixed effects where as only about 6-7% is due to the effect of place of residence (radio message). This suggests that considering the effect of radio messages and place of residence as only fixed will seriously affect the estimate while modelling contraceptive uses. The ICC for intercept is 30.45% which indicates that roughly about 31% of variations due to the random effects are still unexplained. We observed that place of residence, religion and the status of a woman to hear family planning messages on radios shows that all regions have their own separate estimates hence the random slope model suggests that these parameters have their own estimates at all regions. From the effect of place of residence for Afar, Amhara, Oromia, Benishangul Gumuz, SNNPR and Gambella is significant when individual analysis is allowed for all regions. For Amhara region it is observed that the effect of place of residence, religion and radio messages significantly affects women use of modern contraception.Generally, the results of the random slope multilevel logistic regression analysis suggest that there exist considerable differences in modern contraceptive use among regions in Ethiopia. As a result, it is suggested that all regions need have their own separate parameter estimates from logistic regressions.
6.7. Comparison of Parameter Estimates of Single Level with Multilevel Models
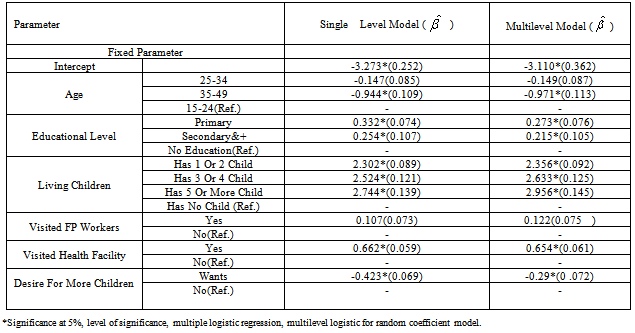
- In comparison to multiple logistic regression (single level) and multilevel models (random coefficient multilevel model) from Table 5, it is observed that there exist considerable differences between the β coefficients of these two models for each of the explanatory variables. These difference in β coefficients estimated from a multilevel and standard model arises because of the addition of the random effects, implies that a single level model for this outcome variable is not appropriate.From Table 5, we observe a considerable differences in β coefficients when the multilevel effects have not been taken into consideration, For instance, for educational categories (primary, and secondary and higher educational levels), the β coefficients of the single level model have been overestimated by almost 17.8 percent and 15.4 percent respectively (Table 5).We also observed that the standard errors of β coefficients have been underestimated for Visiting Family planning workers last 12 months and Desire for more children by almost 14.0 percent and 29.8 percent respectively (Table 5). In general, the β coefficients are seriously affected for almost all explanatory variables somewhat in both directions either in over or under direction from the true value when multilevel effects are not taken into consideration in modeling. Generally the difference in β coefficients estimated from a multilevel and single level model are different because of the addition of the random effects, It also observed that multilevel method best fit the data as compared to traditional regression method implied that traditional (single level) models are not appropriate.
|
7. Discussions
- This study is intended to model determinants of modern contraceptive use among rural and urban populations of Ethiopia using the Ethiopian demographic and health Survey data as in[22]. Accordingly, different models are fitted to the data to identify potential determinants of use of modern contraception among women in reproductive age group. First, the ordinary logistic regression model was fitted to the data and significant variables were considered for further investigation in multilevel models. Secondly, the multilevel models were fitted; the multilevel model was step wise, on the first step the intercept only or the empty model was fitted to check whether multilevel effects or heterogeneity exists among the hierarchies. The next step was random intercept and fixed slope model, usually called random intercept model, is fitted and finally the random intercept and random slope (random slope model) is fitted. The results are discussed in the following paragraphs.Our study found that, multilevel effects are all significant and have to be taken into consideration in logistic regression modelling. The study result of ordinary logistic regression reveals that region of residence, place of residence, religious belief, age of woman (in categories), highest educational level, Number of living children, Heard family planning on radio last few months, Visited health facility last 12 months, Desire for more children are the most important explanatory variables for modern use of contraception in Ethiopia. Women use of modern contraception was significantly associated with regions of residences. This might be because of the fact that regions are highly correlated therefore the assumption of independency of higher level(regions) in classical regression analysis might seriously bias the standard errors of regression coefficients as stated in Goldstein (2003). The odds of using modern contraception in Tigray, Afar and Dire Dawa were not significantly differing from that of woman in Addis Ababa. This is in line as in[21]. This is because of the effect of random covariates such us status of a woman to hearing family planning messages on radios might affect women in those regions and also the effect of educational attainment in Addis Ababa might be higher than those regions. It is also observed that woman in Somalia were also less likely to use modern contraception than women in Addis Ababa, the effect of place of residence and religion might widen the use of modern contraceptives in the two regions.The likelihood of using modern contraception is significantly associated with respondents religious belief (p<0.001). Orthodox believers were 41.7 percent more uses modern contraception than those who had other religion. This result also seems to agree with findings of several studies done in Ethiopia and over the world as in[21, 24, 25, 26]. Protestant believers were 77.5 percent times more to use modern contraception than those in other religion. Muslim religion believers were 35.5 percent times more likely to use modern contraception than those in other religion. This study found that using modern contraceptive is significantly associated with age of woman. For a one step increase in age category( to age group 25-35), the log odds of using modern contraceptive in women were decreased by 12.2 percent when compared with age group 15-24. For a one step increase in age category (to 35-49) ,the log odds of using modern contraceptive in women were decreased by 61.6 percent when compared with age group 15-24. Therefore, women are more likely to use contraceptives in age category of 15-24 as compared to other age categories. This indicates that women use modern contraceptives more likely in their early ages of 15-24 (mostly in their early age of 20’s year). This result maintains what is stated with studies done in Bangladesh as in[27].Use of modern contraception was associated with women educational attainment. The odds of using modern contraception for women who have primary education were 34.5 percent times higher compared with those women who do not have education and the log odds of modern use of contraception also increases by 23.4 percent for women with secondary and higher education when compared with women who do not have school education at all. Generally, use of modern contraceptive is likely to increase when woman educational level increases. This is because they understand the benefits and the side effects of contraceptives better when they are more educated. These results also agree with the results of several authors as in[28, 29, 30 ].Another important model fitted in this analysis was multilevel logistic regression. In this analysis, modern use of contraceptives was significantly associated with place of residence; woman educational attainment, age group, religious probations and beliefs, heard of family planning messages with radio in the past few months, visited health facility in the last 12 months and desire for more children were the most important factors in multilevel models. The fixed parts of the effects of explanatory variables or factors included in the multilevel models have similar interpretation as that of the multiple logistic regressions analysis but the random parts of the intercept and the coefficients provide additional information. The random intercept in the “Random intercept and fixed Slope” model is significantly different from zero (P-Value= 5%) indicating that use of modern contraceptive differ from region to regions. The deviance based chi-square test for random effects in random intercept model is also high (
 140.43, d.f=1, p-value<0.001). This indicate that the random intercept model with the fixed slope is found to give a better fit as compared to the empty model for predicting use of modern contraceptives across regions of Ethiopia. It can be argued that use of contraceptives types differs across regions because of the differences across regions in religious belief, women place of residence and their educational attainment. The variance component of random intercept is also large which further supports the fact that there is a high variability in modern contraceptive use in Ethiopia across regions. Within region variation further implies that use of contraceptives within regions are less likely (or heterogeneous) than between regions. Thus multilevel analysis has demonstrated that different regions have significantly different mean effects, and that the effect for place of residence is different in rural and urban areas across the regions. This supports the arguments of as in[21,30,31].The random coefficient estimates for intercepts and the slopes vary significantly at 5% significance level, which implies that there is a significant variation in the effects of religion, place of residence and radio messages, these variables differ significantly across the regions. The variance component for the random intercept is large compared to its standard error. Thus there remains some regional-level variance unexplained for in the final model. The variance component corresponding to the radio message in the random slope model, however, is quite small relative to its standard error. This suggests that the researcher may be justified in constraining the effect to be fixed.The fixed part of the random intercept model shows that on average urban women use modern contraceptive better than rural women, this is the fact that women in urban areas have a higher access of modern contraceptives than the rural counter parts, it might be the fact that women in urban areas might highly participate or attain education when compared with women in rural areas and also the availability and awareness behind using modern contraceptives in urban areas is higher than in rural areas. On the other hand the random slopes of the multilevel model suggests that religion, place of residence and women status of listening radio messages of family planning significantly differs across regions suggesting that these variables are different for different regions for predicting modern contraceptive use in Ethiopia. Hence, using ordinary logistic regressions is not advisable for predicting modern contraceptives in such data set without accounting for the effect of regions.On the other hand it was found that the Random intercept and explanatory variables provide additional information. First, the variances of the random components related to the random term were found to be statistically significant implying presence of differences in use of modern contraceptives across the regions. Secondly, from explanatory variables considered here, the effect of the religious beliefs of a woman, place of residence and women exposure to listening family planning messages in radios differs from region to region. Third, the interaction between random parts of religious beliefs and place of residence provide significant differences on use of modern contraceptives across regions. This result supports what was noted as in[21,32]We observed considerable differences in β coefficients when the multilevel effects have not been taken into consideration. Ordinary multiple logistic regressions underestimate the
  coefficients compared to the multilevel regression as stated in as in[33,34,26]. Standard errors in single model underestimated the
  coefficients, because of the fact that in a single-level model standard errors are calculated on the assumption that individuals in the sample provide independent pieces of information. When outcomes are clustered, however, there will be fewer than independent observations. The number of independent observations is called the effective sample size (ESS) and depends on the degree of clustering (as measured by the intra-class correlation or variance partition coefficient). For example, if we consider the extreme situation where the intra-class correlation is 1 (all individuals in a group have the same y value) and therefore each group provides only one independent observation. In that case, the ESS would be equal to the number of groups. Thus, standard errors from a multilevel analysis would therefore be substantially higher than those from a single-level analysis. Underestimation in a single-level model is especially severe for coefficients of variables that are defined at the group level. Multilevel modelling is one way of obtaining correct standard errors. An alternative approach, which originated in the analysis of data from multistage sample designs, is to adjust the standard errors by a factor related to the intra-class correlation. This factor is called the design effect. However, standard error adjustment methods treat clustering as a nuisance rather than a feature of substantive interest (Goldstein, 2003). Hence, ignoring the multilevel effects will result in a serious bias of the coefficients of the parameters estimates. Generally slight reduction of standard errors in single level analysis might imply that ignoring the effect of regional variations will decrease the precision of the estimates. It is also observed that multiple logistic regression underestimates the parameter when compared with multilevel models and these implies, multilevel models best fits the data as compared to traditional(single level) methods. This result is in line as in[33].
8. Conclusions and Recommendations
8.1. Conclusions
- This study revealed that socio-economic, demographic and proximate variables have important effect on the modern contraceptives use in Ethiopia. Place of residence, woman educational attainment, age group, religious beliefs, heard of family planning messages with radio in the past few months, visited health facility in the last 12 months and desire for more children were the most important determinants for use of modern contraceptives in Ethiopia. Although, there is higher variability in modern contraceptive use in Ethiopia between regions, it is observed that women who are living in urban use modern contraceptives better than those in rural counter parts. The reason for this disparity among rural- urban residences might be access to mass Media messages such as radios, and health facilities in rural areas compared to urban areas. Therefore, it is useful to increase health care centers and promote family planning messages in radios in rural areas to directly address this contraceptive use disparities between regions and in rural parts of the country.It is found that education is statistically significant predator for modern contraception use. The study also revealed that there is a marked difference between respondents level of educational attainment in using modern contraceptives. Women who have education at least primary, secondary and higher school attainments are using modern contraceptives better than those women who do not have school education at all. This may be because of the fact that educated women are well informed about use and the side effects of contraception. In addition, educated ones know the benefit of limiting births than those women with no school educations. Thus, efforts should be made to motivate women to attain school educations to minimize the problems. The finding of this study also shows that religious belief of a woman has an important effect on modern contraceptive use. Women who are orthodox believers are using modern contraceptives higher than those with no religions. Therefore an effort should be exerted to teach women about family planning methods, especially modern contraceptives, by their religious leaders to minimize the current high fertility rate of the country.The regional differentials also show that women in more urbanized regions such as Addis Ababa, Dire Dawa, and Harari are more likely to use modern contraceptives than respondents in more rural regions to be exposed to specific family planning messages. The effect of regional variations for religion, place of residence and radio messages further implies that there exist considerable deference in modern contraceptive use among regions and a model with a random coefficient or slope is more appropriate to explain the regional variation than a model with fixed coefficients or without random effects.In general, the results of the random slope multilevel logistic regression suggest that there exist significant differences in modern contraceptive use among regions in Ethiopia. As a result, this study suggests that all regions need to have separate estimates of logistic regressions for all eleven geographical regions.
8.2. Recommendations
- As there is variation and differences in use of Modern contraceptives across regions it is recommended to balance the effect of religious beliefs by teaching religious leaders to teach their followers about family planning and increasing access of family planning messages in radios across regions. It is also recommended that, researchers who want to conduct studies using EDHS data should use multilevel models than traditional regression methods. The following suggestions also help to reduce the variability and low utilization rate of contraceptive use in the country.1. The study suggests that efforts should be made to motivate women to visit health facilities and consult health practitioners about contraceptives methods.2. Promoting family planning messages through the radio and increasing awareness of family planning methods have to be given due attention to alleviate the problem of high fertility rate and low use of contraceptives.3. Improving women access to school and health facilities may also contribute in increasing women access and use of contraceptives.4. A closer relation between family planning workers and woman may also contribute in alleviating the problem.Therefore, this study is important in the following ways: First it provides an alternative model that can preferably represent the current data set to model modern contraceptive use among women in Ethiopia. Secondly, it provides information about modern contraceptive uses and variations across regions and finally, it points that further studies should be conducted to incorporate spatial variations in use of modern contraceptives, by utilizing other models such as Spatial Models and Geoadditive models to investigate spatial variations of contraceptives use in the country
8.3. Limitation of the Study
- It is worthwhile to mention some of the constraints that the researcher faced while undertaking this study, the first constraint was while identifying determinants of modern contraceptive considered in this study such as socio-economic, demographic and proximate and health facility variables the all basic factors or determinants reviewed were not able to be included in the model such as (family income, availability of the method near to their home and the cost of modern contraceptives) because of the variables are not included in the current survey as in[22]. The problem of missing values and non response rate for some variables were the main root limitations of this study.
ACKNOWLEDGEMENTS
- This work would have not been possible without the support of Dr. Girma Taye, Dr. Ayele Taye, Mr. Yohannes Yebabe, Awassa University and Arba Minch University who participated directly and indirectly in this work. My heartfelt thanks go out to them all.
References
| [1] | Central Statistical Authority (CSA) and United Nations Population Fund (UNFPA), Ethiopia, Summary and Statistical Report f the 2007 Population and Housing Census, Population Census Commission. Addis Ababa, Ethiopia. |
| [2] | Solomon Alayu, “Capturing the Demographic Dividend (Bonus): Concept and International Experiences” Population and Development Ethiopia. 2008. |
| [3] | Darroch, J.E., S. Singh, and J. Nadeau, Contraception: an investment in lives, health and development. New York: Guttmacher Institute and UNFPA.2008. |
| [4] | Moreland, S.et’al. World population prospects and unmet need for family planning: Washington, future group, DC 20005 USA. 2000. |
| [5] | USAID X. Perspectives on unmet need for family planning in West Africa: Benin. Policy project briefing paper presented at a conference on repositioning family planning in west Africa, February 15–18,2005 Accra, Ghana.2000. |
| [6] | Westoff, C.F. Unmet need at the end of the century: DHS comparative report no. 1.calverton, MD., USA. 2001. |
| [7] | Sinding, S.W. Seeking common ground: unmet need and demographic goals, international family planning perspectives, 1994; 20(1): 23–27, 32.1994. |
| [8] | Casterline, J.B., F. El-Zanatay, and L.O. el-Zeini. Unmet need and unintended fertility: longitudinal evidence from Upper Egypt. International Family Planning Perspectives, Vol. 29(4):158–166.2003 |
| [9] | Assefa Hailemariam, Tekle-Ab Mengistu, Misganaw, F. Factors affecting unmet need for family planning in Southern Nations Nationalities and Peoples Region. Ethiopia: family planning in Ethiopia.2006. |
| [10] | Assefa Hailemariam and Fikrewold Haddis., Family Planning in Southern Nations, Nationalities and Peoples Region, Ethiopia. Ethiopian Journal of Health Science. Vol. 21(2).2011. |
| [11] | Mekonnen, Y., Ayalew, T., and Dejene, A. A high risk birth fertility intension and unmet need in Addis Ababa: Ethiopia Journal of Health Development, 12(2):103-109.1998. |
| [12] | UN. World population monitoring: reproductive rights and reproductive health: New York.1998. |
| [13] | Central Statistical Agency (CSA) and Orc macro, Reports on 2005 Ethiopian demographic and health survey. Addis Ababa, Ethiopia and Calverton, Mary land USA.2006. |
| [14] | Ethiopia Ministry of Finance and Economic Development (MoFED) (2008), ‘Population and Development in Ethiopia’, A Situation Analysis, Addis Ababa, Ethiopia.2008. |
| [15] | UNDP. Human Development Report. New York: Oxford University Press.2002. |
| [16] | Central Statistical Agency (CSA). Ethiopia demographic and health survey. Addis Ababa, Ethiopia.2010. |
| [17] | Central Statistical Agency (CSA) and Orc macro. Ethiopia demographic and health survey 2000: Addis Ababa and Calverton, Maryland: CSA and Orc macro.2001. |
| [18] | Abebe Gizaw and Nigatu Regassa. Family planning service utilization in Mojo town, Ethiopia: a population based study. Journal of geography and regional planning: Academic journals. Vol. 4(6), pp. 355-363, 2070-1845.2011. |
| [19] | Sahle Sita. Assessment of the magnitude and determinants of unmet need for family planning among currently married women in urban and peri-urban community in Awassa southern Ethiopia. MSc. Thesis. Addis Ababa University. 2003. |
| [20] | Belete Munea. Factors affecting contraceptive use of married women in Soddo town, SNNPR, Ethiopia. M.Sc. Thesis. Hawassa University.2010. |
| [21] | Nibret Alene (2010). Determinants of family planning practice in Ethiopia. June 2010. M.Sc. Thesis. Addis Ababa University, Addis Ababa, Ethiopia. |
| [22] | EDHS. Ethiopian Demographic and Health Survey. Central Statistics Agency, Addis Ababa, Ethiopia.2011. |
| [23] | Snijders, T.A.B. and R.J. Bosker. An introduction to basic and advanced multilevel modeling: Department of statistics, university of Poone, Pune 7.1999. |
| [24] | Ria, R.I.U., and M.C.D. Peter. Contraceptive use patterns among married women in Indonesia. Paper presented at the international conference on family planning, research and best practices, November 15-18, 2009, Kampala, Uganda. 2009. |
| [25] | Mishra, K. M., and M. Phil. Ethnic Disparities in Contraceptive Use and Its Impact on Family Planning Program in Nepal. Journal of Family and Reproductive Health, Vol. 4(3).2010. |
| [26] | Khan, M. H. R., and J.E.H. Shaw. Multilevel logistic regression analysis applied to binary contraceptive prevalence data university of Warwick, Journal of Data Science, Vol. 9, 93-110.2011. |
| [27] | Khan, H.T.A., ‘A hierarchical model of contraceptive use in urban and rural Bangladesh’: Contraception, 55, 91-96.1997. |
| [28] | Ricardo, S., G. Charlie, B. Rod, and W. Tsedey. Women’s education and modern contraceptive use in Ethiopia: International Journal of Education, ISSN 1948-5476, 2011, vol. 3, No. 1: 9.2011. |
| [29] | Kamal, N., L. Cidy, and O. Rummana. Determinants of contraceptive use in the urban slums of Bangladesh: a multilevel model.2002. |
| [30] | Ullah, M.S., and N. Chakraborty. Factors affecting the use of contraception in Bangladesh: A multivariate analysis. Asia-Pacific Population Journal, 8, 19-30.1993. |
| [31] | Kamal, N., The influence of husbands on contraceptive use by Bangladeshi women: Health policy and planning, Oxford University Press, Vol. 15(1): 43–51.2000. |
| [32] | Kalam, H. T., and A. Khan., Modeling contraceptive prevalence in Bangladesh: a hierarchical approach, Asian Meta centre research paper series no.5 may 2002 ISBN 981-04-5856-8.2002. |
| [33] | Goldstein,H., Multilevel Statistical Models, London: Arnold; New York: Oxford University Press Inc.2003. |
| [34] | Nigussie Yohannes, Multilevel Analysis of Determinants of Academic Achievement of Grade Eight Students: A Case Study at Hawassa Town. M.Sc. Thesis. Hawassa University, Ethiopia.2010. |