L. A. Nafiu 1, I. O. Oshungade 2, A. A. Adewara 2
1Department of Mathematics and Statistics, Federal University of Technology, Minna, +234, Nigeria
2Department of Statistics, University of Ilorin, Ilorin, +234, Nigeria
Correspondence to: L. A. Nafiu , Department of Mathematics and Statistics, Federal University of Technology, Minna, +234, Nigeria.
| Email: |  |
Copyright © 2012 Scientific & Academic Publishing. All Rights Reserved.
Abstract
This research investigates the use of a three-stage cluster sampling design in estimating population total. We focus on a special design where certain number of visits is being considered for estimating the population size and a weighted factor of / is introduced. In particular, attempt was made at deriving new method for a three-stage sampling design. In this study, we compared the newly proposed estimator with some of the existing estimators in a three-stage sampling design. Eight (8) data sets were used to justify this paper. The first four (4) data sets were obtained from[1],[2],[3] and[4] respectively while the second four (4) data sets represent the number of diabetic patients in Niger state, Nigeria for the years 2005, 2006, 2007 and 2008 respectively. The computation was done with software developed in Microsoft Visual C++ programming language. All the estimates obtained show that our newly proposed three-stage cluster sampling design estimator performs better.
Keywords:
Sampling, Three-stage, Cluster Design, Estimator, Bias and Variance
Cite this paper:
L. A. Nafiu , I. O. Oshungade , A. A. Adewara , "Alternative Estimation Method for a Three-Stage Cluster Sampling in Finite Population", American Journal of Mathematics and Statistics, Vol. 2 No. 6, 2012, pp. 199-205. doi: 10.5923/j.ajms.20120206.06.
1. Introduction
In a census, each unit (such as person, household or local government area) is enumerated, whereas in a sample survey, only a sample of units is enumerated and information provided by the sample is used to make estimates relating to all units[5] and[6]. In designing a study, it can be advantageous to sample units in more than one-stage. The criteria for selecting a unit at a given stage typically depend on attributes observed in the previous stages[7]. Multistage sampling is where the researcher divides the population into clusters, samples the clusters, and then resample, repeating the process until the ultimate sampling units are selected at the last of the hierarchical levels[8]. If, after selecting a sample of primary units, a sample of secondary units is selected from each of the selected primary units, the design is referred to as two-stage sampling. If in turn a sample of tertiary units is selected from each selected secondary unit, the design is three-stage sampling[9].The aim of this paper is to model a new estimator for three-stage cluster sampling scheme which is to be compared with the other existing seven conventional estimators.
2. Methodology
Sub sampling has a great variety of applications[3] and the reason for multistage sampling is administrativeconvenience[10]. The process of sub sampling can be carried to a third stage by sampling the subunits instead of enumerating them completely[11]. Comparing multistage cluster sampling with simple random sampling, it was observes that multistage cluster sampling is better in terms of efficiency[12]. Multistage sampling makes fieldwork and supervision relatively easy[4]. Multistage sampling is more efficient than single stage cluster sampling[13] and references had been made to the use of three or more stages sampling[9]. Let  denote the number of primary units in the population and
  the number of primary units in the sample. Let
  be the number of secondary units in the primary unit. The total number of secondary units in the population is
 | (1) |
Let  denote the value of the variable of interest of the jth secondary unit in the ith primary unit. The total of the y-values in the ith primary unit is
 | (2) |
Accordingly, the population total for over-all sample in a two-stage is given as  | (3) |
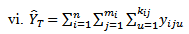
For a three-stage sampling, the population contains N first-stage units, each with M second-stage units, each of which has K third-stage units. The corresponding numbers for the sample are n, m and k respectively. Let  be the value obtained for the uth third-stage units in the jth second-stage units drawn from the ith primary units. The relevant population total for over-all sample in a three-stage is given as follows:
 | (4) |
For any estimation  in the hth cell based on completely arbitrary probabilities of selection, the total variance is then the sum of the variances for all strata. The symbol E is used for the operator of expectation, V for the variance, and
  for the unbiased estimate of V. We may then write
 | (5) |
The expression (5) may be written into three components as: | (6) |
where “>1” is the symbol to represent all stages of sampling after the first[3].
3. Proposed Three-Stage Cluster Sampling Design
To estimate the population size at different hospitals using three-stage sampling, the unbiased estimator of population total can be derived as follows. In a three-stage sampling without replacement design supported by[3],[4] and[14]; a sample of primary units is selected, then a sample of secondary units is chosen from each of the selected primary units and finally, a sample of tertiary units is chosen from each selected secondary unit. For instance, the state consists of  number of local government areas out of which a simple random sampling of n number of local government areas is selected. Each local government area consists of
  number of cities out of which a simple random sampling without replacement of
  number of cities is selected. Finally, from the selected sample of city containing
  number of hospitals,
  number of hospitals is selected at random without replacement and the number of diabetic patients in this hospital is collected.Then;
 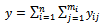 | (7) |
Again, let  be the number of primary units (local government areas) sampled without replacement,
  be the number of secondary units (cities) selected without replacement from the
  sampled primary unit (local government area) and
  be the number of tertiary units (hospitals) selected from the
  secondary unit (city) in the
  primary unit (local government area). An unbiased estimator of the population total at
  secondary unit in the
  primary unit in the sample is:
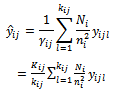 | (8) |
where  is the known sampling fraction for tertiary units in the
  secondary unit of the
  primary unit.Also, let
  denote the number of individuals (tertiary units) in the sample from the
  secondary unit of the
  primary unit who engage in the treatment of diabetes. An unbiased estimator of the population total in the
  primary unit in the sample is:
 | (9) |
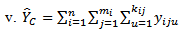
Finally, an unbiased estimator of the population total of the diabetic patients undergoing treatment in all the hospitals at the  secondary unit (city) in the
  primary unit (local government area) is:
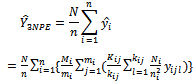 | (10) |
4. Theorems
4.1. Theorem 1:  is Unbiased for the Population total Y
Proof:We know that expectation of  given by equation (8) conditional on samples
  and
and  of primary units and secondary units respectively equals
  of engaging in the variable of interest in each primary unit and each secondary unit [15]. That is;
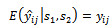 | (11) |
Also, the expectation of  given by equation (9) conditional on sample
  of primary units equals
  of engaging in the variable of interest in each primary unit.That is;
 | (12) |
To obtain the expected value of  given by equation (10) over all possible samples of primary units.Then, the expectation of
  is :
is :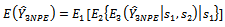 | (13) |
where  and
and  denote the samples of primary units and secondary units respectively.
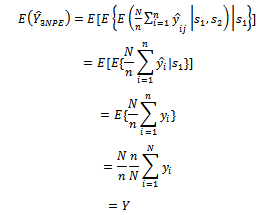 | (14) |
This implies that the proposed estimator  is unbiased.Hence, the variance of the newly proposed estimator
  of the population total is derived as follows:In line with[3] and[14], we use
 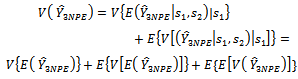 | (15) |
Because of the simple random sampling of primary units and secondary units without replacement at the first stage and second stage respectively, the first term to the right of the equality in equation (15) is: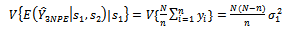 | (16) |
The second term to the right of the equality in equation (15) is: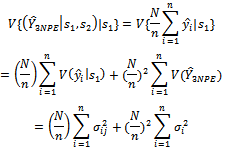
 | (17) |
Equations (16) and (17) give; | (18) |
where 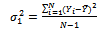 | (19) |
 | (20) |
 | (21) |
We note that the first term to the right of the equality in equation (18) is the variance that would be obtained if every tertiary unit in a selected secondary unit and every secondary unit in a selected primary unit was observed, that is, if  were known for
  . The second term contains variance that would be obtained if every tertiary unit in a selected secondary unit was observed, that is, if
  were known for
  The third term contains variance due to estimating the
  from a subsample of tertiary units within the selected secondary units. An unbiased estimator of the variance of
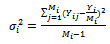
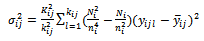
  given in equation (18) is obtained by replacing the population variances with the sample variances as follows:
 | (22) |
where | (23) |
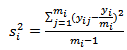 | (24) |
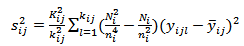 | (25) |
4.2. Theorem 2:  is Unbiased for
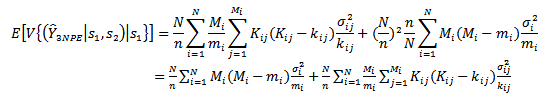
Proof:We note that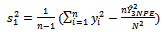 | (26) |
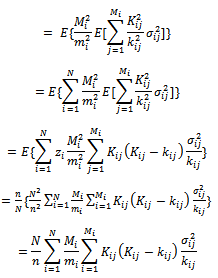
Next, we note that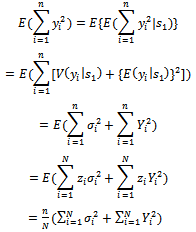 | (27) |
In addition;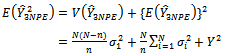 | (28) |
Combining equations (27) and (28), we have: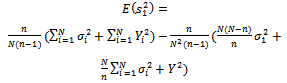
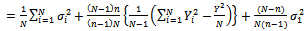 | (29) |
Using the fact that: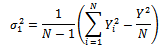 Equation (29) becomes;
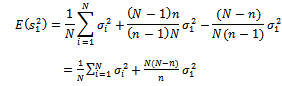 | (30) |
Next, we note that;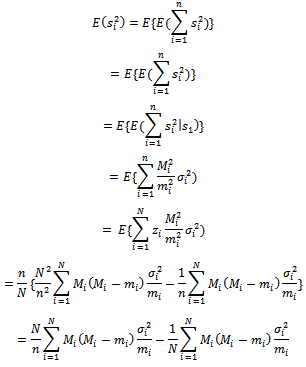 Therefore;
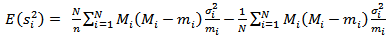 | (31) |
Also;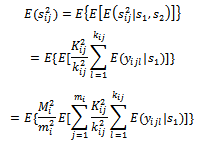
 Therefore;
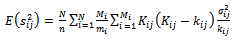 | (32) |
Combining equations (30), (31) and (32), we have;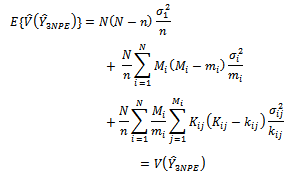 | (33) |
That is;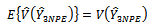 Hence,
  is an unbiased sample estimator of the proposed estimator
  in three-stage cluster sampling design. This estimator,
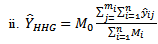
  is then compared with these seven conventional three stage cluster sampling design estimators:
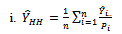 | (34) |
 | (35) |
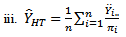 | (36) |
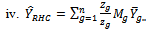 | (37) |
 | (38) |
 | (39) |
and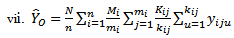 | (40) |
5. Data Used for this Study
There are eight (8) categories of data sets used in this paper. The first four (4) data sets were obtained from[1],[2],[3] and[4] respectively. The second four (4) data sets used are of secondary type and were collected from[16] and[17] where we constructed a sampling frame from all diabetic patients with chronic eye disease (Glaucoma and Retinopathy) in the twenty-five (25) Local Government Areas of the state between 2005 and 2008.
6. Results
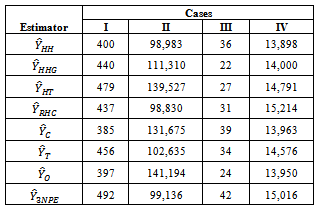
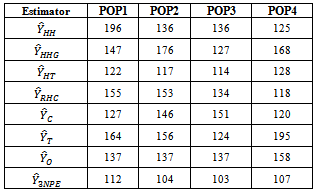
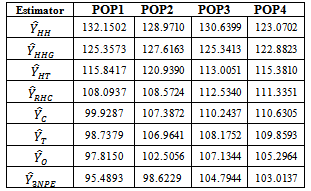
The estimates obtained with the aid of software developed using Visual Basic C++ Programming Language[18] are given in tables 1 - 12 for the illustrated and the real-life data respectively. Table 1. Estimated Population Totals using Illustrated Data
 |
| |
|
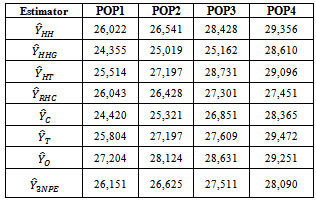
Table 2. Estimated Population Totals using Real Life Data
 |
| |
|
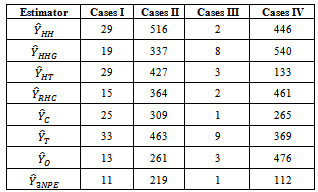
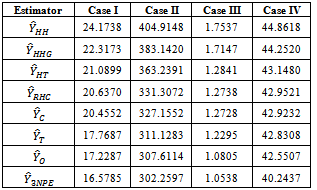
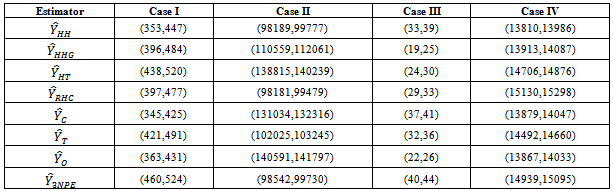
Table 3. Biases of Estimated Population Totals using Illustrated Data
 |
| |
|
Table 4. Biases of Estimated Population Totals using Real Life Data
 |
| |
|
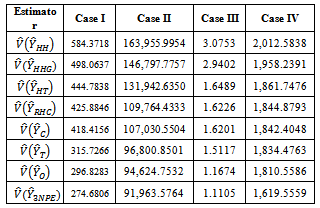
Table 5. Variances of the Estimated Population Totals using Illustrated Data
 |
| |
|
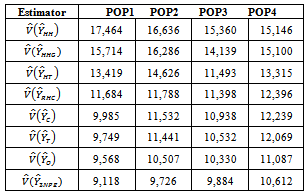
Table 6. Variances of the Estimated Population Totals using Real Life Data
 |
| |
|
Table 7. Standard Error for Estimated Population Total using Illustrated Data
 |
| |
|
Table 8. Standard Error for Estimated Population Total using Real Life Data
 |
| |
|
Table 9. 95% Confident Intervals for Estimated Population using Illustrated Data
 |
| |
|
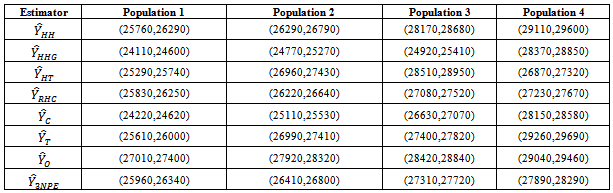
Table 10. 95% Confident Intervals for Estimated Population Totals using Real Life Data
 |
| |
|
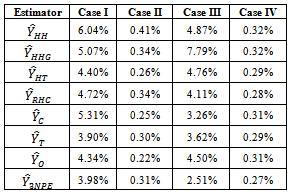
Table 11. Coefficient of Variation for Estimated Population Totals using Illustrated Data
 |
| |
|
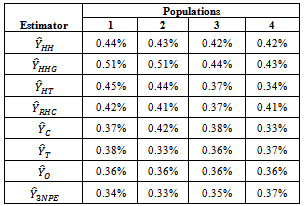
Table 12. Coefficient of Variation for Estimated Population Totals using Real Life Data
 |
| |
|
7. Discussion of Results
The estimation methods given in equation (10) was applied to four different illustrated data (Cases I – IV) and four real life data (Populations 1 - 4). The population totals obtained for illustrated data are given in table 1 while the population totals obtained for real life data are given in table 2. Table 3 give the biases of the estimated population totals for illustrated data for our own estimator as 11, 219, 1, and 112 for cases I – IV respectively while table 4 gives that of the four life data sets as 112, 104, 103, and 107 respectively. This implies that our own estimator has the least biases using both data sets. Table 5 shows the variances obtained using illustrated data for our own estimator as 274.6806, 91963.5764, 1.1105 and 1619.5559 for cases I – IV respectively while table 6 shows that of life data sets as 9118.2037, 9726.4809, 9883.6215 and 10611.8216 respectively meaning that our own estimator has the least variances using both data sets. Table 7 shows the obtained standard errors for the estimated population totals using illustrated data for our own estimator as 16.5785, 302.2597, 1.0538 and 40.2437 for cases I – IV respectively while table 8 shows that of life data sets as 95.4893, 98.6229, 104.7944 and 103.0137 respectively meaning that our own estimator have the least standard errors using both data sets.The confidence intervals of the estimated populations in table 1 are given in table 9 for α=, 5%. The confidence intervals of the estimated populations in table 2 are given in table 10 for α =5 % which shows that all the estimated population totals fall within the computed intervals as expected. For our own estimator, table 11 gives the coefficients of variations for the estimated population totals using illustrated data as 3.98%, 0.31%, 2.51% and 0.27% for cases I – IV respectively while table 12 gives that of life data sets as 0.34%, 0.33%, 0.35% and 0.37% respectively which means that our newly proposed three stage cluster estimator has the least coefficient of variation, hence it is preferred.
8. Conclusions
The alternative estimation method of population allows the use of certain number of visits to the venues (hospitals) within the clusters (cities) and a more precise (minimum mean square error) estimate was obtained and the estimates presented indicate that substantial reduction in the variances was obtained through the use of newly proposed estimator. We also observed that irrespective of the data considered, the variance of newly proposed estimator is always less than those of already existing estimators in three-stage cluster sampling designs. The newly proposed estimator ( ) is preferred to the already existing estimators considered in this study and is therefore recommended.
References
| [1] | Horvitz, D. G. and D. J. Thompson, “A Generalization of Sampling without Replacement from a Finite Universe”, Journal of American Statistical Association, vol. 47 663-685, 1952. |
| [2] | Raj, D., The Design of Sample Survey, McGraw-Hill, Inc., New York, USA, 1972. |
| [3] | Cochran, W.G., Sampling Techniques, Third Edition, John Wiley and Sons , New York, 1977. |
| [4] | Okafor, F., Sample Survey Theory with Applications, Afro-Orbis Publications, Nigeria, 2002. |
| [5] | Kish, L., Survey Sampling, John Wiley and Sons, New York, 1967. |
| [6] | Adams, J. L., S. L. Wickstrom, M. J. Burgess, P. P. Lee, and J. J. Escarce, “Sampling Patients within Physician Practices and Health Plans: Multistage Cluster Samples in Health Services Research”, The Global Journal for Improving Health Care Delivery and Policy, vol. 38: 1625-1640, 2003. |
| [7] | Kuk, A., “Estimation of Distribution Functions and Medians under Sampling with Unequal Probabilities”, Biometrika, vol. 75, 97-103, 1988. |
| [8] | Goldstein, H., Multilevel Statistical Models, Halstead Press, New York, 1995. |
| [9] | Tate, J.E. and M.G. Hudgens, “Estimating Population Size with Two-stage and Three-stage sampling designs”, American Journal of Epidemiology,vol. 165 no.11, 1314-1320, 2007. |
| [10] | Kalton, G., Introduction to Survey Sampling, Sage Publications, Thousand Oaks, C.A., 1983. |
| [11] | Henry, G. T., Practical Sampling, Thousand Oaks, C.A.: Sage Publications, 1990. |
| [12] | Fink, A., How To Sample In Survey, C.A. Sage Publications, Thousand Oaks, 2002. |
| [13] | Kendall, M. G. and A. S. Stuart, The Advanced Theory of Statistics, Hafner Publishing Company, New York, 1968. |
| [14] | Thompson, S. K., Sampling, John Wiley and Sons, New York, 1992. |
| [15] | Nafiu, L. A., An Alternate Estimation Method for Multistage Cluster Sampling in Finite Population, Unpublished Ph.D Thesis, University of Ilorin, Ilorin, Nigeria, 2012. |
| [16] | Niger State, Niger State Statistical Year Book, Niger Press Printing & Publishing, Nigeria, 2009. |
| [17] | National Bureau of Statistics, Directory of Health Establishments in Nigeria, Abuja Printing Press, Nigeria, 2007. |
| [18] | Hubbard, J. R., Programming with C++, Second Edition. Schaum’s Outlines, Tata McGraw-Hill Publishing Company Limited, New Delhi, 2000. |
 Abstract
 Reference
 Full-Text PDF
 Full-Text HTML