Faris M. Al-athari 1, Dhwyia S. Hassan 2, Nathier A. Ibrahim 3, Hani Aziz Ameen 4
1Zarqa University, Department of Mathematics, Faculty of Science and information technology,zarqa 13132, Jordan
2Head Department of Industrial Management, College of Administration & Economic, Baghdad University, Iraq
3Department of Banks Economics, College of Business Economics, Al-Nahrain University, Iraq
4Dies and Tools Eng. Dept., Technical College, Baghdad- Iraq
Correspondence to: Hani Aziz Ameen , Dies and Tools Eng. Dept., Technical College, Baghdad- Iraq.
| Email: |  |
Copyright © 2012 Scientific & Academic Publishing. All Rights Reserved.
Abstract
The paper deals with constructing a model for Bayesian sampling plans for the system “Average out going quality level ”, where the percentage of defectives is varied from lot to lot, so it considered to be a random variable, having a prior distribution
  , which must be fitted to represent the distribution of percentage of defectives efficiently. The parameters of this distribution must estimated, and then used in model construction. The aim of the model is to find the parameters of single Bayesian sampling plan (
 ), the sample size, and the acceptance number (
 ), from minimizing the total cost of the model, which comprises cost inspection and cost of repairing or replacement of defective units. In addition to cost of rejecting goo items, which is a penalty cost. Also the construction depend on decision rule[
 ], for acceptance and decision rule for rejection[
 ]. Finally the build model can be applied to another distribution like Gamma – Poisson, Normal – Beta, to find the sampling plan (
 ) necessary to test the product of the lot and to have a production with accepted
  to satisfy consumer's and producer's risk. All the derivation required to build this cost function are explained and all the results of obtained samples and applications are illustrated in tables.
Keywords:
Bayesian Sampling Plan,  , Beta & Gamma Distribution, Total Cost Function, Producer's , Consumer's Risk
Cite this paper:
Faris M. Al-athari , Dhwyia S. Hassan , Nathier A. Ibrahim , Hani Aziz Ameen , "Using Decision Theory Approach to Bulid a Model for Bayesian Sampling Plans", American Journal of Mathematics and Statistics, Vol. 2 No. 6, 2012, pp. 184-190. doi: 10.5923/j.ajms.20120206.04.
1. Introduction
The term sampling inspection plan, is used when the quality of product is evaluated by inspecting samples rather than by total inspects, which required cost and time. Here we introduce a model for total expected cost function by[7 & 9] whom gives simple information about the elements of this cost function, while[10] introduce the cost model when the percentage of defective is random variable follows Gamma distribution, and suggested to apply another distribution as we done in our research. The build model differs from them by including decision rule[ ] for acceptance and[
 ] for rejection, the posterior distribution
  and finding the optimal value of acceptance number (
 ) is a closed form, also the sample size necessary to take a decision, in a closed form also. The programs required to obtain (
 ),
), and total cost, arte executed.The aim of this paper is to build the total cost of quality control model, used to find the Bayesian sampling plan (
 ) for
) for  system, the method considered the percentage of defectives in lots is random variable having prior distribution f(p). So the method derived used to find Bayesian sampling plan.
2. Methodology of Research
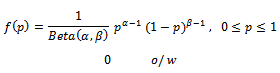
Since the aim of research insist on finding Bayesian sampling plans for system  , where the percentage of defective in production represents random variable varied from lot to lot and have some prior distribution[
 ], which determined from past data and experience, and it may be Beta distribution or Gamma, or Log-Normal or any other distributions. It is necessary to determine the parameters of Bayesian sampling plan (
 ), taken from lot
  by minimizing either (total inspection cost) or minimizing total expected risk, which is the risk due to taking the wrong decision. To satisfy, the aim, first of all we define all notations necessary to build the model, these are;
 : Lot size of product.
 Number of defective units in the lot
  .
. : Percentage of defective in lot
  .
. Percentage of defective in the sample
  .
.  Number of defective in sample.
  Number of defective in Lot.
  Acceptance number
 Cost of sampling and testing unit in the sample.
 Cost of repairing or replacement of defective units in the sample.
  Cost of sampling and testing units in the remaining quantity (
 ) after rejecting sample.
  Cost of repairing or replacement of defective unit in quantity (
 ).
). Cost of accepting good unit and it is not a penalty cost.
 Cost of accepting defective unit.
 Probability of accepting the production with quality
  and it is;
 Probability of rejecting the production with quality
  . Average percentage of defectives in the lot after doing rectifying inspection on it.
 Decision rule for explaining the probability of acceptance the lot (
 ), after knowing the sample
  contains
  defective.
 Decision rule for rejection.
  Mean of the probability distribution of defective.
  Mean of prior distribution
 Mean of posterior distribution
 Break even quality point;
 Prior distribution of percentage of defectives in the lot of product.
 Posterior distribution of percentage of defectives.
3. Construction of the Model
Suppose that 
 | (1) |
And  the percentage of defectives in process is
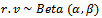
 | (2) |
Therefore 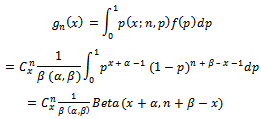 | (3) |
 Is used to find the posterior distribution which is:
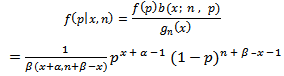 | (4) |
Therefore, the posterior distribution of percentage ofdefectives is also Beta, but with parameters  and with average;
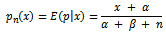 Which can be written in terms of the mean of prior
  i.e.
i.e. as:
as: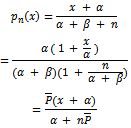 Now; let
 | (5) |
 | (6) |
And let  be break even quality level, which is the point of percentage of defective, at which we cannot distinguish between acceptance decision and rejection, and is defined b
 , and it is also defined in terms of quality control cost parameters.Therefore;
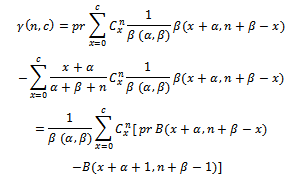 | (7) |
We know that the loss equal zero, when the decision is correct, and the loss is  for wrong decision, i.e.
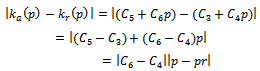 | (8) |
According to that, the equation of expected risk  is defined;
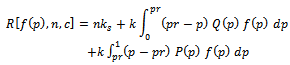 | (9) |
where 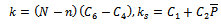
 | (10) |
Using the  , can found the value of expected risk under Binomial process and continues prior distribution. See[9].But here the proposed model depend on definition
  in terms of
  and decision rule
 , and it is defined as follows;
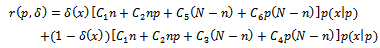 | (11) |
And since  is random variable has
  then the expected value of risk in terms of
  is denoted by
  and it is defined as:
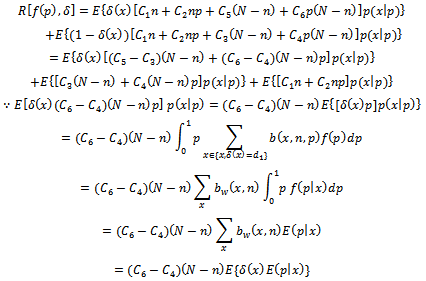 | (12) |
After some steps we have;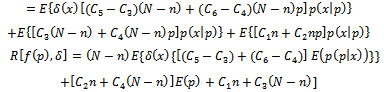
 | (13) |
The minimum value for formula (13) can be verified by; 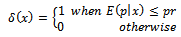 where;
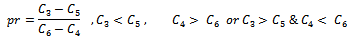 Since equation (13), define the formula of expected risk function in terms of expectation, we want to find it in terms of sampling distribution, this required to take the distribution of defectives in the lot
  , and distribution of
  in sample (n),
  in consideration, and also taking
  the prior distribution of quality of a process, and also define the loss
 this tend us to find the expected value of the loss due to the decision of accepting and rejecting, which is now defined by the following equation;
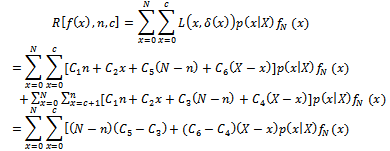 | (14) |
 | (15) |
Putting the following simplification in equation (15), we obtain equation (16);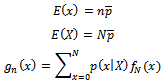 Also substituting;
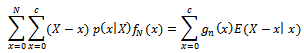 Where;
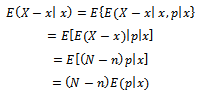 Where,
  is the posterior mean.By applying these expectations in equation (15), we get;
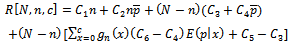 | (16) |
Which can be simplified to;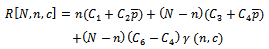 | (17) |
Where;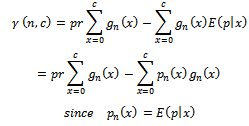 The function in equation (17) considered to be a function of Bayesian single plan to test the product
  and searching for the two values
  which gives minimum value for function (17), can be done by applying the first partial derivatives for the function equal to zero, then solving the two equations, since the distribution of
  is a discrete distribution, so we cannot apply differentiation method, we can apply forward differences method for
  which required writing
  in a fitness way;
 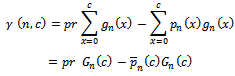 Where;
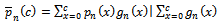 | (18) |
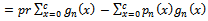
Which represents the weighted mean for 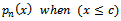 according to the rule of[10], we can summarize the following rule;
  | (19) |
From equation (19), we can get;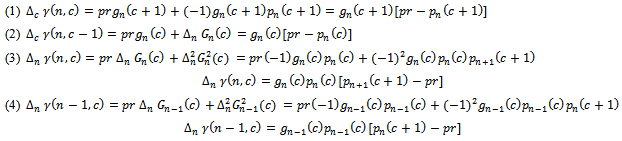 According to Beta – Binomial distribution when
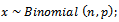
 And,
And, 
 We find
 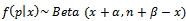 , so the posterior mean is;
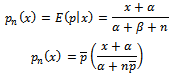 Hence,
 From applying
 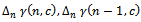 , we find the optimal value of
  acceptance number, which is the value that satisfy;
 | (20) |
And it depend on the estimated values of parameters  and also on the value of sample size which is obtained from minimizing;
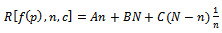 | (21) |
With respect to  , where;
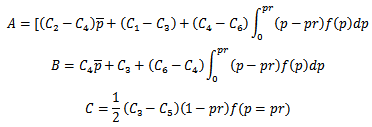 The result of
  now is;
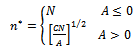 | (22) |
Where  depend on parameters of quality control cost and on
  , so for Beta – Binomial distribution, the values of
  is simplified to:
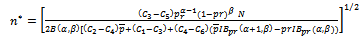 | (23) |
Where;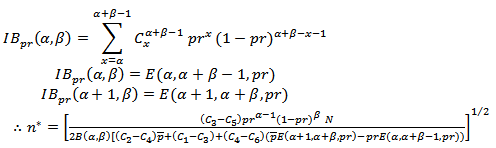 | (24) |
The estimated values of  using moment's method are;
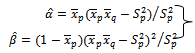 | (25) |
Where,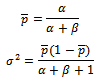
4. Application
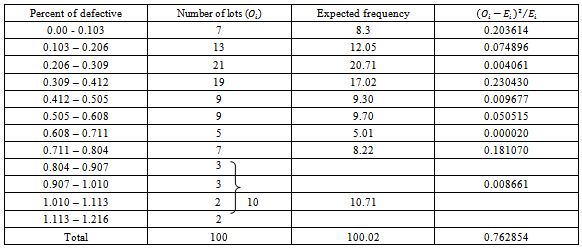
The following data represents the distribution of percentage of defectives for (100) lots taken from Iraqi general company for producing liquid oils, after tests it found to be Beta distribution  The last three classes were grouped since its observed frequencies is less than 5, also we compute the mean of percentage of defectives
  and average
  units, the variance of percentage of defectives
 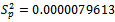 .From equation (25), the estimated values of parameters
  by method of moments are:
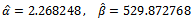
 The value of calculated
  is compared at
  and degree of freedom
 , we find
  for this reason the hypothesis:
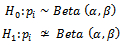 is acceptedTherefore, we depend on prior Beta distribution at estimated parameters;
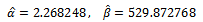 In finding the parameter of single Bayesian sampling plan for the system
  where;
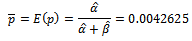 Also, we have obtained the estimated parameter of total cost function, for the lots of product ( from state company vegetable oil ), these are;
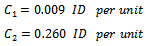

 Also, we find;
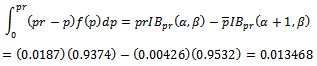
 , is the estimated value of percentage of defective in normal condition which is also denoted by
  is the percentage of defective when the conditions of production is not normal.
 From equation (20) and (24) by using the estimated values of
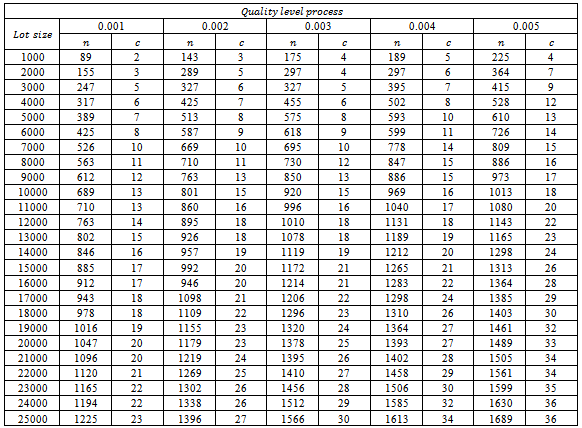
  also for different values of process average
  , the results for different size of lot
  are tabulated in table (2).After testing the distribution of quality in table (1), and estimating parameters, and also computing different parameters of total cost model, we find different values of Bayesian single sampling plan
  and the results are explained in table (2).The above table represents the results of sampling plan
  according to quality level
  and lot size
  , for equation (24) and (20), while for given data in research, we find that the proposed sampling plan when
  units, and
  and also we compute
  from its results found to be equal to
Table 1. Distribution of quality process for 100 lots
 |
| |
|
Table 2. Bayesian sampling plans for
 under Beta prior and due to decision making proposed model under Beta prior and due to decision making proposed model
 |
| |
|
5. Conclusions
(1) The distribution of quality of 100 lots, found Beta prior with 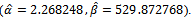 (2) The calculated value of
  compared with
 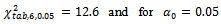 degree of freedom
  since the last class of distribution of quality where grouped, it is found that
  for this reason, the hypothesis
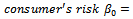
 (3) The value
  is producer's risk and
  is consumer risk, where considered in designing the various sampling plans, and we can use any set of
  . (4) From table (2) we find the sample size
  is increasing when the percentage of defective is increased, which is logical result. (5) The proposed model can be applied to another kind of Bayesian sampling which have Gamma prior, and log – Normal, since it is a general model.(6) From the data, we found that
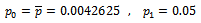
  , which is the estimated value of percentage of defectives in the normal condition of production process, but it's true value found
  which is greater than proposed
 for the factory, this results is logical also because of complex and bad conditions of process of production, we look at the percentage
  is very good now.
References
| [1] | Aslam, M., and Kantam, R.R.L, (2008). "Economic reliability acceptance sampling based on truncated life tests in the Birnbaum - Saunders distribution", Pakistan Journal of statistics 24, 269 – 276. |
| [2] | Aslam, M., S. Balamurali, Chi-Hyuck Jun and M. Ahmad, “Optimal designing of a skip lot sampling plan by two point method”, Pakistan Journal of Statistics, 26(4), 585-592, Oct. 2010. |
| [3] | Baba Md Deros, Chua Yee Peng, Mohd Nizam Ab Rahman,Ahmad Rasdan Ismail and Abu Bakar Sulong,(2008), "Assessing Acceptance Sampling Application in Manufacturing Electrical and Electronic Products" Asian International Journal of Science and Technology in Production and Manufacturing , Vol. 1, No.2, pp. 59-67. |
| [4] | Balamurali, S., M. Aslam and Chi-Hyuck Jun, ( 2012) “Bayesian double sampling plan under Gamma-Poisson distribution”, Research Journal of Applied Sciences, Engineering and Technology, 4(8), 949-956. |
| [5] | Balakrishnan, N. Leiva, V. and Lopez, J. (2007)." Acceptance sampling plans from truncated life tests based on the generalized Birnbaum – Saunders distribution", cmmu. Statis. Simul. And compu. , 36, 643-656. |
| [6] | Birnbaum, M. H. (2008). "New paradoxes of risky decision making" Psychological Review, 115, 453–501. |
| [7] | Guenther, W. C., (1969)," Use of the Binomial hypergeometric and Poisson tables to obtain sampling plans", j. Qual. Technol.,1: 105 – 109. |
| [8] | Guenther, W. C., (1977)," Sampling inspection in statistical quality control", Charles Criffinand company limited. |
| [9] | Guthrie, D. and Jhons , M. V. (1959). "Bays acceptance sampling procedures for large lots", Ann. Math. Stat. 30, 896 – 925. |
| [10] | Hald, A. (1960)," The compound hypergeometric distribution and a system of single sampling inspection plans based on prior distributions and costs". Technometrics 2, 275 – 340. |
| [11] | Hald, A. (1981)," Statistical theory of sampling inspection by attributes", Academic press INC. ( London ). |
| [12] | Hryniewicz, Q., (2008)," Statistics with fuzzy data in statistical quality control", Soft Company. 12:229 – 234. |
| [13] | K. Rajagopal, A. Loganathan and R. Vijayaraghavan,(2009). " Selection of Bayesian Single Sampling Attributes Plans Based on Polya Distribution " Economic Quality Control Vol 24 (2009), No. 2, 179 – 193. |
| [14] | Mohamed Saber Fallah, Seyed Taghi Akhavan, and Mohamed Hossein Abooie, (2011) " A new Acceptance sampling plan based on cumulative sums of conforming Run – Lengths, " Journal of Industrial and systems engineering. Vol.4.No.4, pp256 – 265. |
| [15] | Niaki S.T.A., Fallahnezhad M.S. (2009), Designing an optimum acceptance plan using Bayesian inference and stochastic dynamic programming; Scientia Iranica 16; 19-25. |
| [16] | Saima Altaf, and Muhamed Aslam, (2011), " Bayesian analysis of the Davidson model for paired comparision with order effect using non informative priors", Pak. J. Stats. Vol. 27(2), 171 – 185. |
| [17] | Sanka Dey, (2008)" Minimax estimation of the parameter of the Rayliegh distribution under quadratic loss function", Data Science Journal, Vol. 7,23. |
| [18] | Stewart, N., & Simpson, K. (2008). A decision-by-sampling account of decision under risk. In N. Chater &M. Oaksford (Eds.), The probabilistic mind: Prospects for Bayesian cognitive science (pp. 261–276). Oxford, England: Oxford University Press. |
| [19] | Stewart, Neil, (2009), "Decision by sampling: the role of the decision environment in risky choice". Quarterly Journal of Experimental sychology, Vol.62 (No.6). pp. 1041-1062. ISSN 1747-0218. |
| [20] | Tang, K. (1988)," Economic design of product specifications for a complete inspection plan", International Journal of production research, Vol. 26. No. 2, 203 – 219. |
 Abstract
 Reference
 Full-Text PDF
 Full-Text HTML