-
Paper Information
- Next Paper
- Paper Submission
-
Journal Information
- About This Journal
- Editorial Board
- Current Issue
- Archive
- Author Guidelines
- Contact Us
American Journal of Mathematics and Statistics
p-ISSN: 2162-948X e-ISSN: 2162-8475
2012; 2(6): 164-168
doi: 10.5923/j.ajms.20120206.01
Geostatistic Approaches for Investigating of Soil Hydraulic Conductivity in Shahrekord Plain, Iran
 Abstract
 Reference
 Full-Text PDF
 Full-Text HTML
M. Moradi 1, D. Ghonchehpour 1, A. Majidi 1, V. Mahmoudi Nejad 2
1Graduate Watershed management, Natural Resources Faculty, Hormozgan University, Iran
2Graduated Geographyic Information System and Remot Sensing of Shagid Beheshti University, Iran
Correspondence to: A. Majidi , Graduate Watershed management, Natural Resources Faculty, Hormozgan University, Iran.
| Email: |  |
Copyright © 2012 Scientific & Academic Publishing. All Rights Reserved.
Soil hydraulic conductivity is the most important physical parameter that impresses drainage projects from technical perspective. The purpose of this study is the investigation of spatial changes of hydraulic conductivity, calibration, and feasibility of using various methods of geostatistic in Shahrekord Plain in the West of Iran. Hence Kriging (K), Inverse Distance Weighting method (IDW), Local Polynomial Interpolation (LPI) and Global Polynomial Interpolation (GPI) methods were used for interpolation. For evaluation these methods we used Cross-Validation Technique with MAE and MBE statistical criteria. Studies showed that spatial correlation of hydraulic conductivity in this region is weak and kriging was recognized as suitable method (C0/Sill = 81%). Ordinary kriging method contains the lowest rate of MAE and MBE. In fact, the high flexibility of this method than the other methods studied shows the high accuracy of this method because of having variety models and parameters. Also results showed that ordinary kriging with a circular model are the most suitable method for interpolation in zoning the hydraulic conductivity because of lower errors and relative deviation.
Keywords: Hydraulic conductivity, Shahrekord Plain, Geostatistic, Interpolation, Iran
Cite this paper: M. Moradi , D. Ghonchehpour , A. Majidi , V. Mahmoudi Nejad , "Geostatistic Approaches for Investigating of Soil Hydraulic Conductivity in Shahrekord Plain, Iran", American Journal of Mathematics and Statistics, Vol. 2 No. 6, 2012, pp. 164-168. doi: 10.5923/j.ajms.20120206.01.
Article Outline
1. Introduction
- The saturated hydraulic conductivity (Ks) is of utmost importance to drainage design and affects the economic and technical feasibility of large-scale subsurface drainage projects. However, it is one of the most difficult factors to evaluate in any drain spacing equation[13]. Spatialdistributions of the properties of natural aquifers, such as hydraulic conductivity (K), often exhibit high heterogeneity. However, in a field investigation, only a small fraction of in situ data can be analysed, owing to time and cost constraints[11]. Geostatistical Tools have helped researchers in the study of the large variability that Ks often exhibit in soils[17]. Geostatistics provides a set of statistical tools forincorporating spatial and temporal coordinates of observations in data processing[7]. Mapping of soil attributes in unsampled areas is the main contribution of geostatistics to soilscience[8,6,5,3]. Geostatistics provide a great aid to explore/model patterns of space/time dependences between soils data[15]. There are many studies in soil sciences that have used geostatistic[16,14,2]. Adhikari et al applied Ordinary Kriging techniques to characterize the spatial variation of soil texture i.e. sand and clay content on the basis of 100 samples collected over a forest mixed agriculture farming area covering about 250sq. km of Zala County in western Hungary. They resulted that geostatistical techniques are useful to analyze the spatial distribution of soil texture content[1]. Moustafa et al examined that which spatial structure measure, the semi-variogram or the covariance variogram, is appropriate for inference of the spatial structure and performing interpolation of soil–water properties from sample data sets. The results showed that the covariance variogram reveals the character of spatial structure and that it is more appropriate for interpolation than the semi-variogram[12]. Yi Ju et al applied Kriging and cokriging methods to estimate the spatial distribution of soil properties from available large-scale survey data of Taiwan. The results suggested that by kriging and cokriging, the existing sampling density could be decreased under the large-scale sampling interval by nearly half and that sufficient spatial information about the soil properties could still be retained[21]. Irrig et al in their study showed that how kriging can improve the representation of hydraulic conductivity for subsurface drainage desins. Results showed that variations of the hydraulic conductivity were isotropic, with a high nugget effect. Kriging allowed clear identification as contour maps that could be used to determine blocks of homogeneous hydraulicconductivity[10]. Because of extensive use of geostatistic methods in soil sciences and efficiency of these methods for studying soil properties[19,9,18,20], we used Kriging (K), Inverse Distance Weighting method (IDW), Local Polynomial Interpolation (LPI) and Global Polynomial Interpolation (GPI) methods to evaluate the spatial correlation of hydraulic conductivity of soil at Shahrekord Plain Plain.
2. Data and Methodology
2.1. Study Area
- The study plain is part of Shahrekord watershed in South west of Iran. It is located at 50◦41'17" to 51◦01'27" east longitudes and 32◦07'02" to 32◦35'6" north latitudes with about 58461 hectare and Geology of the Cretaceous limestone formation located on alluvial deposits and include old, new and old terrace deposits is related to the Quaternary. Figure (1) shows location of Shahrekord plain.
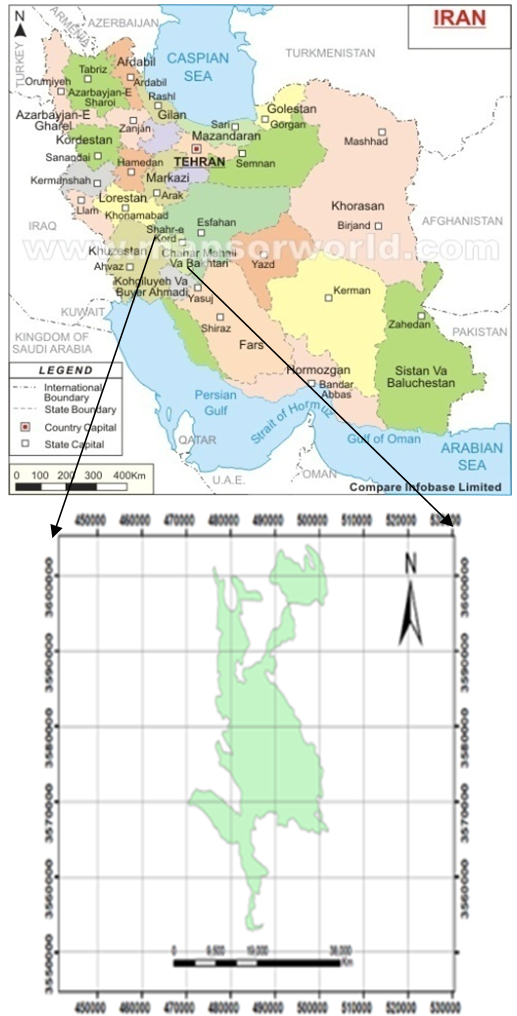 | Figure 1. Shahrekord plain location (Shahrekord province) |
2.2. Study Method
- In this study the 524 wells hydraulic conductivity data of Shahrekord Plain are used as statistics references. After preparing reference maps like geology, pedology and topography map in 1:50000 scales, spatial variety of hydraulic conductivity investigate with different methods of interpolation. Point data extend to area data with ordinary Kriging, IDW1 , LPI2, GPI3 Methods and ArcGIS9.3 Software. Then different methods evaluate with cross validation technique and MAE4 and MBE5 Criteria. And finally hydraulic conductivity was provided. For importance of Kriging, its properties are described in paper.
2.2.1. Kriging
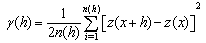
- Presentation errors map and variance reduction in weighting for estimating is the benefits of Kriging against others interpolation methods. Errors in this method are independency from variable and dependent to spatial location and it cause to predict the best location sampling is possible. Variogram relationship based on the measured points is as follows:
 | (1) |
 : is the variogram for a distance (lag) h between observations z(x) and z(x+h). n(h): is the number of pairs of observations which are at distance h. z(x): the observed variable. z(x+h): the observed variable is the h distance from z(x) and variogram
 . Variogram is similar to variance in classic statistic but against variance that is around average, variogram show two samples differences. The main purpose of variogram calculating is investigating variability of variable ratio distance of place or time. For this reason, is necessary to draw a graph with summary of mean square differences of pair points that located at h as x axis. Figure (2) shows variogram indexes.
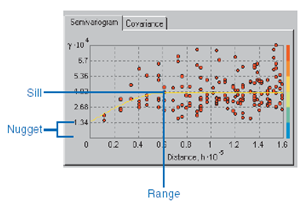 | Figure 2. Components of variogram |
2.2.2. Validation
- Cross-validation consists of removing data, one at a time, and then trying to predict it. Next, the predicted value can be compared to the actual (observed) value to assess how well the prediction is working. In this research MAE and MBE are used to evaluate predicted value with ordinary Kriging and local interpolation methods that are calculated with below functions:
 | (2) |
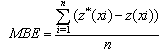 | (3) |
 = predicted value in xi point and
  = actual value in xi point and n= number of observations.With the least quantity of two indexes, accuracy increase. Whatever the value of these two factors is less, the accuracy of method is more. Theoretically, whenever these factors are equal zero, the accuracy of method is 100% and estimated value of a quantity is exactly equal to its actual value.
 3. Results and Discussion
- The first step in using geostatistic method is investigation of the spatial structure of the data by analysing semivariogram. Normalizing the data is the condition of using this analysis. By investigating two methods of QQPlot and data histogram specified that the data are not normal. Therefore, the data transferred to data log by means of that the data follow from normal distribution. Data histogram graph after converting logarithmic showed in figure (3).Considering above histogram, data mean and median are very close (mean= 1.1971, median= 1.1923). Therefore, the data with converting logarithmic were converted to normal distribution.
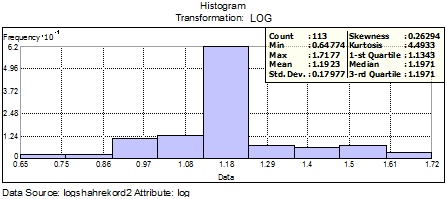 | Figure 3. Data log histogram of hydraulic conductivity |
|
|
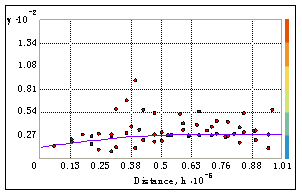 | Figure 4. Semivariogram of hydraulic conductivity |
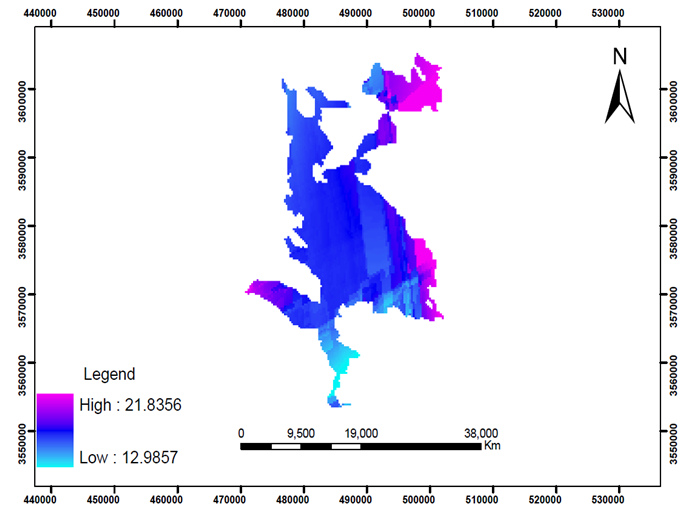 | Figure 5. Mapping of Soil hydraulic conductivity in Shahrekord Plain |
4. Conclusions
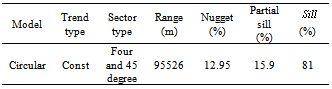
- Evaluation of various interpolation methods show that Semivariogram of hydraulic conductivity in Shahrekord Plain follow from circular model. Also results of table (2) show that between all the interpolation methods that were used in this research, ordinary Kriging has the least error and standard deviation. In the other hand IDW has good accuracy but it has partly high standard deviation. In Kriging method estimation variance is minimum and also using various models of semivariogram in this method show its high flexibility. Based on this, hydraulic conductivity map in Shahrekord plain by using of ordinary kriging method was produced (figure 5). Generally semivariogram analysis results showed weak spatial correlation for studied plain hydraulic conductivity. Climatic and hydrogeology conditions and soil youth may be the basic factors of hydraulic conductivity spatial correlation weakness[4]. Heterogeneous of region and soil structure can be the most important of weak spatial correlation of soil hydraulic conductivity in this region. This research results corresponds with results of studies such as Rogers et al[19] and Hosseini et al[9] based on lack of spatial correlation of soil hydraulic conductivity. Region conditions (climate, hydrology and hydrogeology) have significant influence on spatial correlation of various geostatistic methods and in geostatistic methods analysis, knowledge of desired watershed base on mentioned conditions can be helped us in interpretation of various geostatistic methods results. We offer with regard to soil hydraulic conductivity depends on several factors, If possible, these factors also are used as auxiliary variables.
Notes
- 1. Inverse Distance Weights 2. Local Polynomial Interpolation 3. Global Polynomial Interpolation4. Mean Absolute Error5. Mean Bias Error