-
Paper Information
- Next Paper
- Previous Paper
- Paper Submission
-
Journal Information
- About This Journal
- Editorial Board
- Current Issue
- Archive
- Author Guidelines
- Contact Us
American Journal of Mathematics and Statistics
p-ISSN: 2162-948X e-ISSN: 2162-8475
2012; 2(5): 129-138
doi: 10.5923/j.ajms.20120205.05
Mixture Model for Individual and Combined Data Using Estimating Equations
 Abstract
 Reference
 Full-Text PDF
 Full-Text HTML
Pali Sen , Jacy R. Crosby
University of North Florida, Department of Mathematics and Statistics, FL. 32224, Jacksonville
Correspondence to: Pali Sen , University of North Florida, Department of Mathematics and Statistics, FL. 32224, Jacksonville.
| Email: |  |
Copyright © 2012 Scientific & Academic Publishing. All Rights Reserved.
When performing analysis of individual data on the application of a particular drug, it is useful to study the within variability. But when two drugs are used in combination, it is of more interest to study any combination effects on the subjects. In this paper we consider a new analytical framework that is a combination of the individual and combined data analyses, based on an estimating equation approach. The proposed analyses utilize a stochastic model for a two-drug combination and derive the mean and the variance terms based on Ito’s calculus. The proposed estimation methods are used to estimate model parameters from both individual and combined data, and they provide the basis for model free synergy tests. The strength of the fit of the model to the data is examined by statistical measures and the graphical method. Simulation studies were performed to show the strengths of the proposed approach in estimating the model parameters. A synergy test of the model fitted by the individual subjects confirmed that the combination of the isomers under study is synergistic in nature.
Keywords: Drug Interactions, Stochastic Differential Equations, Isomers, Synergy
Article Outline
1. Introduction
- Combining drugs in biological systems is a common practice, and the effect can be one of three types: additive, synergistic, or antagonistic. Mathematical modeling is often used to describe the relationship of two drugs. One such model, referred to as the most suitable, is the Loewe additivity model under the assumption of no interactions in the model as in[1]. This model refers to a combination of two concentrations of drug A and drug B being additive and equivalent to an interaction effect. Reference[2] has established an extension of a model free test for synergy in multiple drug combinations. Reference[3] used additive models generated from stochastic differential equations for combinations of two aesthetic agents. In this paper, we use the later approach for making the model for data involving two isomers applied in combination. We propose the necessary and sufficient conditions to validate the reference[2] test. It is well-known that the flow of a chemical in the human body and its concentration at various times can be described by differential equations. After an initial dose of the chemical is injected into the system, some of it will escapefrom the system and some will remain to decay over time. Observation of this phenomenon suggests that the concentration
 of the chemical in the system at time t can be modeled by a linear differential equation of the form
  | (1) |
 is a positive constant that denotes the relative rate of elimination of the chemical from the body and
  is a generally decreasing function. The model is based on one- compartment linear model with infusion. Kinetic models of this type have been extensively studied (see e.g. the book of[4], papers of[5],[6] and many other works). As pointed out in[7], the function
  may be subject to random fluctuations from a variety of physical and physiological sources. This has led to the introduction of stochastic versions of the model (1), where the function
  is assumed to contain a white noise component. In this case, equation (1) is more properly interpreted as a stochastic differential equation
 | (2) |
 is a Wiener process and
  and
and  are deterministic functions. Models of this type have been studied in[7],[8],[9],[10],[11] and others. An important feature of these works is the calculation of the internal variability of the system as defined by the variance of the process
  .The objective of this paper is to develop a stochastic model to study the nature of the interaction of two isomers, S and R, acting in combination on a single individual. We assume that the combined concentration is an a priori unknown linear combination of the two isomers. We determine this linear combination using a synergy test. The underlying methodology is as follows. The amounts of isomer S and isomer R in the system at any given time are assumed to follow diffusion processes
  and
and  of the form (2), driven by the same Wiener process
  . We further assume that the combined concentration
  of the chemicals is given by the linear combination
  of the two processes, for some values of
  and
and  to be determined numerically. In Section 2, we give formulae for the mean and variance of the process
  and identify the distribution of
  as Gaussian. The dataset is described in section 3, followed by the description of the synergy test and the statistical methodologies in the subsequent sections. We present results in section 6 and a simulation study comparison in section 7. In Section 8, we provide the discussion of the findings.
 2. Distribution Theorems
- We specialize the model (2). Assume that the level of concentration
 of the isomer in the system follows a linear stochastic differential equation of the form
 | (3) |
 is the initial amount of isomer,
  is its rate of absorption,
  is a diffusion constant, and
  is a standard Wiener process. The rates
  ,
,  , and the diffusion coefficient
  are considered to be constants. We assume that the initial concentration
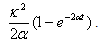
  is zero. The following results will be needed in Section 6. Theorem 1. For each
  , the random variable
  has a Gaussian distribution with mean
 | (4) |
 | (5) |
 | (6) |
 for i =1, 2. Since the chemicals are acting simultaneously, we assume the equations for
  and
and  are driven by the same noise process
  . Set
. Set 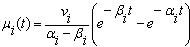 | (7) |
 | (8) |
 denote the process
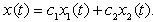 | (9) |
 is Gaussian with a mean
 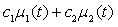 | (10) |
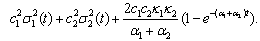 | (11) |
 and
and  are initial amounts,
  and
and  are the rates of eliminations,
  and
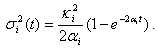
and  are the rates of absorptions for two chemicals.
  and
and  represent the variability coefficients within each process, and
  and
and  are two constants as used in equation (9). We refer the
  and the
 as the main parameters for the model,
  as the variance parameters, and
  as the synergy parameters.
3. Description of Data
- This study focuses on the concentrations of two stereoisomers, referred to as S and R, in the human bloodstream. Isomers are essentially identical chemical substances that differ only in their stereochemistry. That is, the elemental make-up of the substances is exactly the same, but the 3-dimensional positioning is different. Specifically for S and R isomerism, certain components of the compound are arranged in a different circular pattern about the center. S isomers indicate “left-hand” arrangements while R isomers indicate “right-hand” arrangements. These differences are often compared to the direction of spokes on a wheel as in[12].When the experiment begins, a blood sample is taken from each of seven volunteers (referred to as subjects). It is determined that the isomers are not present in any of the initial blood samples. That is, the concentration at time zero is 0 ng/mL as in[13]. A mixture containing equal parts of both isomers is applied via eye drops to the subjects at a rate of one drop per minute for three minutes. At the five minute time mark and eleven intervals thereafter, blood samples are taken from each subject and the concentration (in ng/mL) is recorded. We define the concentration of the single dose (either R or S) by the concentration amount of the isomer over eleven time points. We also define the concentration of the combined dose by using the sum of the S and R concentrations over the corresponding eleven time points.
4. A Study for Synergy
- Reference[14] proposed a synergy test of two-drug combinations that does not require modeling a response surface. They have used a Model Free Test (MFT) to establish a sufficient condition for synergy at a combination dose. The paper discusses the study of two or more agents in combination of dose ratios and describes synergy as it applies to dose equivalents of the mathematical equation of the form below.
 | (12) |
 is the dose (or concentration) of the ith drug given in a combination of n drugs and
  is the dose (or concentration) of the ith drug given individually that would produce e, the magnitude of the combination concentration. If the value of the left-hand side of the equation (12) is less than 1, the effect is synergistic; if the effect is greater than 1, the effect is antagonistic. The equation (12) defines the theoretical, or more precisely, the e-theoretical line of dose additivity, where
  lies on an e-isobole as in[14]. Here the authors describe the e-theoretical line as the line connecting the dose points of
  to
to . The e-isobole is the curve describing the different dose combinations between
  and
and  . Depending on the position on the line, one can determine if the combination is synergistic or antagonistic. Their proposed method for establishing a sufficient condition for a synergy test uses an arbitrary line through
  given by
  where
where  is a given dose point.In the fixed ratio design, as in[15] of two drugs, individual compounds are combined together in amounts such that the proportion between them is constant. In other words for two levels of drugs we look at linear combinations of the form
 or
or 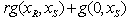 , which must either be greater than, less than, or equal to 1. In the expression,
  is a function of two drugs,
  , and
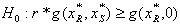
, and  are the functions of one drug in the absence of the other and r is the correlation coefficient that depends on the ratio of the combination of the two. For the synergy, we use the following tests,
 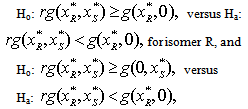 for isomer S, for a specified value of r. A necessary condition for this hypothesis test is that the power for the specified value of r is at least 0.5. Also, since correlation is time dependent and expected to change as concentration combination changes, we establish a bound on r for significant results of the synergy tests for all subjects.
5. Statistical Methodology
- The NLIN procedure in SAS uses the mean and variance calculated from the stochastic model without any assumptions about the parametric form of the distribution. The procedure uses the least squares method to fit the curve to the observations and estimate the model parameters. The process requires that the first derivatives of the equation with respect to each model parameter to be estimated. Mean Squared Error (MSE) is calculated as a result of convergence of the NLIN procedure. The NLMIXED procedure in SAS requires that the mean and the variance expressions for the equations be supplied as the initial input with the assumption that model has a normal distribution with the stated parameters. The procedure uses maximum likelihood estimates of the parameters while fitting the model to the observations. It includes information about the mean and variance for the combined data, and hence we estimate the combination coefficients
 and
and  of the drug efficacies. We use individual data for later analyses where
  and
and  are considered to be known constants. Akaike’s information criterion (AIC) is a useful statistic for statistical model evaluation and has been widely accepted in some areas of statistics, eg. See[16]. It is calculated for each selected model as AIC = (n)ln(SSE/n) + 2k , where k is the number of parameters to be estimated and SSE stands for sum of squared errors. A low value for AIC indicates a better fit as described in[17]. The value of AIC is computed after the convergence of the NLMIXED procedure. The value of AIC is calculated for NLIN procedure from the respective MSE values. As suggested in[18] we use the Wilcoxon Rank Test for the linear combination of hypotheses, that were described in the synergy test establishes a sufficient condition for rejecting the hypotheses at a .05 significance level. Since the distribution of the time data for each subject is unknown, the nonparametric min test is appropriate and widely used. We perform the power study using the WILCOX.TEST procedure in R for a simulation size of 5000 data sets. For the synergy hypotheses, we test seven pairs of hypotheses against one-sided alternatives, one pair per subject on each isomer type for combined and individual data. For model (9), using R software we generate 20,000 data sets for each patient using the estimated parameters from both the NLIN and NLMIXED procedures. We supply the initial estimates of the parameters, and use the NLS function to check the convergence of the model parameters to their initial values.
 6. Results
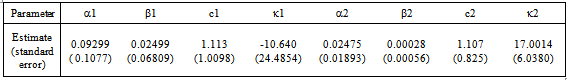
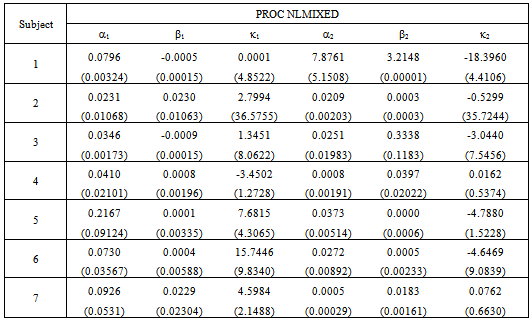
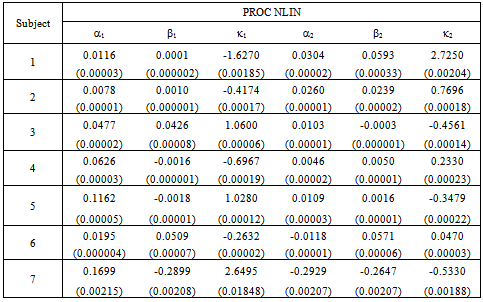
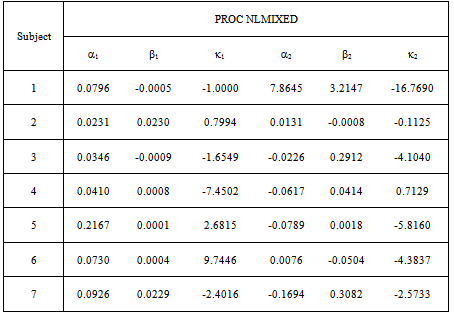
- The initial dose amounts are considered known and used as constants throughout the analyses. We use the combined data for seven patients to estimate the parameters in equation (9). We use the equations (10) and (11) to input the mean and variance required in the procedure. NLMIXED was necessary to incorporate the subjects as blocking variables. This allowed us to analyze the data in its entirety and estimate the synergy parameters
 and
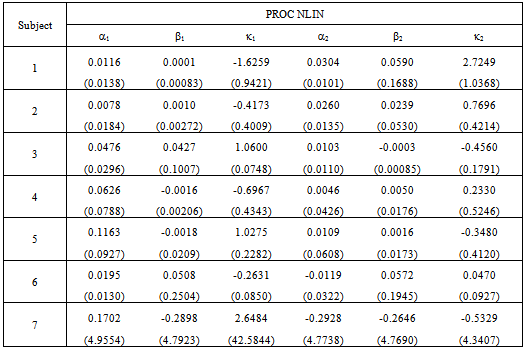
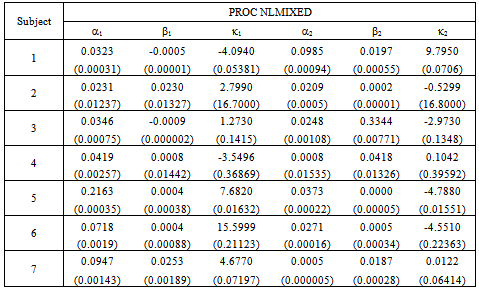
and  as given in Table 1. This capability is not available from the NLIN procedure.However, we use the individual data to estimate mean and variance parameters for seven subjects using both the NLIN and NLMIXED procedures. The results are presented in Tables 2 - 3, using the given coefficients of
  and
and  from Table 1.
|
|
|
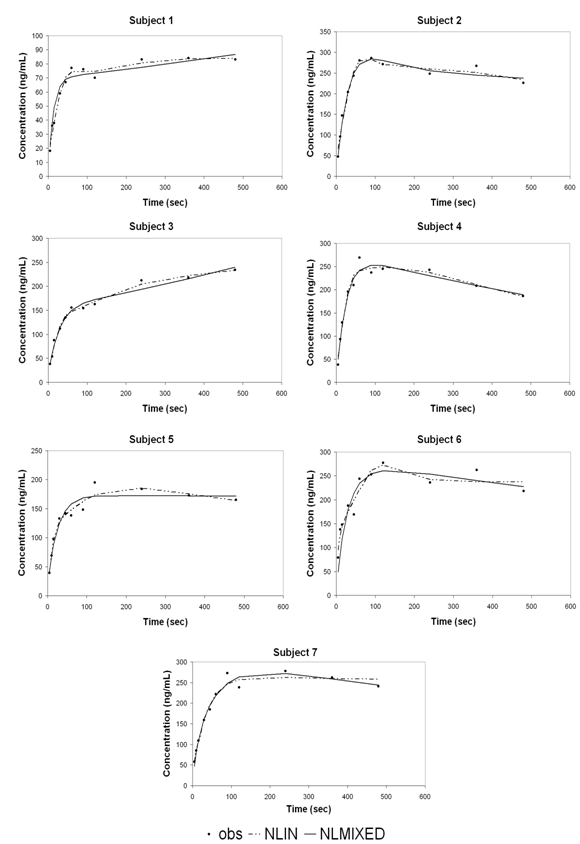 | Figure 1. Concentration versus time for individual subjects plotted with estimated curves by NLIN (dotted lines) and NLMIXED (solid lines) methods on the observed values |
 and
and . In Figure 2, we use the same line setup and place the correlation bounds to show the synergistic power and possible location for the dose combination of the data.
|
| |||||||||||||||||||||||||||||
 for subjects 1 – 7 using the isomer R
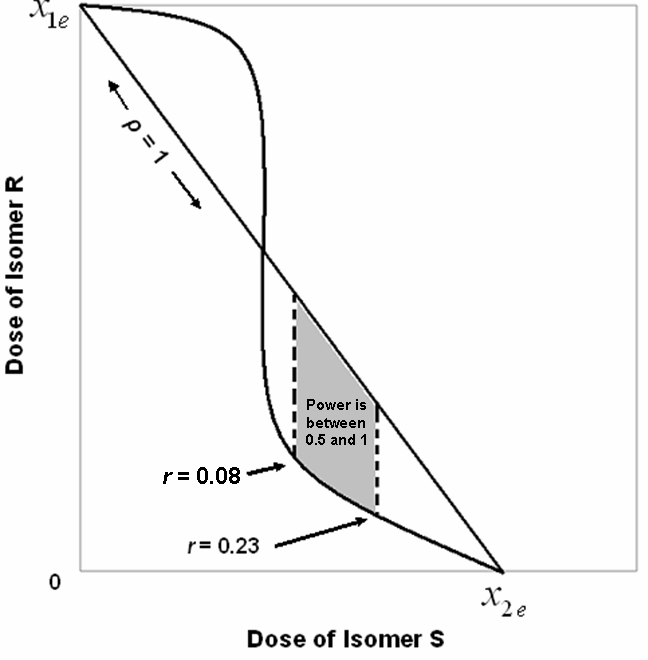 | Figure 2. A hypothetical isobologram with the estimated bounds for the correlation coefficient and the corresponding power is shown here. Note that the isobole curve represents only a sampling of the possible dose combinations |
| ||||||||||||||||||||||||||||||||||||||||||||||||||||||||||
 for subjects 1 – 7 using the isomer S
7. Simulations and Efficiency Comparison for Parameter Estimations
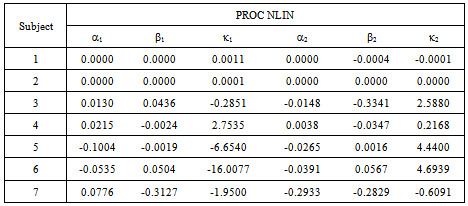
- A Bootstrapping Monte Carlo simulation study was conducted for individual subjects to compare the inferential performance of the NLIN and NLMIXED procedures described in section 5. We considered the parameter estimates from the data as the initial starting points. After 20,000 iterations, the estimates converged to assigned criteria and produced the average of each parameter value with the corresponding standard deviation. We used the known estimates of
 and
and  in the simulation to be consistent with the synergy test.In most cases in Tables 8 – 9 the estimates are very close to the true parameters in Tables 2 - 3. Differences shown in Tables 10-11 indicate that some of the variance
  parameters were incorrectly estimated by the data, though the main parameter estimates were quite close. There was only one indication of a large difference that was detected by the simulation. Table 11, the NLMIXED difference table shows a large difference for two main parameter estimates for Subject 1.
|
|
|
|
8. Conclusions
- In this paper we have addressed one very important question of drug combination. Pharmacology studies deal with combined data that are interactive in nature. In mathematical terms an interaction is usually represented by multiplication of terms. It is not quite clear for drug interactions whether the combined concentrations are additive, multiplicative, or inhibitive in nature. Combination of isomers in eye doses gives a reason to test for synergy to assert the researchers’ effort to show an additive effect. The proposed model uses very simple stochastic differential equation techniques to solve for the model mean and variance in closed form. The two different statistical procedures are used here to confirm that our model has the flexibility for use by practitioners. The proposed model is simple in nature and uses a limited number of dose combinations. We were faced with the challenge of using the existing data. But the data collection can be done based on the recommendations in the paper[14]. While many other methods of drug assessment and model building are available, our model tests for a mathematical synergy instead of a biological synergy. A biological synergy may or may not happen in the experiment; but, if data are collected based on the combined dose levels as suggested by other researchers, a mathematical synergy can be tested as shown in this paper.
References
| [1] | R., O’Brien Straetemans,, T., Wouters, L., Van Dun, J., M Janicot, L. Bijnens, T. Burzykowski, M. Aerts, “Design and analysis of drug combination experiments,” Biometrical Journal, 47, 3, 299-308, 2005. |
| [2] | P. Feng, C. Kelly , “An extension of the model free test to test synergy in multiple drug combinations,” Biometrical Journal, 46, 3, 293-304, 2004 |
| [3] | P. Sen, D. Bell, “A model for the interaction of two chemicals,” Journal of Theoretical Biology, 238, 652-656, 2006. |
| [4] | J. A. Jacquez, J.A., Compartmental analysis in biology and medicine, Michigan: University of Michigan Press, 1985. |
| [5] | P. Sen, , D. Mohr, “A kinetic model for calcium distribution,” Journal of Theoretical Biology, 142, 179-188, 1990. |
| [6] | D. Krewski, R.T. Burnett, W. Ross, “Statistical foundations of pharmacokinetic modeling,” in New Trend in Pharmacokinetics, Volume 221, eds. A. Rescigno,,A.K. Thakur, New York: Plenum Press, 1991. |
| [7] | L. Ferrante, S. Bompadre, L. Leone, “A stochastic compartmental model with long lasting infusion,” Biometrical Journal, 45, 2, 182-194, 2003. |
| [8] | J. H. Matis, H.O. Hartley, “Stochastic compartmental analysis: model and least squares estimation from time series data,” Biometrics , 27, 77–102, 1971. |
| [9] | J.H. Matis, T.E. Wehrly, C.M. Metzler, (1983), “On some stochastic formulations and related statistical moments of pharmacokinetic models,” Journal of Pharmacokinetics & Biopharmaceutics, 11, 77–92, 1983. |
| [10] | J.H. Matis, “An introduction to stochastic compartmental models in pharmacokinetics,” in Pharmacokinetics, Mathematical and Statistical Approaches to Metabolism and Distribution of Chemicals and Drugs, eds. Pecile, A., Rescigno, A., New York: Plenum Press, 1988. |
| [11] | P. Sen, D. Bell, D. Mohr, D. “A calcium model with random absorption: a stochastic approach,” Journal of Theoretical Biology, 154, 485-493, 1992. |
| [12] | J. McMurry, Organic Chemistry, California: Brooks/Cole Publishing Company, 1988. |
| [13] | T.E. Bradstreet, "Favorite data sets from early phases of drug research - Part 2," Section on Statistical Education of the American Statistical Association, 219-223, 1992. |
| [14] | E. M. Laska, M. Meisner, C. Siegel, “Simple design and model-free tests for synergy,” Biometrics, 50, 834-841, 1994. |
| [15] | R. J. Tallarida, “ Drug synergism and dose-effect data analysis”, Florida: Chapman & Hall/CRC, 2000. |
| [16] | H. Bozdogan, “Model selection and Akaike’s information criterion (AIC): The general theory and its analytical extensions,” Psychometrika, 52, 3, 345-370, 1987. |
| [17] | P. Sen, “Model selection for a chemical inhibition process,” Calcutta Statistical Association Bulletin, 55, 109-118, 2004. |
| [18] | E.M.Laska, M. Meisner, “Testing whether an identified treatment Is best,” Biometrics, 45, 1139-1151, 1989. |