-
Paper Information
- Next Paper
- Previous Paper
- Paper Submission
-
Journal Information
- About This Journal
- Editorial Board
- Current Issue
- Archive
- Author Guidelines
- Contact Us
American Journal of Mathematics and Statistics
p-ISSN: 2162-948X e-ISSN: 2162-8475
2012; 2(5): 120-128
doi: 10.5923/j.ajms.20120205.04
Survival Analysis of CABG Patients by Parametric Estimations In Modifiable Risk Factors - Hypertension and Diabetes
 Abstract
 Reference
 Full-Text PDF
 Full-Text HTML
M. Saleem 1, Zafar Mahmud 2, K. H. Khan 3
1Centre for Advanced Studies in Pure and Applied Mathematics Bahauddin Zakariya University Multan, Pakistan
2Department of Mathematics: COMSATS Attock, Pakistan
3Department of Mathematics, College of Science and Humanities, Salman Bin AbdulAziz University, Al Kharj, Saudi Arabia
Correspondence to: M. Saleem , Centre for Advanced Studies in Pure and Applied Mathematics Bahauddin Zakariya University Multan, Pakistan.
| Email: |  |
Copyright © 2012 Scientific & Academic Publishing. All Rights Reserved.
In this paper, modifiable risk factors (hypertension and diabetes) of Coronary Artery Bypass Graft Surgery (CABG) patients are considered. The objective is to analyse survivor’s proportions of CABG patients in the considered risk factors, in complete and incomplete Populations, using suitable survival models. A new approach of complete population from its incomplete population of CABG patients of 12 years observations is used for the survival analysis. In the complete population, censored patients are proportionally included into the known survived and died patients respectively. The availability of a complete population may represent better behaviour of lifetimes / survival proportions for medical research. Survival proportions of the CABG patients of complete and incomplete populations, with respect to the risk factors (hypertension and diabetes) are obtained from suitable, lifetime representing models (Weibull and Exponential). Maximum likelihood method, in-conjunction with Davidon-Fletcher-Powell (DFP) optimization method and Cubic Interpolation method is used in estimation of survivor’s proportions from the parametric models.
Keywords: CABG Patients, Complete & Incomplete Populations, Modifiable Risk Factors, Parametric Survival Models (Weibull and Exponential), Maximum Likelihood Method, Davidon-Fletcher-Powell Optimization Method and Survivor’s Proportions
Article Outline
1. Introduction
- The Coronary Artery Disease (CAD) is due to accumulation of cholesterol and other material, called plaque, within inner walls of the coronary arteries (the arteries that supply blood with oxygen and nutrients to heart muscles). As this build-up grows (Arteriosclerosis), comparatively less blood can flow through the arteries. Over the time (which differs from individual to individual) heart weakens. This leads to chest pain (Angina) which is a symptom of Myocardial Infarction (MI). When the clot (thrombus) completely cuts off the hearts blood supply, this may leads to permanent heart damage, called as heart attack (MI). Heart failure means the heart cannot pump required blood to the rest of the body[10]. CAD is the leading cause of death worldwide (see William, Stephen, Van -Thomas and Robert)[36], John[18], Hansson[13], Axel, Yiwen, Dalit, Veena, Elaine, Catia, Matthew, Jonathan, Edward & Len[3] and Sun & Hoong[33] ). The symptoms and signs of coronary artery disease are noted in the advanced stage of the disease. Initially, most of the individuals with CAD show no evidence of disease, whereas the disease progresses before the first onset of symptoms and often there is a sudden heart attack. The CAD is the most common cause of sudden death of men and women over 20 years of age[30]. The medical scientists; William, Ellis, Josef, Ralph and Robert [36], Heymann[15], Goldstein, Adams, Alberts, Appel, Brass, Bushnell, Culebras, DeGraba, Gorelick & Guyton[11] and Jennifer[17] are of the opinion that CABG is an effective treatment option for CAD patients. The medical research organizations like Heart and Stroke Foundation Canada[14] and American Heart Association[2] have classified risk factors of CABG patients as modifiable and non-modifiable. Modifiable risk factors are those factors, which may be controlled by changing life style or taking medications to reduce cardiovascular risk. These risk factors include high blood pressure (hypertension), diabetes, smoking, high cholesterol, sedentary lifestyle and obesity. Non-modifiable risk factors are those factors, which may not be changed. These factors include age, gender and family history (Genetic predisposition). William, Ellis, Josef, Ralph and Robert[35] in 1995 carried out the survival study on incomplete population (progressive censoring of type 1) of CABG patients comprising 2011 patients using Kaplan Meier method[19]. The patients were grouped with respect to Male, Female, Age, Hypertension, Diabetes, and Ejection Fraction, Vessels, Congestive Heart Failure, Elective and Emergency Surgery. The patients were undergone through a first re-operation at Emory University hospitals from 1975 to 1993. This study also comprises the same data set of 2011 patients. The details of patients are given in the article[35]. In this paper we present survival analysis of the CABG patients with respect to some modifiable risk factors, Hypertension & Diabetes, in complete and incomplete Populations. Khan, Saleem and Mahmud in the article[21] proposed a procedure, to make an incomplete population (IP) a complete population (CP). The differences between the means of survival proportions of the CABG patients, obtained by using survival models (Weibull, Exponential etc) are statistically insignificant at 5% level of significance for details see the article[21].The importance of parametric models for analysis of lifetime date has been indicated by Mann, Schefer and Singpurwala[28], Nelson[29], Cyrus[8], Lawless[25], Klein & Moeschberger[22] and Sridhar and Mun Choon Chan[32]. The Exponential distribution model has been used by Lee, Kim and Jung[27] in medical research for survival data of patients. The Weibull distribution model has been used for survival analysis by Cohen[6], Gross and Clark[12], Bunday[5], Crow[7], Klein & Moeschberger[22], Lawrencce[26], Abrenthy[1], Hisada & Arizino[16], Lawless[25], David & Mitchel[9] and Lang[23]. In particular, the survival study of chronic diseases, such as AIDS and Cancer, has been carried out by Bain and Englehardt[4], Khan & Mahmud[20], Klein & Moeschberger[22], Lawless[25] and Swaminathan and Brenner[34] using Exponential and Weibull distributions. Lanju & William[24] used Weibull distribution to human survival data of patients with plasma cell and in response-adaptive randomization for survival trials respectively. Lee, Kim and Jung[27] used the exponential in medical research for survival data of the patients. Khan, Saleem and Mohmud[21] concluded that the survival data of the CABG patients has been best modeled by the Weibull and Exponential distributions. In this paper, the survivor proportions of the CABG patients are obtained for incomplete and complete populations of the CABG patients by parametric models (Weibull and Exponential), using data of CABG patients Hypertension and Diabetes. Maximum likelihood method, in-conjunction with DFP optimization method and Cubic Interpolation method is used. A subroutine for maximizing log-likelihood function of each model is developed in FORTRAN program to obtain the estimates of the parameters of the model. The survival proportions of IP and CP of the CABG patients with respect to modifiable risk factors are presented in term of statistics and graphs (survival curves), discussed and concluded.
2. Methodology
- Khan, Saleem and Mahmud mentioned that the method proposed by Kaplan Meier[19] and latter discussed by William[35] in 1995 and Lawless[25] is:
 , where
  and
and  are the number of items (individuals / patients) failed (died individuals) and number of individuals at risk at time
  , that is, the number of individuals survived and uncensored at time
  . This method does not take into account the censored individuals
  completely and thus the analysis is performed on incomplete population
 . Further, Khan, Saleem and Mahmud[21] proposed that the censored individuals
  could be taken into account. The inclusion of splitted-censored individuals,
  proportionally
  into known survived,
  and died individual’s
  respectively makes the population complete. Thus the survival analysis may be performed on the complete population
 also. Saleem, Mahmud and Khan[31] mentioned the form of likelihood function proposed by Klein & Moeschberger[22] and Lawless[25], for a survival model, in the presence of censored data. The maximum likelihood method works by developing a likelihood function based on the available data and finding the estimates of parameters of a probability distribution that maximizes the likelihood function. This may be achieved by using iterative method: see Bunday & Al-Mutwali[5] and Khan & Mahmud[20] The likelihood function for all observed died and censored individuals is of the form:
  , where
  &
&  are the number of died & censored individuals in interval i each of length t,
  is pdf in a parametric model with survivor function,
  & hazard function,
  and
and  is vector of parameters say
 of the model . To obtain maximum likelihood estimates of parameters of a parametric model using DFP optimization method, we take negative log on both the sides of above equation and therefore by setting
 , we get:
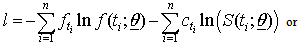

 Where, the first sum is for failure and the second sum is for all censored individuals.Setting
 , where
  represents total no of individuals at time
  we get:
 | (1) |
 For complete population the term for censored observations is dropped from the likelihood function.
 3. Application
- Khan, Saleem and Mahmud[21] presented detail application of above methodology for parametric model (Weibull distribution). Same procedure is followed for second parametric model (Exponential distribution with β =1) considered in this article. The methodology is reproduced here. The probability density function (pdf) of Weibull distribution is:
 ,where
  is vector of parameters α and β ; α is a scale parameter and β is a shape parameter; α ,β and t > 0. The survival and hazard functions of Weibull distribution are:
 For incomplete population replacing values of the survival and hazard functions of Weibull distribution in equation (1), we get
  or
or | , (2) |
 is the total number of failures in a given time.Differentiating (2) with respect to
  and simplifying we get
 | (3) |
 | (4) |
 respectively) of Weibull and Exponential distributions distribution using CP of groups: Hypertension (Absent & Present), Diabetes (Absent & Present) are obtained by maximizing the log-likelihood function. The t-ratios of the parameters are given in parenthesis. The values of parameters estimates, t-ratios, log-likelihood function and variance–covariance matrix are given below: -
4. Weibull and Exponential Distributions using Data of Modifiable Risk Factors
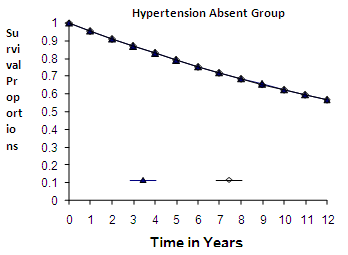
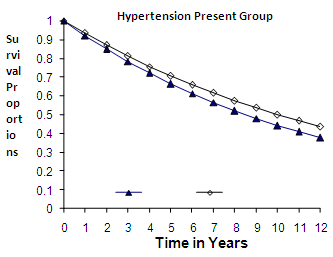
4.1. Hypertension Absent (HYa) and Present (HYp) Groups (Male and Female CABG Patients)
- The survival proportions
 and
and  of CP and IP respectively of
  and
and  groups of CABG patients are obtained using Weibull and exponential distributions as explained earlier. The optimal estimates of parameters obtained by maximizing the log-likelihood function are given below in tables 1 and 2.The estimated values of scale parameter α > 0 and shape parameter
  > 0 for CP and IP of
  and
and  groups of CABG patients are given in the tables 1 and 2 along with t-ratios in the parenthesis, indicating that the estimates of scale and shape parameters are significant at 5% level of significance. In case of weibull distribution the estimated value of
  is greater than 1 (for CP and IP of the
  and
and  groups) which indicates increasing failure rate with time. The negative values of co-variances (for CP and IP of
  and
and  groups of CABG patients) indicates that the movements of
  and
and  are in the opposite directions.
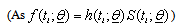
 | Figure 1. Weibull Distribution |
 | Figure 2. Weibull Distribution |
 | Figure 3. Exponential Distribution |
 | Figure 4. Exponential Distribution |
 and
and  groups of CABG patients are given in table 3- and corresponding graphs (survival curves) in fig 1 to 4.
|

|
 and
and  Groups of CABG Patients
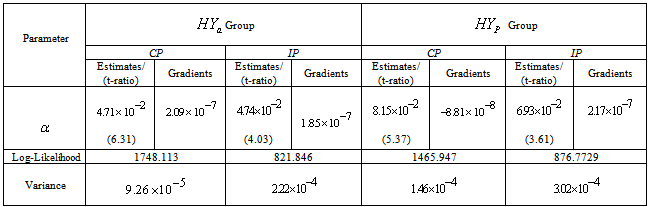
|
 and
and  of CP and IP respectively of Hypertension Absent (
 ) and Present (
 ) Groups of CABG Patients from Weibull and Exponential Distributions
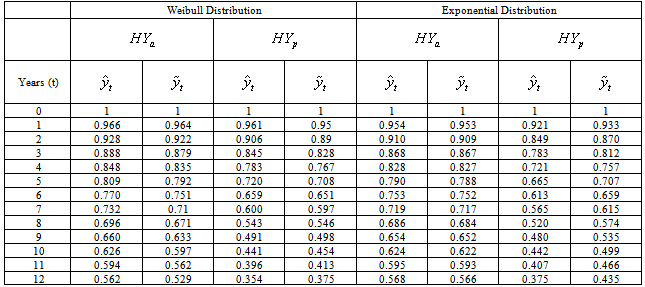
4.1.1. Discussion
- The graphs in fig 1& 2 of survival proportions obtained by using Weibull distribution of CP and IP for
 and
and  groups of CABG patients shows that for
 group, the difference between the survival proportions of CP and IP is small at the start, continuously but slowly increasing, whereas the survival proportions of IP are lower than those of CP and for
  group, the survival proportion of IP are slightly lower at the start, almost equal from 6th to 9th year values and slightly higher at the end then those of CP .The graphs in fig 3& 4 of survival proportions obtained by using exponential distribution of CP and IP for
  and
and  groups of CABG patients shows that when there is no hypertension, the difference is almost ignorable and when
  , the difference between the survival proportions of CP and IP is continuously but slowly increasing, whereas the survival proportions of CP are lower than those of IP. The differences between the means
  and
and  of survival proportions obtained by using Weibull and exponential distributions respectively of CP and IP respectively, for
  and
and  groups of CABG patients are tested using t-statistic under the null hypothesis
  :
: , against an alternative hypothesis
  :
: . The values of t-statistic of
  and
and  groups are -0.344 & -0.023 and 0.031& 0.622 (by weibull and exponential distributions respectively) when compared with
  , suggest that
  is accepted which means that the differences between the means of CP and IP of
  and
and  groups of CABG patients, are statistically insignificant at 5% level of significance.
 4.1.2. Conclusion 1
- The differences between the means of survival proportions (obtained by using Weibull and exponential distributions) of CP and IP of
 and
and  groups of CABG patients are statistically insignificant at 5% level of significance. This implies validity of using our new approach of formulation of complete population. Moreover, survival proportions of
  are lower than those of
  , as observed by world over medical scientists.
 4.2. Diabetes Absent ( ) and Present (
 ) Groups (Male and Female CABG Patients)
- The survival proportions
 and
and  of CP and IP respectively of
  and
and  groups of CABG patients are obtained using Weibull Weibull and exponential distributions as explained earlier. The optimal estimates of parameters obtained by maximizing the log-likelihood function are given below in tables 4 and 5.The estimated values of scale parameter α > 0 and shape parameter
  > 0 for CP and IP of
  and
and  groups of CABG patients are given in the tables 4 & 5 along with t-ratios in the parenthesis, indicating that the estimates of scale and shape parameters are significant at 5% level of significance. In case of Weibull Distribution the estimated value of
  is greater than 1 (for CP and IP of the
  and
and  groups) which indicates increasing failure rate with time. The negative values of co-variances (for CP and IP of
  and
and  groups of CABG patients) indicates that the movements of
  and
and  are in the opposite directions.
|
 and
and  Groups of CABG Patients
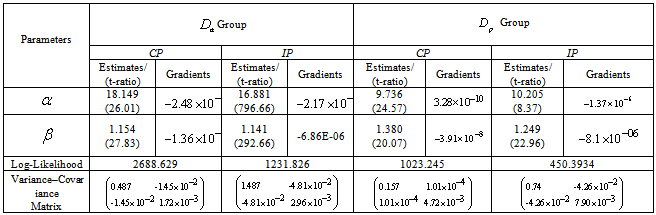
|
 and
and  Groups of CABG Patients
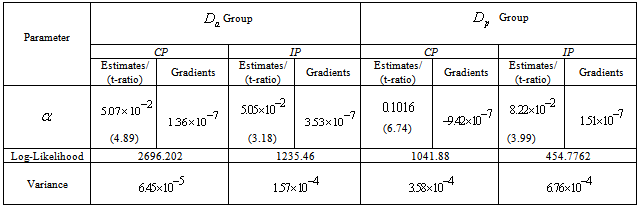
 and
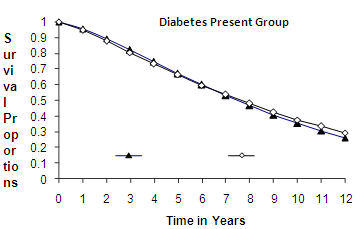
and  groups of CABG patients are given in table 6 and corresponding graphs (survival curves) in fig 5 to 8.
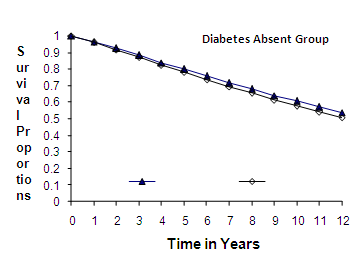 | Figure 5. Weibull Distribution |
 | Figure 6. Weibull Distribution |
 | Figure 7. Exponential Distribution |
 | Figure 8. Exponential Distribution |
|
 and
and  of CP and IP respectively of Diabetes Absent (
 ) and Present (
 ) Groups of CABG Patients from Weibull and
4.2.1. Exponential Distributions
- Discussion The graphs in fig 5& 6 of survival proportions obtained by using Weibull distribution of CP and IP for
 and
and  groups of CABG patients shows that for
 group, the difference between the survival proportions of CP and IP is small at the start, continuously but slowly increasing, whereas most of the survival proportions of IP are lower than those of CP and for
  group, the survival proportions of IP are slightly lower at the start, almost equal from 6th to 7th year values and slightly higher at the end than those of CP.The graphs in fig 7& 8 of survival proportions obtained by using exponential distribution of CP and IP, for
  and
and  groups of CABG patients shows that when there is no diabetes, the difference is almost ignorable and when
 , the difference between the survival proportions of CP and IP is continuously but slowly increasing, whereas the survival proportions of CP are lower than those of IP. The differences between the means
  and
and  of survival proportions (obtained by using Weibull and distributions respectively) of CP and IP respectively of
  and
and  groups of CABG patients, are tested using t-statistic under the null hypothesis
 :
: , against an alternative hypothesis
  :
: . The values of t-statistic of
  and
and  groups are -0.329 & -0.050 and 0.012 & 0.786 (by weibull and exponential distributions respectively) when compared with
  , suggest that
  is accepted which means that the differences between the means of CP and IP of CABG patients groups of
  and
and  , are statistically insignificant at 5% level of significance.
 4.2.2. Conclusion 2
- The differences between the means of survival proportions (obtained by using Weibull and exponential distributions) of CP and IP of
 and
and  groups of CABG patients are statistically insignificant at 5% level of significance. This implies validity of our new approach of complete population. Moreover, survival proportions of
  are lower than those of
  , as observed by all medical scientists.
5. Final Conclusions
- Summing up the conclusions 1 and 2, finally, as a whole the differences between the means of survival proportions (obtained by using Weibull distribution and exponential distributions) of CP and IP of CABG patients groups (hypertension and diabetes) are statistically insignificant at 5%level of significance. This implies complete population from its incomplete population as proposed in our article[21] may be used for better medical investigations. The survival proportions of and
 are lower than those of
  and
and  respectively, whereas survival proportions of
  are comparatively lowest, as observed by world over medical scientists. Thus, the CABG patient’s data has been adequately modeled by both distributions (Weibull and exponential). Moreover, forecasting of the survival proportions of the CABG patients is also possible by Bayesian analysis (Kalman Filter approach) as advocated by Meinhold and Singpurwalla in 1983 in an American journal.