Kulwinder Singh Parmar , Rashmi Bhardwaj
Department of Mathematics, University School of Basic and Applied Sciences, Guru Gobind Singh Indraprastha University, Dwarka, Delhi,110075, India
Correspondence to: Rashmi Bhardwaj , Department of Mathematics, University School of Basic and Applied Sciences, Guru Gobind Singh Indraprastha University, Dwarka, Delhi,110075, India.
| Email: |  |
Copyright © 2012 Scientific & Academic Publishing. All Rights Reserved.
Abstract
Statistical analysis of the water quality parameters COD (Chemical Oxygen Demand), BOD (Biochemical Oxygen Demand), DO (Dissolved Oxygen), WT (Water Temperature), AMM (Free Ammonia), TKN (Total Kjeldahl Nitrogen), TC (Total Coliform), FC (Fecal Coliform) and pH (Potential of Hydrogen) monitored at Hathni Kund Dam (Haryana) Yamuna River in India have been studied. It has been observed that water quality parameter have positive correlation between COD-BOD; AMM-TKN; WT-pH; TC-FC; and negatively correlation between COD-DO; BOD-DO; TKN-FC; DO-WT. Discrete wavelet analyses of water quality parameter using Daubechies wavelet at level 5 have been calculated. It has been observed that the values of signal data at five different levels for AMM, BOD, COD, DO, FC, pH, TC, TKN, WT varies between -1 to 1, -2 to 2, -20 to 20, -2 to 2, -5 to 5, -1 to 1, -2 to 2, -5 to 5, -10 to 10 respectively.
Keywords:
Wavelet Analysis, Water Pollutant, Statistical Analysis, Daubechies Wavelet
1. Introduction
Water is the basic requirement for life on earth. Many human activities pollute the river water. Urbanization, industrialization and globalization increased pollution level in river water. Yu, B. et al. (2010) [9] discussed the unsteady evolution of NH3-N in the upper and middle reaches of Minjiang River through multi-scale analysis. Zainuddin, Z. and Pauline, O. (2011) [10] described the predictive capability of Wavelet Neural Networks (WNNs). He, Li et al. (2008) [5] studied wavelet-based multiresolution analysis technique (WMAT) for reducing noises induced by complex uncertainty. Hanbaya, D. et al. (2010) [4] studied switch circuits model based on wavelet decomposition and neural network. Kumar N. and Sinha D.K. (2010) [6] studied statistical regression analysis of underground drinking water. Vassilis Z. et al. (2001) [8] studied the time series analysis using statistical methods for monthly values of water quality parameters and the discharge. Can, Z. et al. (2005) [2] analyzed the characteristics of gravity waves (GWs) and seasonal variations of atmospheric waves over Istanbul using wavelet techniques. Zhang et al. (2008) [11] explained complex system dynamic (SD) model for water resources. Clonda, D. et al (2004) [3] discussed symmetric solution using complex Daubechies wavelets. Bhardwaj et al. (2011) [1] calculated water quality index (WQI) for 16 water quality parameters including 6 cations, 5 anions beside Dissolved Oxide (DO), Biochemical Oxygen Demand (BOD), Total Dissolved Solids (TDS), Potential of Hydrogen (pH) and conductivity at the Hathni Kund Dam (Haryana, India). This paper deals with Statistical and Wavelet Analysis using Daubechies Wavelet at level 5 (Db 5) of water quality parameters.
2. Statistical Analysis of Water Quality Parameters
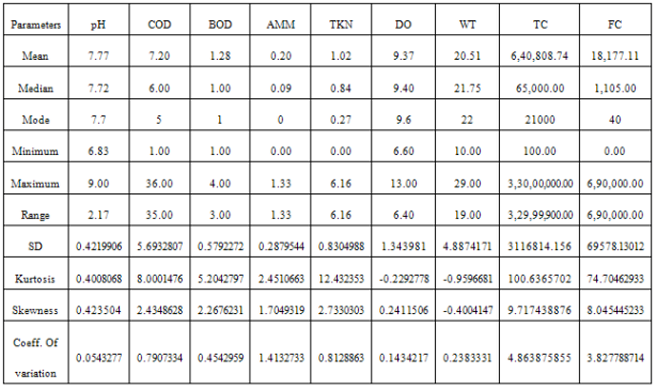
The monthly average values of last 10 years of water quality parameters COD (Chemical Oxygen Demand), BOD (Biochemical Oxygen Demand), DO (Dissolved Oxygen), WT (Water Temperature), AMM (Free Ammonia), TKN (Total Kjeldahl Nitrogen), TC (Total Coliform), FC (Fecal Coliform) and pH (Potential of Hydrogen) observed by Central Pollution Control Board (CPCB) at Hathni Kund Dam (Haryana) of Yamuna river (India) have been considered for study. In Statistical analysis mean, median, mode, minimum, maximum, range, standard deviation, kurtosis, skewness and coefficient of variation have been studied. Skewness gives the symmetry of data and coefficient of variation discribes the relative measure of sample. Kurtosis (k) refers the degree of flatness or peakedness and it also indicates impulsiveness of the signal. It defined as 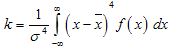 | (1) |
where f(x) probability density function of the instaneous amplitude x(t) at time t.  is a mean value and σis the standard deviation of x(t).The statistical analysis of each water quality parameters pH, COD, BOD, AMM, TKN, DO, WT, TC and FC have been discussed below as given in Table 1.pH: Average, positional average and mode value of pH is 7.77, 7.72 and 7.7. These values are close to 7.7 thus data exhibits normal behavior. Standard deviation (SD) is 0.422, skewness approximates to 0 thus pH is symmetrical and values are very close to each other. Curve is platykurtic as Kurtosis is less than 3. COD: Mean, median and mode value is 7.2, 6.0 and 5.0 respectively thus curve is not normal. Standard deviation value is high (5.6932807) thus values of COD are not close to each other. It is skewed (2.435) and curve is leptokurtic because Kurtosis is more than 3.BOD: Mean and median value is approximately equal but mode value is different so curve is not normal. Standard deviation value suggests that data is spread out and curve is leptokurtic.AMM: Average, median and mode value is approximately equal thus data exhibits normal behavior. Standard deviation (0.2879) suggests that data is close to each other. Curve is platykurtic.TKN: Mean and median value is approximately equal. Standard deviation (0.83) suggests that sample data is close to each other. Skewness value is approximately 0 thus curve is symmetrical and platykurtic.DO: Average, median and mode value is equal thus data behaves normally. Standard deviation value is 1.344 curve is symmetric and platykurtic.WT: Mean, median and mode value is approximates to 21 thus data exhibits normal characteristic. Curve is skewed and platykurtic.TC: Average, median and mode value is different. Standard deviation value explains that sample data is spread. Curve is leptokurtic.FC: Average, median and mode value is different. Standard deviation value explains that sample data is spread. Curve is leptokurtic. Curve is neither symmetrical nor skewed.
3. Correlation Coefficient between Water Quality Parameter
The correlation coefficient is defined as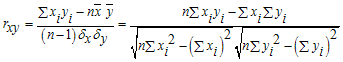 | (2) |
where  and
and  are the sample means of X and Y, and
  and
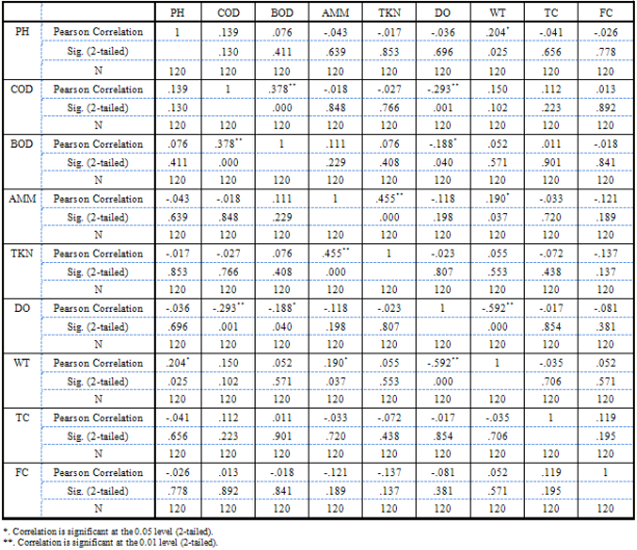
and  are the sample standard deviations of X and Y. Table-2, gives the value of correlation coefficient between pairs of water quality parameters. It has been observed that COD is positively correlated with BOD and negatively correlated with DO. Positive correlation means persistent behavior with the variables. BOD is negatively correlated with DO. AMM is positively correlated with TKN. TKN is negatively correlated with TC. DO is negatively correlated with WT.WT is positively correlated with pH and TC is positive correlated with FC. Figure 1, plots the graphical representation of correlation coefficient of water quality parameters with other parameters.
Table 1. Statistical Analysis of Yamuna River at Hathni Kund Dam
 |
| |
|
Table 2. Correlation between water quality parameters at Hathni Kund (Haryana) Correlations
 |
| |
|
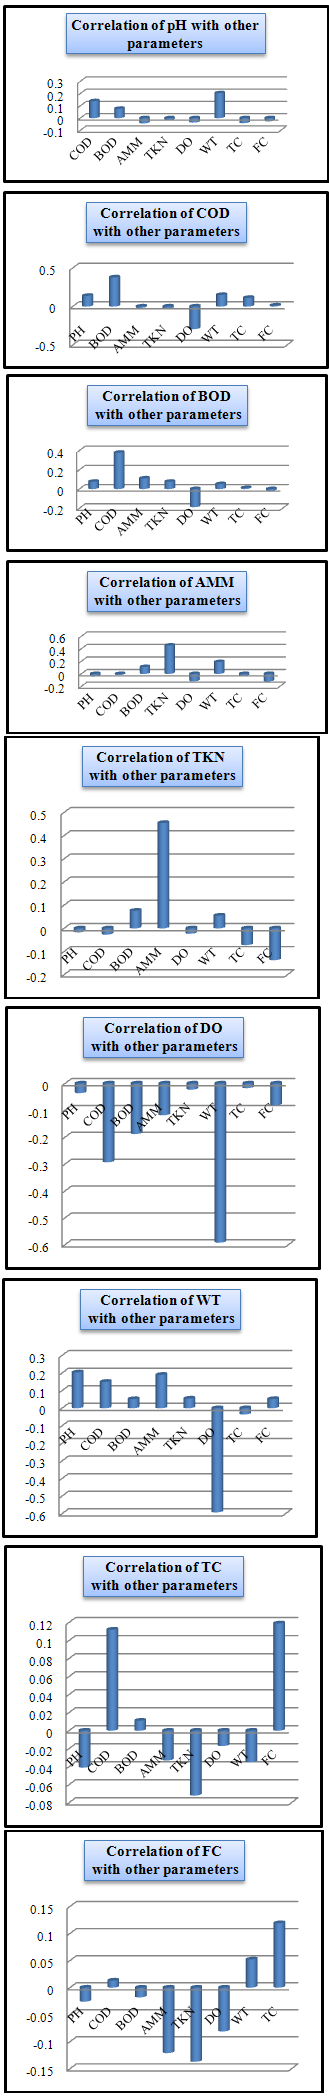 | Figure 1. Pearson correlation coefficient of (a) pH (b) COD (c) BOD (d) AMM (e) TKN (f) DO (g) WT (h) TC and (i) FC with other parameters. |
4. Discrete Wavelet Analysis of Water Quality Parameters
A wavelet is a function  which satisfies the condition
 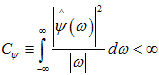 | (3) |
where  is the Fourier transform of
  It may be observed that the wavelet transform is a prism which exhibits properties of signal such as points of abrupt changes, seasonality or periodicity. The wavelet transform is a function of ‘a’ and ‘b’ wherea = the scale of frequencyb = spatial position (translation) or timeThe plane defined by the variables (a, b) is called the scale-space or time frequency plane. A continuous representation of a function of two continuous parameters a, b can be converted into a discrete one by assuming that a and b take only integral values.
  | (4) |
 is called the Wavelet Transform of f(t) and
 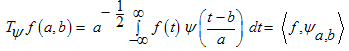 = inner product or dot product of
  If
If  then
then  for all a, b.
 | (5) |
The Fourier transform is given by  | (6) |
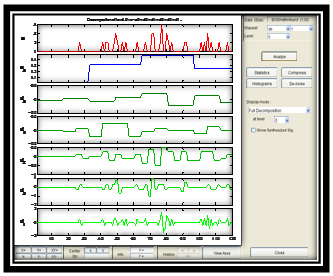
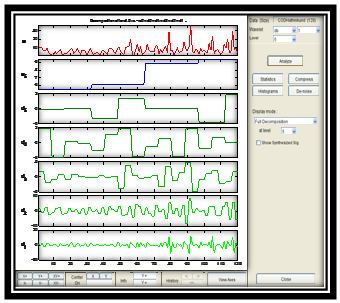
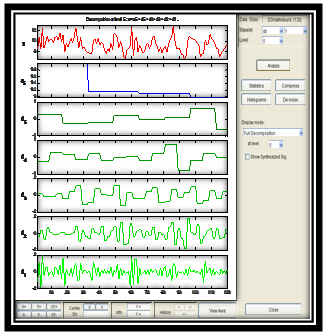
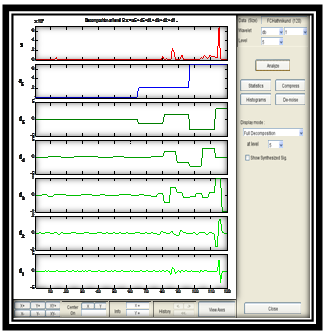
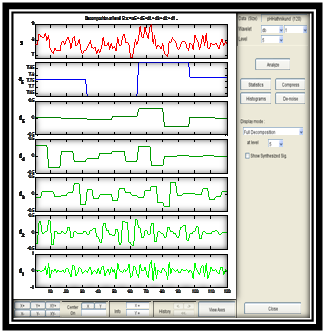
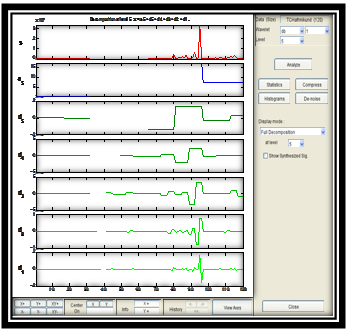
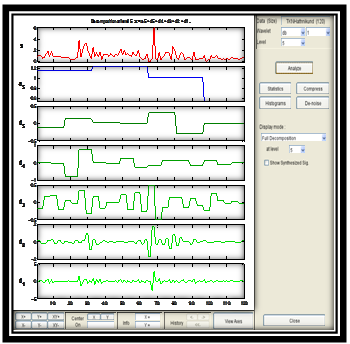
One dimensional discrete wavelet analysis of monthly average value for last ten years of water quality parameter such as pH, BOD, COD, DO, AMM, TKN, WT, TC and FC for Yamuna river at Hathni Kund Dam, Haryana using ten years values. Daubechies wavelet at level 5 (Db 5) contains seven parts s, a5, d1, d2, d3, d4 and d5. The first part ‘s’ represents the signal or raw data and the second part ‘a5’ corresponds to the amplitude of the signal. The last parts d1, d2, d3, d4 and d5 represents details of the signal or raw data at five different levels. 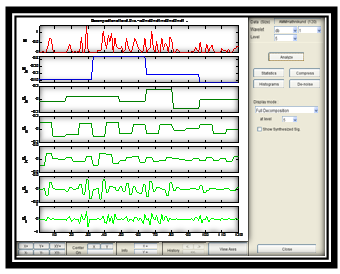 | Figure 2a. 1D Discrete wavelet for AMM |
 | Figure 2b. 1D Discrete wavelet for BOD |
 | Figure 2c. 1D Discrete wavelet for COD |
 | Figure 2d. 1D Discrete wavelet for DO |
 | Figure 2e. 1D Discrete wavelet for FC |
 | Figure 2f. 1D Discrete wavelet for pH |
 | Figure 2g. 1D Discrete wavelet for TC |
 | Figure 2h. 1D Discrete wavelet for TKN |
 | Figure 2i. 1D Discrete wavelet for WT |
Figure 2, gives the details of 1D Daubechies Wavelet analysis at level 5 (Db 5) for each water quality parameter. It has been observed that:AMM: The first part of the figure 2(a) shows that maximum value of AMM is 1.33 and the corresponding amplitude (a5) varies from 0.15 to 0.35. The values of d5, d4, d3, d2 and d1 vary from-0.2 to 0.2, -0.2 to 0.2, -0.5 to 0.5, -0.5 to 0.5 and -1 to 1 respectively.BOD: Figure 2(b) explains the BOD parameter’s signal and maximum value is 4 and amplitude (a5) of this signal varies from 1.0 to 1.5. The other values of d5, d4, d3, d2 and d1 varies from -0.5 to 0.5, -0.5 to 0.5, -1 to 0.5, -2 to 1 and -2 to 2 respectively.COD: Figure 2(c) explains the COD parameter’s signal and maximum value is 36 and amplitude (a5) varies from 5.5 to 9.5. The other values of d5, d4, d3, d2 and d1 varies from -2 to 2, -2 to 2, -5 to 5, -10 to 10 and -20 to 20 respectively.DO: Figure 2(d) describes the DO parameter’s signal and maximum value is 13 and amplitude (a5) varies from 9.0 to 9.9. The other values of d5, d4, d3, d2 and d1 vary from -1 to 1, -1 to 1, -2 to 2, -2 to 2 and -2 to 2 respectively.FC: Figure 2(e) explains the FC parameter’s signal and maximum value is and amplitude (a5) varies from 0 to 7. The other values of d5, d4, d3, d2 and d1 vary from -5 to 5, -5 to 5, -1 to 1, -2 to 2 and -5 to 5 respectively.pH: Figure 2(f) depicts the pH parameter’s signal and maximum value is 9 and amplitude (a5) varies from 7.64 to 7.85. The other values of d5, d4, d3, d2 and d1 varies from -0.5 to 0.5, -0.5 to 0.5, -0.5 to 0.5, -0.5 to 0.5 and -1 to 1 respectively.TC: First part of the Figure 2(g) explains the TC parameter’s signal and maximum value as and amplitude (a5) varies from 0 to 17. The other values of d5, d4, d3, d2 and d1 vary from -2 to 2, -5 to 5, -5 to 5, -1 to 1 and -2 to 2 respectively.TKN: Figure 2(h) explains the TKN parameter’s signal and gives maximum value is 6.16 and amplitude (a5) varies from 0.6 to 1.2. The other values of d5, d4, d3, d2 and d1 varies from -0.5 to 0.5, -1 to 1, -0.5 to 0.5, -2 to 2 and -5 to 5 respectively.WT: Figure 2(i) explains the WT parameter’s signal and maximum value is 29 and amplitude (a5) varies from 20.4 to 21.1. The other values of d5, d4, d3, d2 and d1 vary from -2 to 2, -5 to 5, -5 to 5, -10 to 10 and -10 to 10 respectively.
5. Conclusions
Statistical and wavelet analysis of water quality parameters monitored at the Hathni Kund Dam (Haryana) of Yamuna River (India) have been discussed. It has been observed that curve is platykurtic for pH, AMM, TKN, DO, WT; leptokurtic for COD, BOD, TC, FC and normal for pH, AMM, DO, WT. There is positive correlation between COD–BOD, AMM–TKN, WT–pH, TC–FC and negative correlation between COD–DO, BOD-DO, TKN–FC, DO–WT. 1-D Discrete Daubechies Wavelet analysis explains that the parameters AMM, BOD, COD, DO, FC, pH, TC, TKN and WT have the maximum value 1.33, 4.0, 36, 13, , 9.0, ,6.16 and 35 and amplitude (a5) varies between 0.15 to 0.35, 1.0 to 1.5, 5.5 to 9.5, 9.0 to 9.9, 0 to 7, 7.64 to 7.85, 0 to 17, 0.6 to 1.2 and 20.4 to 21.1 respectively. The values of d5, d4, d3, d2 and d1 ranges between -1 to 1 for AMM, pH; -2 to 2 for BOD, DO, TC; -5 to 5 for FC, TKN; -10 to 10 for WT and -20 to 20 for COD. It has been concluded that water quality parameters cross the prescribed limit of WHO/EPA.
ACKNOWLEDGEMENTS
Authors are thankful to Guru Gobind Singh Indraprastha University for providing research facilities and financial support. Authors also thankful to Central Pollution Control Board (CPCB) for providing data for research work.
References
| [1] | Bhardwaj, R., Parmar, K.S., Chuhg, P., Minhas, P.and Sahota, H.S. (2011) “Seasonal variation of physico- chemical parameters and water quality indexing of Harike Lake” Indian j.Env.Prot, 31(6), 482-486. |
| [2] | Can, Z.; Aslan, Z., Oguz, O. and Siddiqi, A.H. (2005) “Wavelet Transform of Metrological Parameter and Gravity Waves” Annales Geophysicae , 23, 659-663. |
| [3] | Clonda, D., Lina, J. and Goulard, B. (2004) “Complex Daubechies wavelets: properties And statistical image modeling” Signal Processing, 84 (1), 1-23. |
| [4] | Hanbaya, D., Turkoglua, I., and Demirb, Y. (2010) “Modeling switched circuits based on wavelet decomposition and neural networks” Journal of the Franklin Institute, 347(3), 607-617. |
| [5] | He, L., Huang, G., Zeng, G. and Lu, H. (2008) “Wavelet-based multiresolution analysis for data cleaning and its application to water quality management systems” Expert Systems with Applications, 35 (3), 1301-1310. |
| [6] | Kumar, N. and Sinha, D.K. (2010) “Drinking water quality management through Correlation studies among various physico- chemical parameters: A case study” I.J.Env.Sci, 1(2), 253-259. |
| [7] | Shukla, J.B., Misra, A.K. and Chandra, P. (2008) “Mathematical Modeling and analysis of the dissolved oxygen in eutrophied water bodies affected by organic pollutant” Nonlinear Analysis: Real world Applications, 9, 1851-1865. |
| [8] | Vassilis, Z., Papamichail, D.M. and Mitsiou (2001) “Statistical and trend analysis of water quality and quantity data for the Strymon River in Greece” Hydrology and Earth System Sciences, 5(4), 679-691. |
| [9] | Yu, B., Huang, C.M., Liu, Z., Zhang, B. and Qin, F. (2010) “Wavelet Analysis on NH3- N Pollution Index Changes of the Middle-Upper Minjiang River “during Last 6 Years” International Society for Environmental Information Sciences 2010 Annual Conference (ISEIS) Procedia Environmental Sciences, 2, 9-14. |
| [10] | Zainuddin, Z. and Pauline, O. (2011) “Modified wavelet neural network in function approximation and its application in prediction of time-series pollution data” Applied Soft Computing, 11 (8), 4866–4874. |
| [11] | Zhang, X.H., Zhang, H.W., Chen, B. and Zhao, X.H (2008) “Water resources planning based on complex system dynamics: A case study of Tianjin city” Commun. Nonlinear Sci. Numer. Simul., 13(10), 2328-2336. |
 Abstract
 Reference
 Full-Text PDF
 Full-Text HTML