-
Paper Information
- Previous Paper
- Paper Submission
-
Journal Information
- About This Journal
- Editorial Board
- Current Issue
- Archive
- Author Guidelines
- Contact Us
American Journal of Mathematics and Statistics
p-ISSN: 2162-948X e-ISSN: 2162-8475
2012; 2(1): 16-19
doi:10.5923/j.ajms.20120201.04
Male Stable Population Tends to be Identical: Evidence from Population Censuses
Md. Rafiqul Islam
Dept. of Population Science and Human Resource Development, University of Rajshahi, Rajshahi, 6205, Bangladesh
Correspondence to: Md. Rafiqul Islam, Dept. of Population Science and Human Resource Development, University of Rajshahi, Rajshahi, 6205, Bangladesh.
| Email: |  |
Copyright © 2012 Scientific & Academic Publishing. All Rights Reserved.
To investigate the stability situation of population for male of Bangladesh, total males of 1961, 1974, 1981, 1991 and latest 2001 censuses, intercensal growth rates, age specific fertility rates (ASFRs) and stationary population for male at the middle points of various intercensal periods have been used to estimate the intrinsic growth rates, birth rates, death rates and stable population. The estimated intrinsic birth rates and death rates give an idea about the nature of population transition. The male stable population estimated at the mean points of various intercensal periods shows more or less identical age structure. These results lead to the decision of identical male stable population in spite of changing fertility and mortality situations in .
Keywords: Male Stable Population, Intercensual Growth Rate, Age Specific Fertility Rates (ASFRs), Linear Interpolation Technique, Lotka’s Integral Equation
Cite this paper: Md. Rafiqul Islam, Male Stable Population Tends to be Identical: Evidence from Population Censuses, American Journal of Mathematics and Statistics, Vol. 2 No. 1, 2012, pp. 16-19. doi: 10.5923/j.ajms.20120201.04.
Article Outline
1. Introduction
- The population of has been experiencing high level of fertility and mortality providing of high intensity of growth rate during the time period 1951-1981. After 1981, these two vital rates have been showing evidence of declining trend despite of high level of mortality and fertility. Nevertheless, it can be said that the fertility and mortality levels have been altering during the last five decades. But, the question is to be now arisen that whether the stable population corresponding to various intercensual growth rates exhibit the above change or not? For that reason, an effort has been concentrated to look into the above question in the case of population for male of . Islam and Ali (2004) observed that the estimated stable population for female at the mid points of different intercensual periods did not show the changing situation of mortality and fertility could affect the age structure of corresponding stable population for female. Rather, the estimated female stable population for various situations almost all coincides with each other. They also showed from the observation that whatever may be the fertility and mortality situation of female population, their corresponding stable population associated with age is identical.Therefore, the fundamental aims and objectives of the present study are addressed in the following:i) to compute the intrinsic birth rates, death rates and growth rates for male and then, to construct male stable population at the mid points of intercensual periods, andii) to lesson the changing situation for male stable population associated with age in .This paper is structured as follows. The sources of data are presented in section 2. Section 3 describes the methodology. Results and discussion of this paper are reported in section 4. Finally section 5 concludes the conclusion of the manuscript.
2. Sources of Data
- In order to fulfill the aforementioned objectives, the information of data, that is, the total male population of 1961 (Government of Pakistan 1964), 1974 (BBS 1977), 1981 (BBS 1984), 1991 (BBS 1994) and 2001(BBS 2003) censuses of have been taken and that are used in the present study.
3. Methodology
- To estimate the intrinsic intercensual growth rates for male stable population during 1961 to 1974, 1974 to 1981, 1981 to 1991 and 1991 to 2001, Lotka’s (1907) integral equation have been used and it is given by
 Where, p(x) is the probability of surviving from birth to age x, f(x) is the number of live birth per annum for each woman to age x and r is the intrinsic rate of increase per head per annum. It should be noted here that a theorem states that this integral equation has infinite complex roots with conjugates and only one dominant real root.A very close approximation of this real root of the above integral equation is obtained by using the following formula
 where,
  It is noted that is known as the ith moment of the net maternity function.The intrinsic birth rates corresponding to the above male stable population has been enumerated using the following integral equation
  (Keyfitz 1968)where b represents intrinsic birth rate per head per annum. Thus assuming the closed population under migration the male intrinsic death rate ‘d’ per head per annum has been estimated using the formula d = b - r. The stable male population has been estimated at the middle points of various intercensual periods using the above intrinsic growth rates, the life table stationary population for male and age specific fertility schedules. At this juncture, it is to be mentioned that to choose life table stationary population for male for different intercensual periods, the life expectancy at birth , that is,e0 values have been taken from Statistical Year Book of 1980, 1982, 1999. South Asian Model Life Tables from United Nations Model Life Tables for Developing Countries is selected to obtain male stationary population (UN 1982) by employing linear interpolation technique (UN 1983) on corresponding life expectancy at birth (e0). ASFRs have been taken from fertility Survey (BFS, 1975 and 1989) and Statistical Year Book of 1980 (BBS 1981), 1982 (BBS 1982), 1999 (BBS 2001).
 4. Results and Discussion
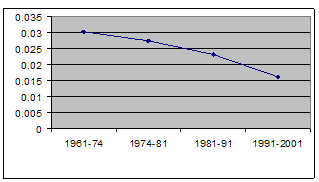
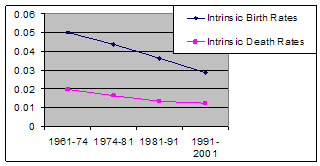
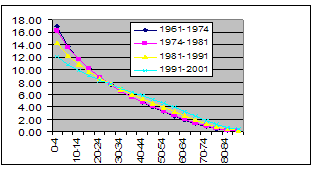
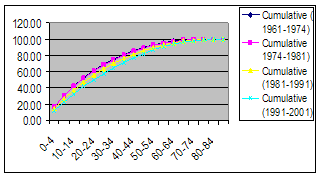
- The population of is increasing more rapidly due to faster birth rates than death rates. The authority of has been trying heart and soul to reduce mortality as well as fertility as desired level. The compound forces provide us an idea about the speedy or accelerated growth rate. But, these rates are also going to cut back with passing of time.In Misra (1995), there is a scope of constructing a stable population corresponding to the intercensal growth rate between two censuses. As the fertility and mortality situation is changing with respect to time, the age structure of population could be affected and its impact could be shown on the stable population. That is why, it is said that the stable population should put on display some sort of differential age structure for fertility and / or mortality change (Misra 1995).Keeping these above points in mind, an endeavor has been made concentration to construct four different male stable populations at the mid points of the following intercensal periods 1961-74, 1974-81, 1981-91 and 1991-2001. Before constructing male stable population, the intrinsic growth rates, birth rates and death rates for these aforementioned periods have been estimated to observe the changing circumstances of fertility and mortality. These rates are revealed in Table 1 in which these are indicated that both the intrinsic birth rates and death rates are showing declining trend during the study period of 1961-2001. It is also found from Figure 1 that the intrinsic growth rates are also displaying decreasing curve over the study time period.To observe the population transition for male the intrinsic birth rates and death rates of Table 1 are plotted in graph paper that is shown in Figure 2. It is indicated that the male population of is passing through a stage of population transition, where both fertility and mortality are decreasing but the intensity of the rate of decrement for fertility is higher than that of mortality for the duration of the time period 1961-2001. It is also observed that male death rates have already been stable position, that is, more or less constant form during 1981-1991 to 1991-2001 in spite of fertility is sharply declined.Using the intercensal male growth rate and life table (male) stationary population (UN 1982) the male stable population for four intercensal periods 1961-74, 1974-81, 1981-91 and 1991-2001 have been constructed and those are shown in Table 2. Observing the columns 2, 4, 6 and 8 of Table 2, it is found that each of all the estimated age structure of the male stable population decline smoothly downward. To compare the changes in age structure for four different intercensal periods these are plotted in graph paper displayed in Figure 3. The curves for the male stable age structures exhibit that almost all the curves coincide with each other with slight variations in some ages. From the Table 2 and Figure 3 it is investigated that these curves cross each other at age group 25-29. It is also observed that stable age structure of the duration 1961-1974, 1974-1981, 1981-1991 and 1991-2001 are decreasing in the early ages, that is, the age group 0-25 years at each ages over time. But the rate of decrement of 1981-1991 and 1991-2001 faster compared to the corresponding ages for the periods of 1961-1974 and 1974-1981. But in the remaining age groups, that is, the age groups 30 to 85 and above these age structures are increasing due to at every ages with passing of time. But, the rate of increment of age structures of 1981-1991 and 1991-2001 faster than that of the two previous periods of 1961-1974 and 1974-1981. It may be concluded from this discussion that older male population are gradually increasing over passing of time. As a consequence, the aged population might be more burdened in the society in future than that of the present situation in . So, Government of Bangladesh should just now take special attention for the welfare of the aged population how to provide this sufficient food, medical facility, recreation and other social security and social advantages. It should be mentioned here that Misra (1995) reported that these variations may be due to data error and these distortions can be removed by using the cumulative age distribution. For this, the cumulative male stable populations which are placed in graph paper that is shown in Figure 4. This figure exhibits more smooth curves of male stable population of and is supported by (Misra 1995). Thus, it can be said that all the stable age structures are approximately identical, although the mortality and fertility situation is varying as well as decreasing over time during the study period 1961-2001.
| ||||||||||||||||||||||||||||||||||||||||||||||||||||||||||||||||||||||||||||||||||||||||||||||||||||||||||||||||||||||||||||||||||||||||||||||||||||||||||||||||||||||||||||||||||||||
 | Figure 1. Intrinsic Growth Rates for Male Population of During 1961-74, 1974-81, 1981-91 and 1991-2001. X: Intercensual Period and Y: Growth Rates |
 | Figure 2. Intrinsic Birth Rates and Death Rates for Male Population of During 1961-74, 1974-81, 1981-91 and 1991-2001. X: Intercensal Period and Y: Rates |
 | Figure 3. Estimated Male Stable Population (% distribution) for During 1961-74, 1974-81, 1981-91 and 1991-2001of . X: Age Group in Years and Y: Population |
 | Figure 4. Cumulative Age Distribution of Male Stable Population (% distribution) for During 1961-74, 1974-81, 1981-91 and 1991-2001 of . X: Age Group in Years and Y: Cumulative Population |
5. Conclusions
- The changing situation of mortality and fertility could affect the age structure of corresponding stable population. But the estimated male stable population at the mid points of different intercensal periods showed such type of slight evidence. The estimated male stable populations for various intercensual periods are almost all coincide or similar to each other. From the above observations it may be concluded that, whatever may be the fertility and mortality situation for male population, their corresponding stable population in connection with age is more or less identical.Again, the similar study could be carried out, that is, the stable population can be estimated using the fertility and mortality schedule for male, female and for both sexes (Shryock et al. 1975). But, the scope of this study is beyond in this paper. It is left for further investigation in near future.
References
| [1] | BBS, 1977, Population Census of Bangladesh 1974, National Volume, Government of the People’s Republic of , . |
| [2] | BBS, 1984, Bangladesh Population Census 1981, National Series, Government of the People’s Republic of , |
| [3] | BBS, 1994, Bangladesh Population Census 1991, Vol.1, National Series, Government of the People’s Republic of , . |
| [4] | BBS, 2003, Population Census 2001, National Report, Government of the People’s Republic of , . |
| [5] | BBS, 1981, Statistical Year Book of 1980. |
| [6] | BBS, 1982, Statistical Year Book of 1982. |
| [7] | BBS, 2001, Statistical Year Book of 1999. |
| [8] | BFS, 1978, Fertility Survey 1975, Country Report Number One, , Ministry of Population Control and Family Planning. |
| [9] | BFS, 1989, Bangladesh Fertility Survey 1989, National institute of Population Research and Training (NIPORT), . |
| [10] | Government of , 1964, Census of () 1961, Volume-2. |
| [11] | Islam, Md. Rafiqul and Ali, M. Korban, 2004, Female stable population tends to be identical-An evidence from Bangladesh censuses, Rajshahi University Studies, J. of Science, Part-B, Vol. 32: 131-139. |
| [12] | Keyfitz, N, 1968, Introduction to the Mathematics of Population, Addison Wesley Publishing Company, . |
| [13] | Misra, B. D, 1995, An Introduction to the Study of Population, 2nd Edition, South Asian Publishers Pvt. Ltd., . |
| [14] | Shryock, H.S. and Siegel, J.S. and Associates, 1975, The Methods and Materials of Demography, Vol. , Government Printing Office, . |
| [15] | United Nations, 1982, Model Life Tables for Developing Countries, Department of International Economic and Social Affairs, Population Studies, No.77. |
| [16] | United Nations, 1983, Mannual X. Indirect Techniques for Demographic Estimation, Department of International Economic and Social Affairs, Population Studies, No. 81, New York. |
 Abstract
 Reference
 Full-Text PDF
 Full-text HTML