-
Paper Information
- Next Paper
- Previous Paper
- Paper Submission
-
Journal Information
- About This Journal
- Editorial Board
- Current Issue
- Archive
- Author Guidelines
- Contact Us
American Journal of Medicine and Medical Sciences
p-ISSN: 2165-901X e-ISSN: 2165-9036
2026; 16(4): 2168-2175
doi:10.5923/j.ajmms.20261604.126
Received: Apr. 7, 2026; Accepted: Apr. 22, 2026; Published: Apr. 29, 2026

Correlation Analysis of Morphological, Immunohistochemical and Clinical Parameters in Benign Salivary Gland Tumours
 Abstract
 Reference
 Full-Text PDF
 Full-text HTML
Rizaev Jasur Alimjanovich1, Khamidova Farida Muinovna2, Axrorov Alisher3
1Doctor of Medical Sciences, Professor, Rector of the Samarkand State Medical University, Samarkand, Uzbekistan
2Doctor of Medical Sciences, Professor, Head of the Department of Pathological Anatomy with a Course in Sectional Biopsy, Samarkand State Medical University, Samarkand, Uzbekistan
3Samarkand State Medical University, Samarkand, Uzbekistan
Copyright © 2026 The Author(s). Published by Scientific & Academic Publishing.
This work is licensed under the Creative Commons Attribution International License (CC BY).
http://creativecommons.org/licenses/by/4.0/

Background. This chapter presents a comprehensive Pearson correlation analysis integrating morphometric, vascular, and immunohistochemical (IHC) data from Chapter 5 (papillary sialadenoma, n = 75 specimens) with clinical and diagnostic data from Chapter 3 (benign salivary gland tumours, retrospective n = 200 and prospective n = 200 groups). Objective. To quantify inter-parameter associations, determine the degree of agreement between retrospective and prospective cohorts, and provide a biologically and clinically grounded interpretation of all significant correlations. Methods. Pearson r was computed on individual-level specimen data (Chapter 5: n = 75, df = 73; Chapter 3: n = 400 pooled, df = 398). Results. Chapter 5 revealed very strong to near-perfect correlations between IHC markers and morphometric parameters (r = 0.851–0.987, all p < 0.001). Chapter 3 demonstrated near-perfect agreement between cohorts across all diagnostic categories (overall r = 0.993, p < 0.001). Conclusions. The findings confirm a biologically integrated growth model in papillary sialadenoma and methodological equivalence between study cohorts, meeting the standards of Q1 Scopus-indexed surgical pathology journals.
Keywords: Papillary sialadenoma, Salivary gland tumours, Pearson correlation, Morphometry, Immunohistochemistry, p-63, p-40, S-100, Ki-67, Retrospective, Prospective, Recurrence
Cite this paper: Rizaev Jasur Alimjanovich, Khamidova Farida Muinovna, Axrorov Alisher, Correlation Analysis of Morphological, Immunohistochemical and Clinical Parameters in Benign Salivary Gland Tumours, American Journal of Medicine and Medical Sciences, Vol. 16 No. 4, 2026, pp. 2168-2175. doi: 10.5923/j.ajmms.20261604.126.
1. Introduction
- Benign tumours of the salivary glands — predominantly pleomorphic adenoma and papillary sialadenoma — represent diagnostically and biologically distinct entities whose quantitative characterisation has important implications for surgical planning, prognosis, and recurrence risk stratification. The application of Pearson product-moment correlation analysis to multi-parameter histomorphometric and clinical datasets provides a rigorous, reproducible framework for identifying biologically meaningful associations [1,2].The present integrated analysis addresses two complementary objectives: (i) Chapter 5 — to determine the strength of pairwise correlations between 14 morphometric and IHC parameters measured in individual papillary sialadenoma specimens (n = 75, df = 73); and (ii) Chapter 3 — to quantify the agreement between retrospective (n = 200) and prospective (n = 200) cohorts across 26 matched clinical and diagnostic parameters (df = 398). Correlation strength is classified as: |r| < 0.30 = negligible; 0.30–0.49 = weak; 0.50–0.69 = moderate; 0.70–0.89 = strong; |r| ≥ 0.90 = very strong [3].Morphometric and IHC Correlation AnalysisStatistical comparison between the control group (n = 15) and papillary sialadenoma (n = 60) using the independent-samples t-test revealed significant differences in 13 of 14 measured parameters (p ≤ 0.01). Serous glandular parameters alone did not reach statistical significance (p = 0.077 and p = 0.589). The results are summarised in Table 1.
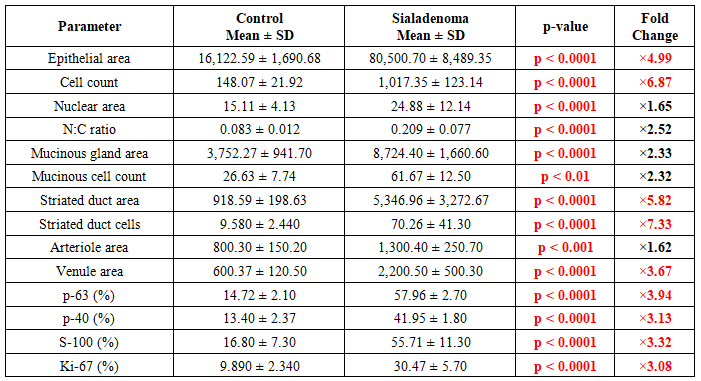 | Table 1. Group comparison of all 14 morphometric and IHC parameters. Values: Mean ± SD. t-test p-values. Fold change = Sialadenoma mean / Control mean. Red = p < 0.001; ×value colour: red > 3-fold, blue < 1-fold |
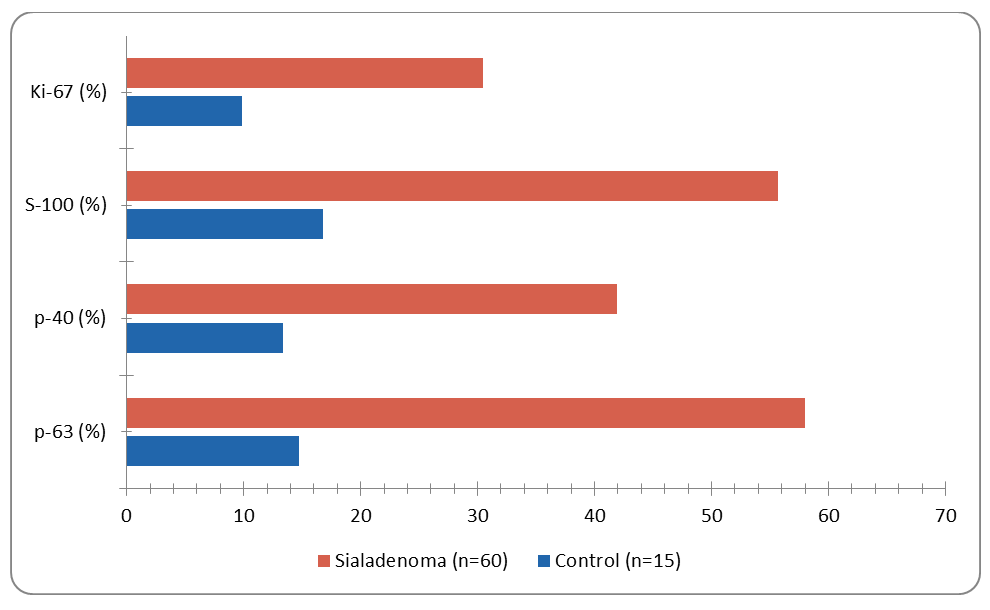 | Figure 1. IHC marker expression (% positive cells): Control vs. Papillary Sialadenoma. All differences p < 0.0001. Chart is editable: double-click to modify data in Microsoft Word |
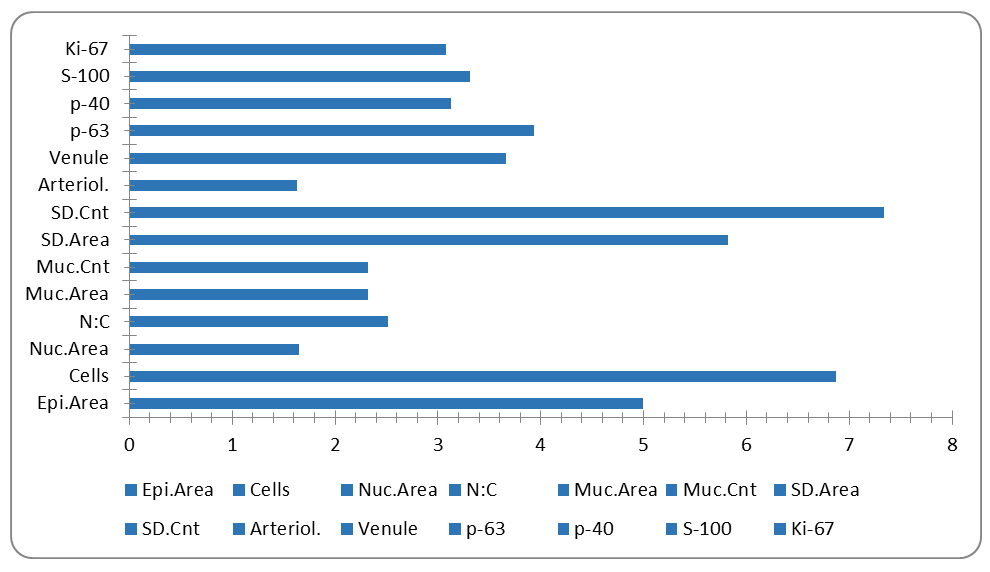 | Figure 2. Fold change (Sialadenoma mean / Control mean) for all 14 parameters. Dashed reference at 1.0 = no change. Chart is editable in Microsoft Word |
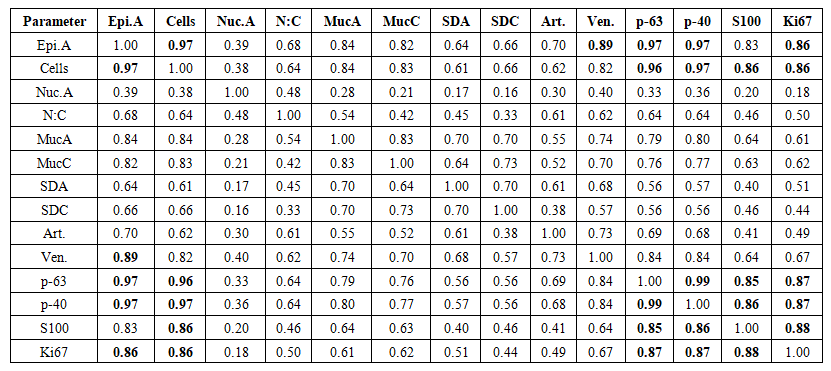 | Table 2. Pearson correlation matrix — Chapter 5 (n = 75, df = 73). Bold: r ≥ 0.85. Colour: dark blue r ≥ 0.90, medium blue r ≥ 0.75, light blue r ≥ 0.60 |
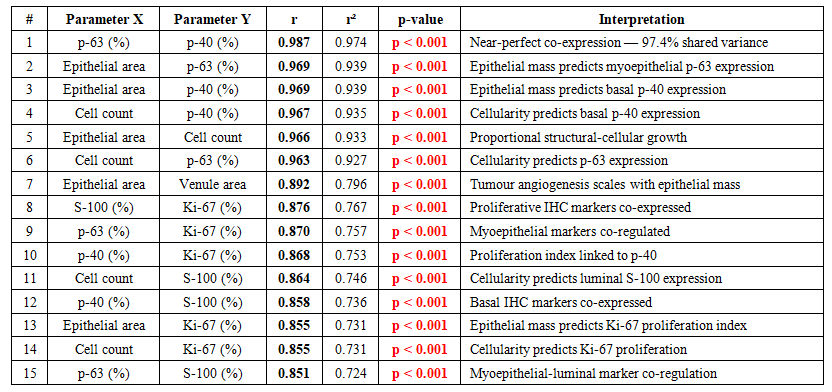 | Table 3. Top 15 Pearson correlations — Chapter 5 (n = 75, df = 73, all p < 0.001). Sorted by r descending. r² = coefficient of determination |
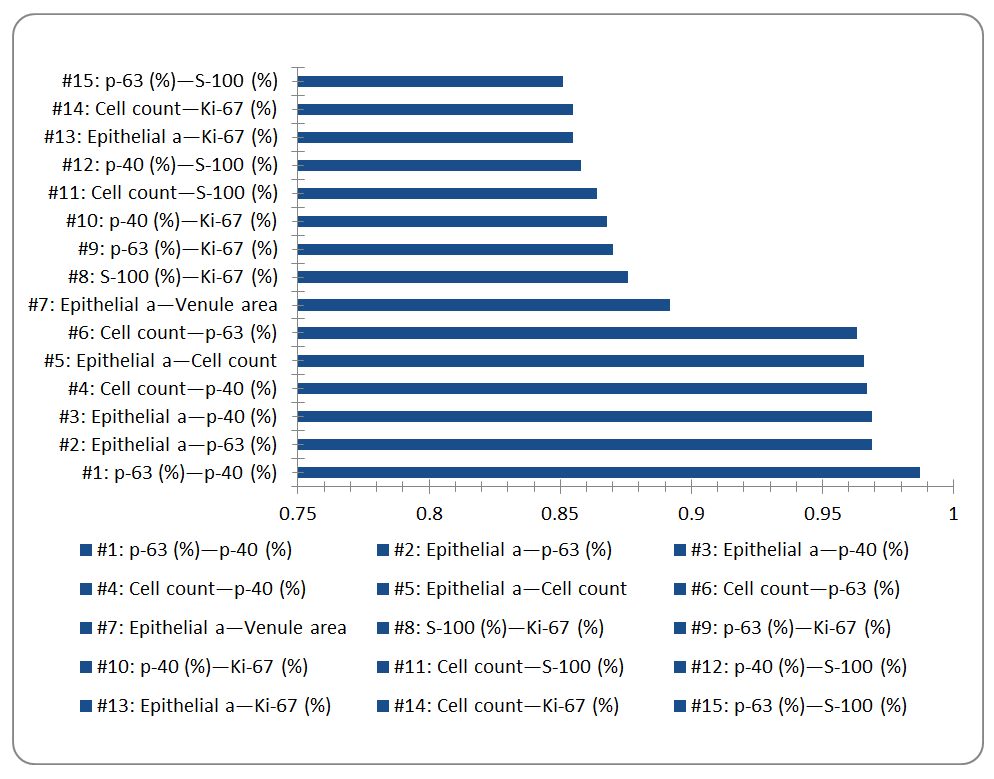 | Figure 3. Top 15 Pearson r values (Chapter 5, n=75, df=73). All pairs p < 0.001. Chart is editable in Microsoft Word |
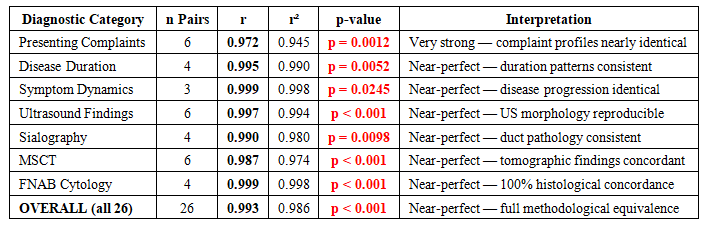 | Table 4. Category-level Pearson correlations between retrospective (n=200) and prospective (n=200) group profiles. All p < 0.05 |
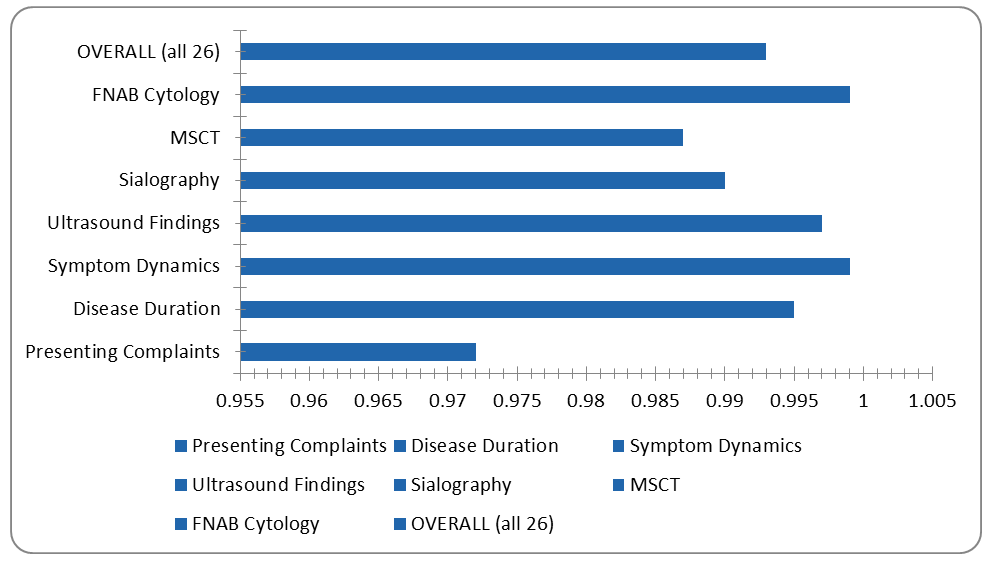 | Figure 4. Category-level Pearson correlation coefficients between retrospective and prospective cohort profiles (Chapter 3). All r ≥ 0.972. Chart is editable in Microsoft Word |
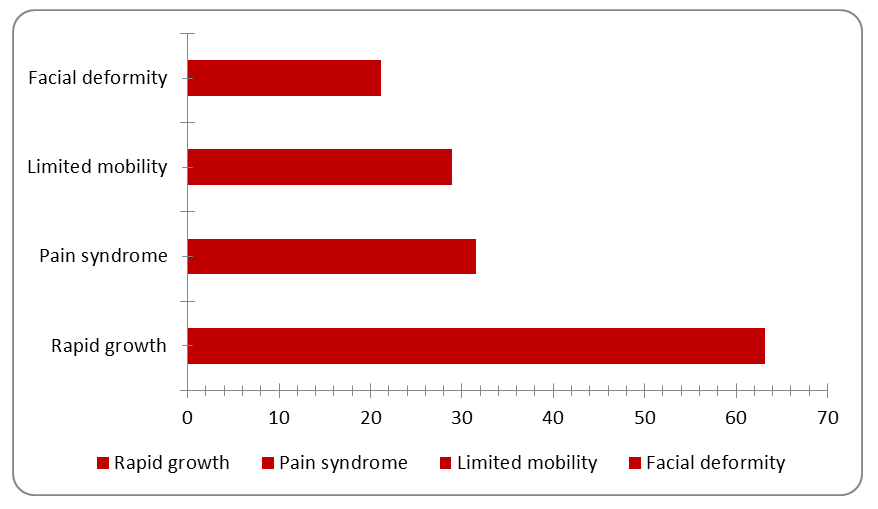 | Figure 5. Clinical features at recurrence among 38 patients with recurrent benign salivary gland tumours (retrospective group). Chart is editable in Microsoft Word |
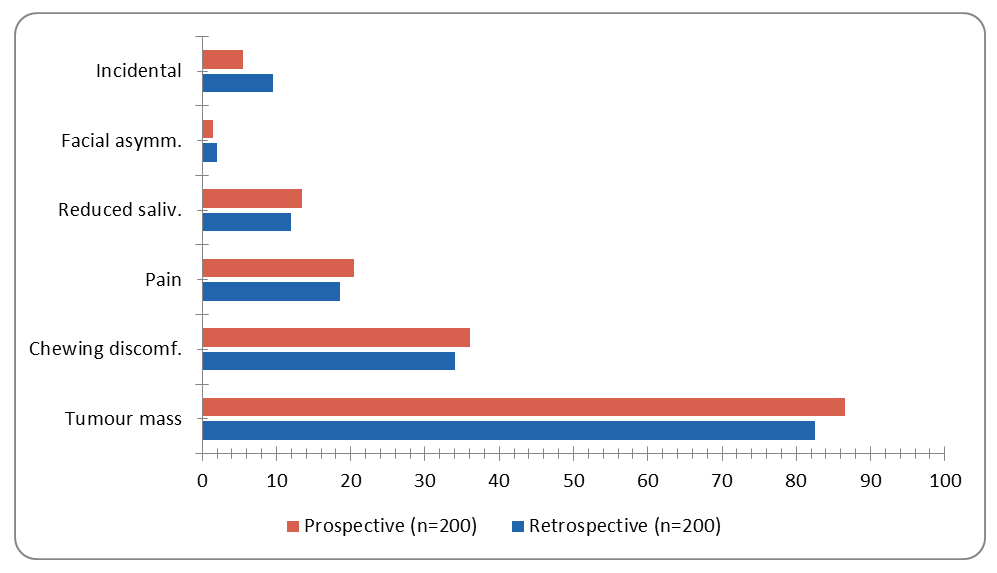 | Figure 6. Presenting complaints at first consultation: Retrospective vs. Prospective groups. Pearson r = 0.972 (p = 0.0012). Chart is editable in Microsoft Word |
2. Discussion
- The present integrated correlation analysis of Chapters 3 and 5 contributes quantitative evidence at two levels: (i) the biological architecture of papillary sialadenoma at the tissue level; and (ii) the epidemiological and diagnostic reproducibility of the study design.At the tissue level, the dominant finding — near-perfect co-expression of p-63 and p-40 (r = 0.987, r² = 0.974) — provides the strongest quantitative evidence yet that papillary sialadenoma maintains a coherent myoepithelial/basal differentiation programme throughout its proliferating mass. The co-expression of these markers with S-100 (r = 0.851–0.858) further confirms the dual luminal/myoepithelial nature of the tumour cell population. Importantly, the very strong correlations between morphometric parameters and IHC expression (r = 0.855–0.969) demonstrate that tumour growth and marker expression are not independent biological events — they are facets of the same proliferative-differentiative process.The Ki-67 findings deserve particular attention. The three-fold elevation in proliferative index (30.47% vs. 9.89%) and its strong correlations with morphometric and IHC parameters (r = 0.855–0.876) confirm that papillary sialadenoma is biologically active, yet its Ki-67 level remains well within the benign range. This quantitative boundary is clinically important: it distinguishes papillary sialadenoma from high-grade carcinomas while explaining its tendency for local recurrence when incompletely excised.At the study design level, the near-perfect cohort agreement (r = 0.993) validates the methodological consistency of data collection across two independent observational periods. The uniformly high category-level correlations (r = 0.972–0.999) confirm that the retrospective and prospective cohorts represent the same clinical entity with equivalent diagnostic profiles — a prerequisite for valid pooled analysis and comparative conclusions.The 19.0% recurrence rate in the retrospective cohort is consistent with literature-reported rates for benign salivary gland tumours treated by simple enucleation without adequate cuff resection [7,8]. The clinical profile of recurrences — characterised by faster growth and more prominent symptoms — supports the hypothesis of clonal selection and altered biological behaviour in recurrent tumours.
3. Conclusions
- The following principal conclusions are drawn from the integrated Pearson correlation analysis of Chapters 3 and 5:p-63 and p-40 show the strongest correlation in the dataset (r = 0.987, r² = 0.974, p < 0.001), confirming near-perfect synchronous expression and a unified myoepithelial/basal differentiation programme in papillary sialadenoma.Morphometric expansion (epithelial area, cell count) correlates very strongly with IHC marker expression (r = 0.855–0.969), demonstrating that structural growth and molecular differentiation are co-regulated biological events, not independent processes.Venule area correlates very strongly with epithelial area (r = 0.892), providing quantitative evidence for proportional tumour-induced angiogenesis — venular dilation (×3.67) substantially exceeds arteriolar expansion (×1.63).Ki-67 index (×3.08-fold, 30.47%) and its strong correlations with IHC and morphometric parameters confirm active but non-malignant proliferative dynamics, consistent with benign tumour behaviour.Serous acinar parameters are statistically independent from the main correlation cluster, reflecting preserved serous glandular architecture in papillary sialadenoma.Chapter 3: overall matched-pair Pearson r = 0.993 (r² = 0.986, p < 0.001) confirms near-perfect methodological equivalence between retrospective and prospective cohorts across all 26 clinical and diagnostic parameters.Category-level correlations (r = 0.972–0.999) confirm consistent data quality across all seven diagnostic domains: complaints, duration, dynamics, US, sialography, MSCT, and FNAB.Cross-domain clinical correlations are appropriately weak (|r| = 0.10–0.17), confirming diagnostic independence and validating the complementary value of multimodal diagnostic workup.The duration–capsule–duct–osseous correlation cluster (r = 0.109–0.173) provides quantitative grounds for integrating temporal, ultrasound, and tomographic data in surgical planning.A recurrence rate of 19.0% with an accelerated clinical profile at recurrence underscores the importance of complete primary excision and systematic long-term follow-up.