-
Paper Information
- Previous Paper
- Paper Submission
-
Journal Information
- About This Journal
- Editorial Board
- Current Issue
- Archive
- Author Guidelines
- Contact Us
American Journal of Medicine and Medical Sciences
p-ISSN: 2165-901X e-ISSN: 2165-9036
2026; 16(4): 2127-2133
doi:10.5923/j.ajmms.20261604.116
Received: Mar. 22, 2026; Accepted: Apr. 19, 2026; Published: Apr. 28, 2026

Assessment of Systemic and Local Factors Influencing Diabetic Vitreopathy in Patients with Type 1 Diabetes Mellitus
 Abstract
 Reference
 Full-Text PDF
 Full-text HTML
F. S. Tadzhieva, K. J. Suvonov
Department of Clinical Sciences, Urgench Technological University RANCH, Urgench, Uzbekistan
Copyright © 2026 The Author(s). Published by Scientific & Academic Publishing.
This work is licensed under the Creative Commons Attribution International License (CC BY).
http://creativecommons.org/licenses/by/4.0/

This study investigates early signs of diabetic vitreopathy in young patients with type 1 diabetes mellitus and examines its relationship with systemic and local factors. A total of 86 healthy individuals and 129 patients with type 1 diabetes aged 10–24 years were included in the study. Multislice spiral computed tomography (MSCT) was used to assess changes in vitreous body density. The results demonstrated significantly increased vitreous density in the central and preretinal zones in diabetic patients compared with healthy individuals. Among systemic factors, carbohydrate metabolism indicators showed the strongest association with vitreous changes. The findings confirm that MSCT is a sensitive method for early detection of diabetic vitreous alterations and suggest that collagen fiber compaction plays a key role in these processes.
Keywords: Vitreous body, Type 1 of diabetes mellitus, Multi-slice spiral computed tomography, Diabetic retinopathy
Cite this paper: F. S. Tadzhieva, K. J. Suvonov, Assessment of Systemic and Local Factors Influencing Diabetic Vitreopathy in Patients with Type 1 Diabetes Mellitus, American Journal of Medicine and Medical Sciences, Vol. 16 No. 4, 2026, pp. 2127-2133. doi: 10.5923/j.ajmms.20261604.116.
1. Introduction
- Diabetic Vitreopathy is a change in the structure of the vitreous body that occurs in patients with diabetes mellitus (DM) due to biochemical disturbances caused by the underlying disease [1], [2]. Normally, the vitreous body is a transparent substance that is difficult to visualize even with the use of modern diagnostic methods. According to studies, vitreopathy develops much earlier than retinal damage [3], [4]. However, even at late stages, recording changes in the vitreous body is a difficult task. In patients with DM, the vitreous body becomes visible only with the development of pathologies, such as hemorrhage, fibrosis or detachment. Intravital diagnostic methods mainly provide a qualitative assessment of the vitreous body, while quantitative approaches remain imperfect [5], [6]. Historically, changes in the retina were considered the main cause of diabetic retinopathy, and the vitreous body was a secondary structure, changes in which are associated with metabolic products [7], [8]. However, it has been proven that the vitreous plays an important role in the development of complications such as retinal detachment, maculopathy, and retinal vein occlusion [9]. It was previously found that the structure of the vitreous in diabetes mellitus differs from changes associated with age or other diseases [11]. However, methods for early detection of such changes have not yet been developed, which limits the possibilities for their timely correction [10]. This emphasizes the importance of early diagnosis, which will help determine the role of the vitreous in the development of diabetic retinopathy. With modern advances in the diagnosis and treatment of diabetic retinopathy (DR), the focus must shift from treating late-stage disease to early detection and prevention. A key element in this approach is identifying functional defects of the retina (FDR), which result from diabetic retinopathy-associated neuropathy (DRN) before vascular abnormalities become apparent. Despite the promise of multifunctional perimetry in detecting FDR, it is not yet integrated into the standard diagnostic protocols for DR and diabetic macular edema (DME). Since FDR could serve as an objective marker of treatment efficacy, new therapeutic approaches aimed at addressing DRN pathophysiology must be assessed in clinical trials using sensitive FDR-based outcome measures. Beyond diabetic eye disease, FDR has the potential to be a valuable biomarker for diagnosing a range of diabetes-related complications, including peripheral neuropathy, kidney disease, diabetic foot disease, vascular disorders, and cardiac failure. Thus, incorporating multifocal perimetry into routine diabetic patient assessments could offer substantial diagnostic and therapeutic advantages, paving the way for earlier intervention and improved patient outcomes [17].Diabetic retinopathy (DR) is a major chronic complication of hyperglycemia in patients with diabetes and the leading cause of blindness among the working-age population [18]. DR leads to irreversible vision loss and blindness, thereby considerably reducing the quality of life, and can be life-threatening. The number of patients with DR is predicted to increase from 103 million in 2020 to 160.5 million by 2045 [19]. DR occurs in approximately one-third of patients with diabetes, with the incidence increasing with the duration of diabetes [20,21]. Disease progression can lead to fundus hemorrhage and retinal detachment, resulting in blindness, and non-vascular retinal cells degenerate during diabetes [22]. The pathogenesis of DR involves several pathways, protein kinase C activation, and advanced glycation end-product (AGE) accumulation6 [23,24]. DR-associated chronic hyperglycemia causes microvascular damage to the retina [25] contributing factor to DR. Inflammatory responses triggered by oxidative stress activate these pathways, leading to increased oxidative stress. Additionally, inflammation and neurodegeneration are potential new pathways contributing to the pathogenesis of DR [26,27]. Treatment for DR currently focuses on treating diabetes symptoms by controlling blood glucose, lipids, and blood pressure, along with dietary and exercise interventions [28]. Treatments aimed at controlling the progression of retinopathy include invasive surgical options such as laser therapy and vitrectomy, as well as pharmacological therapies using vascular endothelial growth factor (VEGF) inhibitors and steroids. However, these treatments have limited indications and only have temporary effects [29]. Therefore, although various new drugs are being developed globally, none have yet reached clinical application [30], and developing new therapeutic agents that can inhibit DR progression is essential.Despite the pioneering efforts of these early investigators, who were constrained by the limitations of then available methodologies, recent advances in imaging techniques [7,8] and high-throughput transcriptional and protein analyses have provided a more comprehensive understanding of the unique characteristics of hyalocytes. The origin, turnover, localization, structure, and expression profile of hyalocytes have undergone examination using various techniques, including dark-field slit-, light-, phase contrast-, and electron microscopy; as well as immunohistochemistry, immunofluorescent labeling, transgenic reporter lines application combined with fluorescent microscopy, and confocal microscopy [9]. Furthermore, the utilization of proteomic studies including imaging mass cytometry has propelled our understanding forward [10–12]. While these techniques have produced invaluable insights into hyalocyte physiology, the advent of optical coherence tomography (OCT), scanning light ophthalmoscopy (SLO), and adaptive optics (AOSLO) has paved the way for imaging single hyalocytes in vivo over time, particularly in human subjects [13].Purpose of the study: The main objective of the study is the early diagnosis of signs of diabetic vitreopathy in young patients with type 1 diabetes. The possible relationship of these changes with systemic and local factors is also studied.
2. Materials and Methods
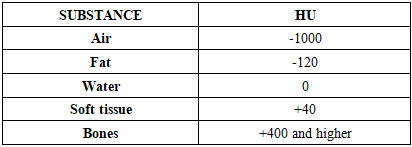
- To achieve the set goals, 215 people were examined, including 86 conditionally healthy patients (172 eyes) and 129 patients with type 1 diabetes (258 eyes) aged 10 to 24 years. This age range was chosen based on the physiological characteristics of the vitreous body, which remains underdeveloped until the age of 10, and after 35 years begins to undergo age-related changes.The study groups were divided as follows:• Group I: conditionally healthy patients (86 people).• Group II: patients with type 1 diabetes (129 people).The anamnesis included collection of information on cases of high blood pressure, hereditary and rheumatoid diseases, and the most frequent complaints. For patients with diabetes, data on the course of the disease, episodes of hyperglycemia, hypoglycemic conditions, and existing complications were recorded.During MSCT, tissue density is assessed in Hounsfield units (HU). The Hounsfield scale, or densitometric scale, is a scale of linear attenuation of radiation, with the X-ray density of distilled water at standard pressure and temperature being set at 0 HU. Numerous studies on the density of tissues in humans and animals have identified average densitometric values for the tissues of the human and animal body, which are presented below (Table 1).
|
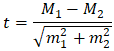 where: М1 and М2 are the compared mean values, m1 and m2 are the standard errors of the mean values, respectively.Comparison of mean values was performed using Student's t-test calculated using the standard formula. The obtained values were compared with critical, and differences were considered statistically significant at a significance level of p < 0.05. To assess the reliability of percentage differences, the Fisher angular transformation criterion (φ*) was used. Values of p > 0.05 indicated the absence of statistically significant differences, and p < 0.05 indicated their presence.
3. Results and Discussion
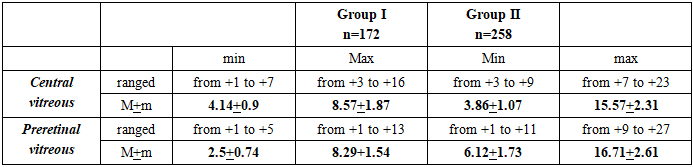
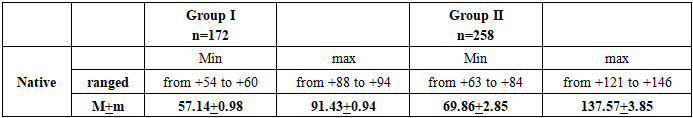
- The examined patients of both groups were ranked by age and gender. The average age of the participants of the first group (conditionally healthy) was 19.3 ± 3.1 years, and that of the patients of the second group (with type 1 diabetes) was 18.1 ± 4.2 years. The differences in age between the groups were statistically insignificant (p = 0.82).Patients with ocular trauma, surgery, or systemic diseases affecting the vitreous were excluded from the study.Complaints and heredity:Among the conditionally healthy participants of Group I, complaints characteristic of diabetes were not recorded. However, 8.33% (8 people) of them had diabetes mellitus type 1 or 2 among their closest relatives. In addition, 2.38% (3 people) had relatives with cases of diabetic retinopathy. In the second group (type 1 diabetes), family history showed that 9.45% of patients had close relatives with diabetes, and 3.94% had diabetic retinopathy.Onset and course of diabetes:In patients with type 1 diabetes, the age at disease onset ranged from 1.5 to 29 years, with a median of 11.8 years. The average duration of the disease at the time of the study was 9.1 ± 3.2 years.Visual acuity: Among the conditionally healthy patients, decreased distance visual acuity was observed in 16.7% of participants, however, no complaints of glare, distortion, or problems with color perception were recorded. In patients with type 1 diabetes, decreased distance vision was noted in 35.4% of cases, decreased near vision in 4.72%. Complaints of color distortion, object distortion, and glare were recorded in 2.36%, 9.45%, and 26.8% of cases, respectively, which is significantly more common than in healthy participants (φ = 3.783).Refractive errors: The frequency of myopia and mild hyperopia was comparable in both groups: 16.7% of the apparently healthy participants and 18.5% of the patients with diabetes had myopia, while hyperopia was recorded in 13.1% and 14.97% of cases, respectively. However, no statistically significant differences were found between the groups in these indicators.The best-corrected visual acuity (BCVA) was 0.93 ± 0.03 in group I and 0.91 ± 0.06 in group II; the differences did not reach statistical significance (p = 0.766).Intraocular pressure and peripheral vision. To exclude the influence of ophthalmic hypertension and glaucoma, all patients with elevated intraocular pressure were excluded from the study. The average intraocular pressure values in the group of conditionally healthy subjects were 20.1 ± 0.62 mm Hg, ranging from 18 to 23 mm Hg. In patients with type 1 diabetes (group II), the pressure ranged from 16 to 22 mm Hg, with an average value of 19.6 ± 0.81 mm Hg. The differences between the groups did not reach statistical significance (p = 0.62). Peripheral vision parameters were assessed based on the total visual field (average normal value: 265°). The total visual field in the group of conditionally healthy patients was 256.1 ± 3.03°, while in the group of patients with type 1 diabetes it was 252.9 ± 4.13°. No statistically significant differences were found between the groups (p = 0.532).Metabolic indicesLipid metabolism:The average level of total cholesterol in conditionally healthy patients was 4.32 ± 1.2 mmol /l, and in patients with diabetes - 4.84 ± 1.4 mmol /l (p = 0.78). Triglyceride levels also did not differ between the groups: 1.47 ± 0.46 mmol /l in group I and 1.59 ± 0.83 mmol /l in group II (p = 0.89). Low-density lipoproteins (LDL) were 3.3 ± 1.45 mmol / l in the group of conditionally healthy and 2.65 ± 0.78 mmol / l in the group with diabetes (p = 0.69). High-density lipoproteins (HDL) reached 1.73 ± 0.31 mmol / l in conditionally healthy and 1.04 ± 0.43 mmol / l in patients with diabetes (p = 0.19). These results indicate the absence of significant differences in lipid metabolism between the groups.Glycemic level:Glycemia was the main factor distinguishing between the groups. In healthy patients, the average fasting blood glucose level was 4.9 ± 0.63 mmol / l, while in patients with diabetes this indicator was on average 3.7 times higher (18.37 ± 5.89 mmol / l, p = 0.02). Postprandial glycemia in patients with diabetes exceeded the same indicator in healthy subjects by 4.5 times (23.7 ± 4.97 mmol /l versus 5.23 ± 0.24 mmol /l, p = 0.00029). Glycated hemoglobin also showed significant differences: 6.37 ± 0.43% in healthy subjects versus 13.3 ± 3.01% in diabetic patients (p = 0.024).These data confirm that carbohydrate metabolism disorders are a key systemic factor influencing the development of diabetic changes. As mentioned earlier, the main goal of this study was to explore the potential of MSCT as an in vivo method for detecting early signs of diabetic vitreopathy and to assess the influence of various local and systemic factors on the development of changes in the vitreous body. In none of the observations, both in patients with type 1 diabetes (group II) and in conditionally healthy patients (group I), were we able to register vitreous body opacities during biomicroscopy with high diopter lenses. However, MSCT data revealed different indicators (Table 2).
|
|
4. Conclusions
- Research in recent decades has confirmed the significant role of the vitreous body in the development of diabetes-related complications such as hemophthalmos, retinal detachment, macular edema, and retinal vascular occlusion. However, such changes are usually recorded in the late stages of diabetic retinopathy. Meanwhile, signs of diabetic vitreopathy can be detected long before its development.Possible mechanisms of influence of the vitreous body:There are several hypotheses regarding the role of the vitreous body in the development of diabetic retinopathy:• Some researchers consider the vitreous body to be a kind of “reservoir” for metabolic products, which accumulate over time and stimulate pathological changes in the retina.• Another hypothesis points to a disruption in the diffusion of oxygen through the vitreous body, which leads to deterioration of the retina.• Proponents of the third theory argue that contact of the vitreous body with the retina or the traction effect of vitreous fibers stimulates proliferative changes.Despite disagreements regarding the mechanisms, all hypotheses agree on one thing: changes in the vitreous body in diabetes have a significant impact on the development of retinopathy.The role of glycemia and other factors:The main factor causing structural changes in the vitreous body is a high level of glycemia. This is confirmed by significant differences between the groups in fasting glycemia, postprandial glycemia and glycated hemoglobin levels. At the same time, lipid metabolism indices and local ophthalmologic factors did not demonstrate statistically significant differences.Applications of MSCT:MSCT has proven its effectiveness as a method for early diagnostics of vitreous changes in diabetes. It allows quantitative assessment of density changes by recording differences between the hyaluronic and collagen components of the vitreous. The data obtained confirm that collagen fiber compaction is a key process in type 1 diabetes.