-
Paper Information
- Next Paper
- Previous Paper
- Paper Submission
-
Journal Information
- About This Journal
- Editorial Board
- Current Issue
- Archive
- Author Guidelines
- Contact Us
American Journal of Medicine and Medical Sciences
p-ISSN: 2165-901X e-ISSN: 2165-9036
2026; 16(3): 1439-1445
doi:10.5923/j.ajmms.20261603.124
Received: Feb. 4, 2026; Accepted: Mar. 2, 2026; Published: Mar. 27, 2026

Determination of the Chemical Constituents of Calendula Officinalis L.
 Abstract
 Reference
 Full-Text PDF
 Full-text HTML
Ibragim Askarov1, Nasrulla Khakimov2, Khabibullo Kodirov2
1Andijan State University, Andijan, Uzbekistan
2Andijan State Medical Institute, Andijan, Uzbekistan
Correspondence to: Khabibullo Kodirov, Andijan State Medical Institute, Andijan, Uzbekistan.
| Email: |  |
Copyright © 2026 The Author(s). Published by Scientific & Academic Publishing.
This work is licensed under the Creative Commons Attribution International License (CC BY).
http://creativecommons.org/licenses/by/4.0/

This study aimed to determine the key chemical constituents, including water-soluble vitamins and phenolic compounds, in the leaves of Calendula officinalis L. cultivated in Uzbekistan. The chemical profile of a hydroalcoholic leaf extract was analyzed using High-Performance Liquid Chromatography (HPLC). The antiradical activity of the extract was evaluated using the 2,2-diphenyl-1-picrylhydrazyl (DPPH) assay. The analysis revealed the presence of significant quantities of vitamin B1 (67.3 mg/100g), vitamin PP (21.2 mg/100g), and the flavonoids quercetin (532.7 mg/100g) and apigenin (15.9 mg/100g). The extract demonstrated notable antiradical activity, with an IC50 value of 645.2 µL. These findings provide a preliminary chemical basis for the traditional use of Calendula officinalis leaves and suggest their potential as a source of bioactive compounds for nutraceutical and pharmaceutical applications.
Keywords: Calendula officinalis, Marigold, Leaf, Vitamins, Phenolic compounds, Quercetin, DPPH, Antiradical activity, HPLC, Uzbekistan
Cite this paper: Ibragim Askarov, Nasrulla Khakimov, Khabibullo Kodirov, Determination of the Chemical Constituents of Calendula Officinalis L., American Journal of Medicine and Medical Sciences, Vol. 16 No. 3, 2026, pp. 1439-1445. doi: 10.5923/j.ajmms.20261603.124.
Article Outline
1. Introduction
- Calendula officinalis L. (marigold) is an annual herbaceous plant from the Asteraceae family, cultivated worldwide for its ornamental, culinary, and medicinal uses [1]. Its flowers are well-documented for wound healing and anti-inflammatory properties [2,3]. While extensive research has focused on the flower heads, the chemical composition and bioactivity of the leaves, often considered agricultural by-products, are less explored [4,5].In Uzbekistan, C. officinalis is a commonly grown crop, yet comprehensive data on the phytochemical profile of its locally cultivated varieties are limited. Leaves are a potential source of valuable bioactive compounds, including vitamins, flavonoids, and other phenolic acids, which contribute to antioxidant defense mechanisms in the human body [6,7]. These compounds are known for their role in reducing oxidative stress, a factor implicated in various chronic diseases [8].This study aims to address the gap in knowledge regarding the composition of C. officinalis leaves grown in Uzbekistan. The primary objective was to quantitatively determine the major water-soluble vitamins and phenolic compounds in the leaf extract using HPLC and to evaluate its in vitro antiradical capacity using the DPPH assay. This work seeks to provide a scientific basis for the potential utilization of C. officinalis leaves as a functional food ingredient or a source of natural bioactives.
2. Materials and Methods
2.1. Plant Material and Chemicals
- Fresh leaves of Calendula officinalis L. were collected from experimental plots in the Andijan region, Uzbekistan (latitude: 40.78°N, longitude: 72.34°E) during the flowering stage in May 2024. The plant material was identified by Dr. [Name] at the Department of Botany, Andijan State University. A voucher specimen (Specimen No. AU-2024-05) was deposited at the university herbarium.All reference standards (vitamins B1, B2, B3, B6, B9, B12, C, PP; gallic acid, salicylic acid, rutin, quercetin, apigenin, kaempferol) and the DPPH reagent (2,2-diphenyl-1-picrylhydrazyl) were of analytical grade (≥98% purity) and purchased from Sigma-Aldrich (St. Louis, MO, USA). HPLC-grade acetonitrile, acetic acid, methanol, and ethanol were obtained from Merck (Darmstadt, Germany). Ultra-pure water (18.2 MΩ·cm) was used for all preparations.
2.2. Preparation of Standard Solutions
2.2.1. Vitamin Standards
- Individual stock solutions of vitamins C, B1, B6, B3, B12, and PP were prepared by dissolving 5 mg of each standard in 50 mL of 0.1 N HCl. Vitamins B2 and B9 were dissolved in 50 mL of 0.025% sodium hydroxide solution due to their lower solubility in acidic conditions. All stock solutions were stored at 4°C in amber glass vials and used within one week.A mixed working standard solution was prepared by diluting appropriate aliquots of the stock solutions to yield concentrations of 14.286, 7.143, 3.571, and 1.786 mg/L for the B-vitamins and 286, 143, 71.5, and 57.2 mg/L for vitamin C. These solutions were used to construct external calibration curves.
2.2.2. Phenolic Compound Standards
- Stock solutions of gallic acid, salicylic acid, rutin, quercetin, apigenin, and kaempferol were individually prepared by dissolving 5 mg of each compound in 50 mL of 96% ethanol with the aid of ultrasonication for 20 minutes at 25°C. Mixed calibration standards at four concentration levels (50, 25, 12.5, and 6.25 mg/L) were prepared by serial dilution of the stock solutions with ethanol.
2.3. Plant Extract Preparation
- Freshly collected C. officinalis leaves were cleaned, air-dried in the shade at room temperature (25 ± 2°C) for 7 days, and ground into a fine powder using a laboratory mill. The powdered material (1.0 g, accurately weighed on an OHAUS NV222 balance, USA) was transferred to a 50 mL conical flask and extracted with 25 mL of 96% ethanol in an ultrasonic bath (GT SONIC-D3, China) at 60°C for 20 minutes. The mixture was cooled to room temperature, filtered through Whatman No. 1 filter paper, and the filtrate was transferred to a 25 mL volumetric flask. The volume was made up to the mark with 96% ethanol.An aliquot (1.5 mL) of the extract was centrifuged at 7000 rpm for 10 minutes (Mini-7, BIOBASE, China) to remove particulate matter. The supernatant was carefully collected and filtered through a 0.45 µm PTFE syringe filter directly into an HPLC vial for analysis.
2.4. HPLC Analysis
- Chromatographic analyses were performed on a YOKE K7000 HPLC system (China) equipped with a quaternary pump, autosampler, column oven, and UV-Vis diode array detector (DAD). Separation was achieved on a reversed-phase C18 column (250 mm × 4.6 mm i.d., 5 µm particle size; Phenomenex, USA) maintained at 30°C. The injection volume was 20 µL for all analyses.
2.4.1. Vitamin Analysis
- The mobile phase consisted of 0.1% acetic acid in water (Solvent A) and acetonitrile (Solvent B) delivered at a flow rate of 1.0 mL/min. The gradient program was: 0-5 min, 5% B; 5-10 min, 5-20% B; 10-15 min, 20-30% B; 15-20 min, 30-50% B; followed by re-equilibration. Detection wavelengths were set at 254 nm for B-vitamins and 270 nm for vitamin C. Vitamins were identified by comparing retention times with those of reference standards. Quantification was performed using external calibration curves constructed by plotting peak area against concentration.
2.4.2. Phenolic Compound Analysis
- For phenolic compounds, the mobile phase consisted of 0.1% acetic acid in water (Solvent A) and methanol (Solvent B) with a flow rate of 1.0 mL/min. The gradient program was: 0-5 min, 30% B; 5-20 min, 30-60% B; 20-25 min, 60-80% B; 25-30 min, 80% B; followed by re-equilibration. Detection wavelengths were set at 280 nm for gallic and salicylic acids, and 360 nm for flavonoids (rutin, quercetin, apigenin, kaempferol). Identification and quantification were performed as described for vitamins.
2.5. DPPH Antiradical Assay
- The antiradical activity of the leaf extract was determined using the stable DPPH radical, based on the method of Blois [9] with minor modifications [10]. A 0.812 mM DPPH solution was prepared in ethanol and stored in the dark for 30 minutes before use to ensure stabilization.For the control measurement, 3 mL of DPPH solution was mixed with 200 µL of ethanol in a 4 mL quartz cuvette. The absorbance (D1) was measured at 517 nm every 10 seconds for 10 minutes using a YOKE K7000 spectrophotometer.For sample measurements, 3 mL of DPPH solution was mixed with different volumes (50, 100, 150, 200 µL) of the plant extract. Ethanol was added to each cuvette to bring the final volume to 3.2 mL, ensuring consistent path length. The absorbance (D2) was measured at 517 nm following the same 10-minute protocol. All experiments were performed in triplicate.The percentage of antiradical activity (AA%) was calculated using the following equation:AA%=D1−D2D1×100AA%=D1D1−D2×100The IC50 value, defined as the volume of extract (in µL) required to scavenge 50% of the DPPH radicals, was determined by plotting AA% against extract volume and performing linear regression analysis. The IC50 was calculated using the equation of the trend line (y = mx + b), solving for x when y = 50.
3. Results
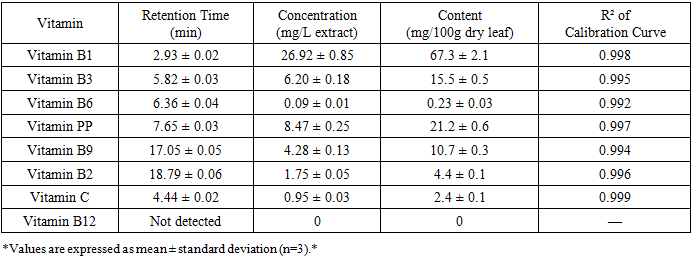
3.1. Vitamin Composition
- The HPLC analysis of the C. officinalis leaf extract successfully separated and identified several water-soluble vitamins. Figure 1 shows a representative chromatogram of the vitamin standards and the C. officinalis leaf extract at 254 nm. The retention times for the identified vitamins were: vitamin B1 at 2.93 min, vitamin C at 4.44 min, vitamin B3 at 5.82 min, vitamin B6 at 6.36 min, vitamin PP at 7.65 min, vitamin B9 at 17.05 min, and vitamin B2 at 18.79 min.
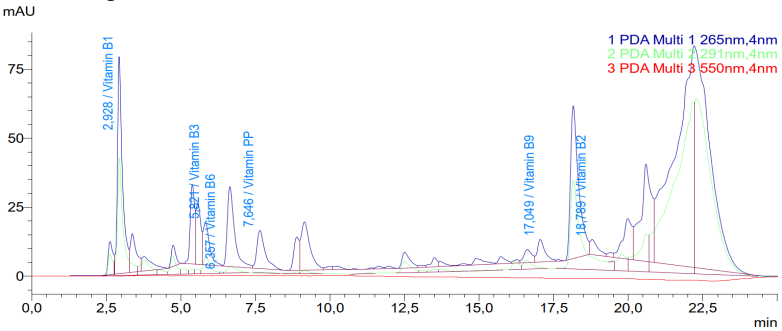 | Figure 1. HPLC chromatogram of Calendula officinalis leaf extract for vitamin analysis at 254 nm. Peaks: 1 = Vitamin B1 (2.93 min), 2 = Vitamin C (4.44 min), 3 = Vitamin B3 (5.82 min), 4 = Vitamin B6 (6.36 min), 5 = Vitamin PP (7.65 min), 6 = Vitamin B9 (17.05 min), 7 = Vitamin B2 (18.79 min) |
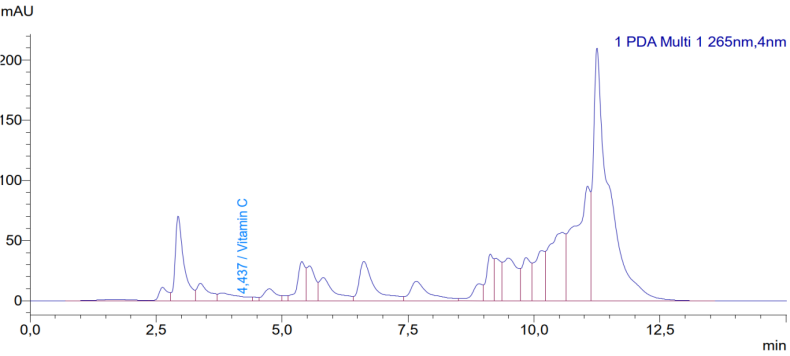 | Figure 2. HPLC chromatogram for determination of vitamin C in Calendula officinalis leaf extract at 270 nm. The peak at 4.44 min corresponds to vitamin C |
|
3.2. Phenolic Compound Composition
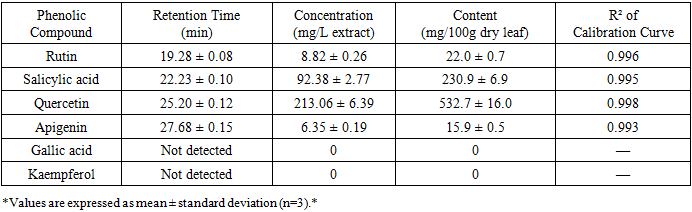
- The analysis of phenolic compounds in the extract revealed the presence of several bioactive polyphenols. Figure 3 shows the HPLC chromatogram of the C. officinalis leaf extract at 360 nm, with clear separation of the major flavonoid compounds.
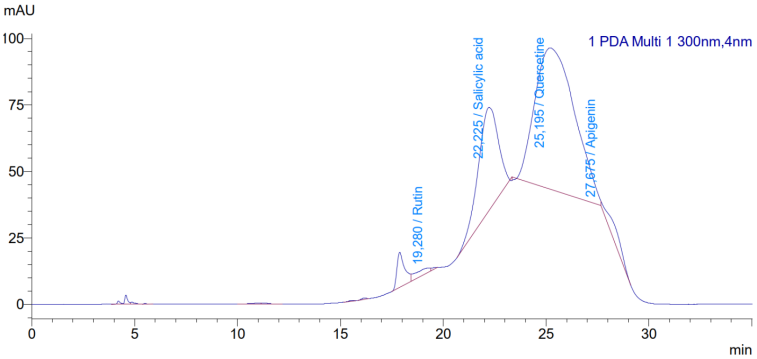 | Figure 3. HPLC chromatogram of Calendula officinalis leaf extract for phenolic compound analysis at 360 nm. Peaks: 1 = Rutin (19.28 min), 2 = Salicylic acid (22.23 min), 3 = Quercetin (25.20 min), 4 = Apigenin (27.68 min) |
|
3.3. Antiradical Activity
- The DPPH assay was used to evaluate the free radical scavenging capacity of the C. officinalis leaf extract. The extract reduced the initial DPPH absorbance in a concentration-dependent manner, indicating antiradical activity. Figure 4 shows the time-dependent decrease in absorbance at 517 nm for different volumes of the extract.
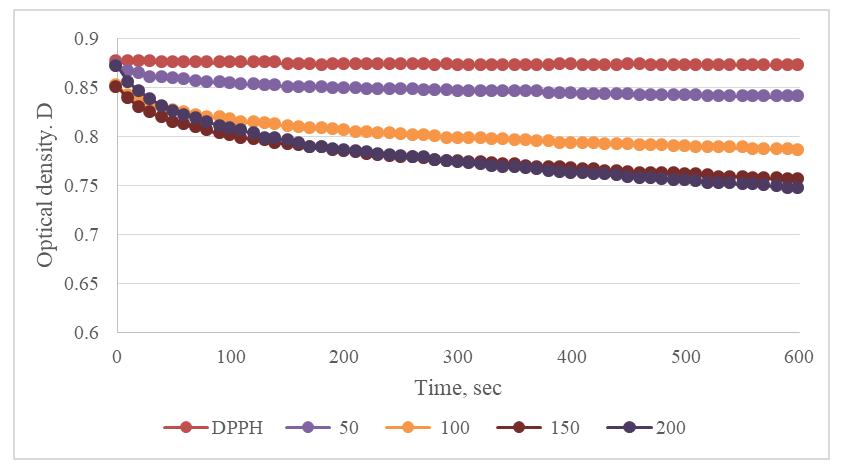 | Figure 4. Time-dependent decrease in DPPH absorbance at 517 nm for different volumes (50-200 µL) of Calendula officinalis leaf extract. The control (0 µL) represents DPPH solution without extract |
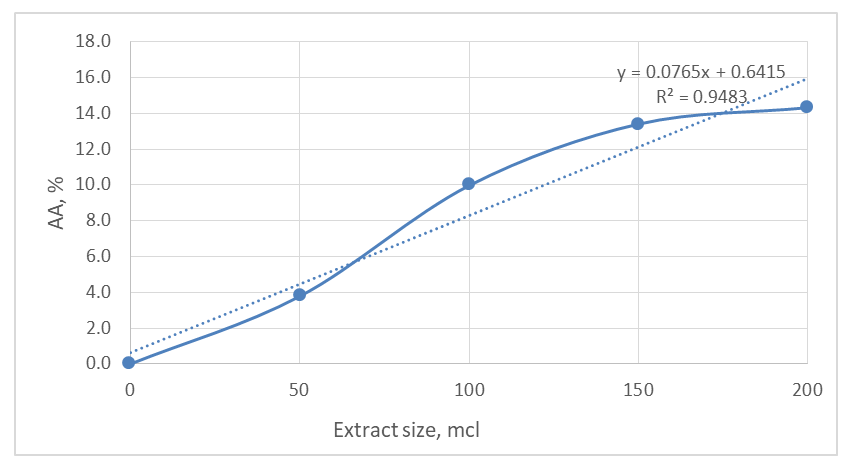 | Figure 5. Dose-response curve showing the percentage of DPPH radical scavenging (AA%) as a function of Calendula officinalis leaf extract volume (50-200 µL). Data points represent mean ± SD (n=3) |
4. Discussion
- This study provides the first quantitative report on the major vitamins and phenolic compounds in the leaves of Calendula officinalis cultivated in Uzbekistan. The results demonstrate that the leaves are a rich source of several bioactive constituents, particularly B-group vitamins and the flavonoid quercetin.
4.1. Vitamin Content
- The high content of vitamin B1 (67.3 mg/100g) found in the leaves is noteworthy. This exceeds the levels typically found in many common vegetables and highlights the leaf's potential as a dietary source of this essential nutrient. Thiamine (vitamin B1) plays a crucial role as a coenzyme in carbohydrate metabolism and is essential for nerve function [11]. The recommended daily intake of thiamine is 1.1-1.2 mg for adults [11], meaning that just 2 g of dried C. officinalis leaves could potentially meet the daily requirement.The substantial amount of vitamin PP (niacin, 21.2 mg/100g) further supports the leaves' nutritional value. Niacin is essential for cellular metabolism, DNA repair, and the production of steroid hormones [12]. The daily requirement for niacin is 14-16 mg for adults [12], suggesting that C. officinalis leaves could serve as a meaningful dietary source.Vitamin B3 (15.5 mg/100g) and vitamin B9 (folate, 10.7 mg/100g) were also present in significant quantities. Folate is particularly important for pregnant women to prevent neural tube defects in developing fetuses [13]. The presence of multiple B-vitamins in the leaves suggests they could contribute to energy metabolism and overall nutritional status.The relatively low concentration of vitamin C (2.4 mg/100g) compared to other plant sources (e.g., citrus fruits contain 50-70 mg/100g) may be attributed to degradation during the drying process or the specific extraction conditions used. Vitamin C is heat-labile and susceptible to oxidation, and the ultrasonic extraction at 60°C may have caused some degradation [14].
4.2. Phenolic Compounds
- Among the phenolic compounds identified, the concentration of quercetin (532.7 mg/100g) is particularly significant. Quercetin is a potent antioxidant flavonoid extensively studied for its anti-inflammatory, cardioprotective, and potential anti-carcinogenic properties [15]. The level detected in C. officinalis leaves is comparable to, or higher than, that found in other well-known dietary sources. For comparison:• Onions (Allium cepa): 20-50 mg/100g fresh weight [16]• Apples (Malus domestica): 2-5 mg/100g fresh weight [16]• C. officinalis leaves (this study): 532.7 mg/100g dry weightThe high quercetin content suggests that C. officinalis leaves could be an excellent source of this bioactive flavonoid for nutraceutical applications.Apigenin (15.9 mg/100g), another flavonoid with reported neuroprotective, anxiolytic, and anti-inflammatory effects [17], adds to the leaf's therapeutic potential. Apigenin has been shown to cross the blood-brain barrier and may have applications in managing neurodegenerative diseases [17].Salicylic acid (230.9 mg/100g), a precursor to aspirin (acetylsalicylic acid), is known for its anti-inflammatory and analgesic properties. The high concentration found in the leaves may contribute to the traditional use of Calendula preparations for treating inflammatory conditions [18].Rutin (22.0 mg/100g), a glycoside of quercetin, has been shown to strengthen capillaries and improve circulation [19]. Its presence complements the activity of quercetin and may enhance the overall antioxidant capacity of the extract.
4.3. Antiradical Activity
- The observed antiradical activity (IC50 = 645.2 µL) can be directly attributed to the presence of these phenolic compounds, particularly quercetin and apigenin, which are known for their ability to donate hydrogen atoms or electrons to stabilize free radicals like DPPH [20]. The dose-dependent decrease in DPPH absorbance (Figure 4) confirms the radical scavenging capacity of the extract.The IC50 value provides a quantitative measure of antiradical activity, with lower values indicating higher potency. While direct comparison with other studies is complicated by differences in extraction methods and assay conditions, the observed activity confirms that C. officinalis leaves possess significant antioxidant potential. This antioxidant capacity provides a scientific rationale for the traditional uses of the plant in managing conditions related to oxidative stress, such as inflammation and aging [21].
4.4. Study Limitations and Future Directions
- While this study offers valuable preliminary data, several limitations should be acknowledged:1. Scope of analysis: The analysis focused on a select group of compounds. A broader metabolomic profiling using LC-MS/MS would provide a more comprehensive chemical picture and might identify additional bioactive constituents.2. Extraction optimization: Only ethanolic extraction was evaluated. Future studies should compare different solvents (water, methanol, acetone) and extraction methods (maceration, Soxhlet, microwave-assisted) to optimize the yield of bioactive compounds.3. Biological validation: The biological activities discussed are inferred from the chemical composition and in vitro assay. In vivo studies using animal models and eventually human trials are required to confirm these effects and establish bioavailability and therapeutic efficacy.4. Seasonal variation: This study analyzed leaves collected at a single time point. Future research should investigate how the chemical composition varies with growing conditions, harvest time, and plant age.5. Standardization: For potential pharmaceutical or nutraceutical applications, standardized extracts with defined marker compounds need to be developed and validated.
5. Conclusions
- The leaves of Calendula officinalis L. grown in Uzbekistan are a rich source of bioactive phytochemicals. Key findings include:1. High vitamin content: The leaves contain substantial amounts of vitamin B1 (67.3 mg/100g), vitamin PP (21.2 mg/100g), and vitamin B3 (15.5 mg/100g), making them a potential dietary source of these essential nutrients.2. Abundant flavonoids: Quercetin (532.7 mg/100g) and apigenin (15.9 mg/100g) are present in significant quantities, with levels comparable to or exceeding those in many conventional dietary sources.3. Antiradical activity: The extract demonstrates significant in vitro antiradical activity (IC50 = 645.2 µL), which is likely linked to its high phenolic content.4. Valorization potential: These findings support the potential of C. officinalis leaves, often discarded as agricultural waste, to be valorized as a functional food ingredient or a source of natural antioxidants for nutraceutical and pharmaceutical applications.Further research is warranted to investigate the in vivo bioactivity, optimize extraction methods, and develop standardized preparations for commercial applications.
ACKNOWLEDGEMENTS
- The authors would like to thank the Department of Chemistry and the Department of Botany, Andijan State University, for providing laboratory facilities and plant identification services. Financial support from the Ministry of Higher Education, Science and Innovation of the Republic of Uzbekistan is gratefully acknowledged.
CONFLICT OF INTEREST
- The authors declare no conflicts of interest. This research received no specific grant from any funding agency in the public, commercial, or not-for-profit sectors.